
Recomendados
Recomendados
Más contenido relacionado
La actualidad más candente
La actualidad más candente (20)
Destacado
Similar a Sea level rise, emerging issues paper, royal society of new zealand, sept 2010
Similar a Sea level rise, emerging issues paper, royal society of new zealand, sept 2010 (20)
Más de petergnz
Más de petergnz (20)
Último
Último (20)
Sea level rise, emerging issues paper, royal society of new zealand, sept 2010
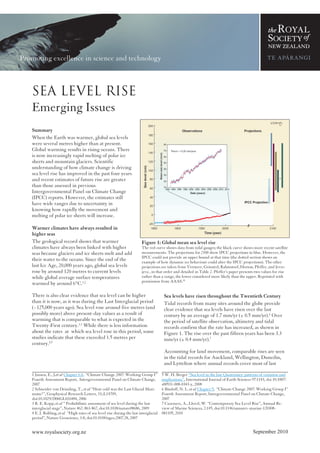
- 1. SEA LEVEL RISE Sea Level Rise Emerging Issues Summary When the Earth was warmer, global sea levels were several metres higher than at present. Global warming results in rising oceans. There is now increasingly rapid melting of polar ice sheets and mountain glaciers. Scientific understanding of how climate change is driving sea level rise has improved in the past four years and recent estimates of future rise are greater than those assessed in previous Intergovernmental Panel on Climate Change (IPCC) reports. However, the estimates still have wide ranges due to uncertainty in knowing how rapidly the movement and melting of polar ice sheets will increase. Warmer climates have always resulted in higher seas The geological record shows that warmer Figure 1: Global mean sea level rise climates have always been linked with higher The red curve shows data from tidal gauges; the black curve shows more recent satellite seas because glaciers and ice sheets melt and add measurements. The projections for 2100 show IPCC projections in blue. However, the IPCC could not provide an upper bound at that time (the dotted section shows an their water to the oceans. Since the end of the example of how dynamic ice behaviour could alter the IPCC projections). The other last Ice Age, 20,000 years ago, global sea levels projections are taken from Vermeer, Grinsted, Rahmstorf, Horton, Pfeffer, and Jevre- rose by around 120 metres to current levels jeva , in that order and detailed in Table 2. Pfeffer’s paper presents two values for rise while global average surface temperatures rather than a range, the lower considered more likely than the upper. Reprinted with permission from AAAS.10 warmed by around 6°C.1,2 There is also clear evidence that sea level can be higher Sea levels have risen throughout the Twentieth Century than it is now, as it was during the Last Interglacial period Tidal records from many sites around the globe provide (~125,000 years ago). Sea level rose around five metres (and clear evidence that sea levels have risen over the last possibly more) above present-day values as a result of century by an average of 1.7 mm/yr (± 0.5 mm/yr).6 Over warming that is comparable to what is expected in the the period of satellite observation, altimetry and tidal Twenty-First century.1,3 While there is less information records confirm that the rate has increased, as shown in about the rates at which sea level rose in this period, some Figure 1. The rise over the past fifteen years has been 3.3 studies indicate that these exceeded 1.5 metres per mm/yr (± 0.4 mm/yr).7 century.4,5 Accounting for land movement, comparable rises are seen in the tidal records for Auckland, Wellington, Dunedin, and Lyttelton where annual records cover most of last 1 Jansen, E., J.et al Chapter 6.4, “Climate Change 2007: Working Group I” 5 W. H. Berger “Sea level in the late Quaternary: patterns of variation and Fourth Assessment Report, Intergovernmental Panel on Climate Change, implications”, International Journal of Earth Sciences 97:1143, doi 10.1007/ 2007 s00531-008-0343-y, 2008 2 Schneider von Deimling, T., et al “How cold was the Last Glacial Maxi- 6 Bindoff, N. L. et al Chapter 5, “Climate Change 2007: Working Group I” mum?”, Geophysical Research Letters, 33,:L14709, Fourth Assessment Report, Intergovernmental Panel on Climate Change, doi:10.1029/2006GL026484, 2006 2007 3 R. E. Kopp, et al “ Probabilistic assessment of sea level during the last 7 Cazenave, A., Llovel, W. “Contemporary Sea Level Rise”, Annual Re- interglacial stage”, Nature 462: 863-867, doi:10.1038/nature08686, 2009 view of Marine Sciences, 2:145, doi:10.1146/annurev-marine-120308- 4 E. J. Rohling, et al “High rates of sea-level rise during the last interglacial 081105, 2010 period”, Nature Geoscience, 1:8, doi:10.1038/ngeo.2007.28, 2007 www.royalsociety.org.nz September 2010
- 2. SEA LEVEL RISE century. The rise around New Zealand has been close to Melting of polar ice sheets will drive sea level rise but the the global trend.8 However, evidence of an accelerating rate maximum rate of ice loss is uncertain has not yet been seen in the New Zealand tidal record.9 Key to the uncertainty about the rate of sea level rise is the behaviour of the vast ice sheets covering Antarctica and Projections of sea level rise have changed dramatically over Greenland. Ice loss from Greenland and West Antarctica the last four years may become the predominant driver of sea level rise The causes of sea level rise over most of the past fifty years towards the end of this century and beyond.13 Several have recently become better understood, the rise being studies suggest there has been an increasing rate of ice loss driven by thermal expansion of oceans due to warming and over the last two decades and recent changes are shown in the loss of land-based ice on Greenland and Antarctica and Figure 2.7,14 on mountains.10,11 Researchers are only starting to quantify the processes that The IPCC’s 2007 report presented model results suggesting change the rates of loss from ice sheets as temperature rises. a global sea level rise for 2090-99 compared to 1980-99 of 18 Floating ocean ice shelves can hold back on-shore ice but -59 cm, with a caveat of a further 10-20 cm covering some are susceptible to sudden disintegration. Thinning ice at ice-sheet contributions. There was insufficient evidence to the margins of ice sheets allows warmer water to penetrate include the effects of possible future rapid dynamical under ice sheets where the bedrock is below sea level. changes in ice flow and the IPCC stated that “the upper These processes are difficult to model with numerous values of the ranges given are not to be considered upper possible positive feedbacks (and few negative feedbacks). bounds for sea level rise”.12 The data to inform these models are also currently limited and difficult to measure. For example, many of these Over the past four years, researchers have made progress in processes depend upon the land profile at the base of polar understanding polar ice sheet processes, informed largely ice sheets and upon the temperature of water under by rapidly improving satellite observations. As yet, these floating ice sheets. The rate at which polar oceans will processes are not included in mechanistic models of ice warm and the distribution of that warming is uncertain sheet behaviour. In the absence of such robust models, and will affect the rate of ice sheet loss. researchers have relied upon simple semi-empirical approaches – extrapolating from past temperature and sea Most new estimates of sea level rise are based on models level records. There is a wide range in these projections that use past behaviour as a guide to future ice sheet loss because of current limits of understanding. A key research and consequent sea level rise.15-19 This approach assumes goal is to develop models that properly simulate the that future behaviours will be driven by the same factors as important physical processes and supersede the semi- past behaviour, an assumption that may not hold.20 empirical approaches. Figure 1 shows several recent However, these models project rises that are physically projections for 2100. However, our limited understanding plausible and comparable to those seen in the Last does not yet allow us to be certain about the probability of a Interglacial. Another approach uses present observations given rise by a given time. of the maximum speeds of glaciers to justify “physically plausible” rates of ice sheet loss.13 These approaches have Source 1961-2003 contribution 1993-2007 contribution Relationship with global warming mm/yr 11 mm/yr 7 Polar ice sheets 0.5 ± 0.2 0.7 ± 0.2 Poorly known Likely to increase with warming Thermal expansion 0.52 ± 0.08 1.0 ± 0.3 Well known, increasing with warming Other land-based ice 1.1 ± 0.25 Well known, increasing with warming Dams and ground-water Variable but small Close to zero Dependent upon human response to pumping warming Modelled sum of sources 1.5 ± 0.4 2.85 ± 0.35 Observed rise 1.6 ± 0.2 3.3 ± 0.4 Table 1: A summary of explanations of current global sea level rise 8 Hannah, J. “An updated analysis of long-term sea level change in New 13 Pfeffer, W.T., et al “Kinematic Constraints on Glacier Contributions to Zealand”, Geophysical Research Letters, 31:03307, 21st-Century Sea-Level Rise”, Science, 321:1340, doi: 10.1126/ doi:10.1029/2003GL019166, 2004 science.1159099, 2008 9 Hannah, J. University of Otago, personal communication 14 Velicogna, I. “Increasing rates of ice mass loss from the Greenland and 10 Nicholls, R.J., Cazenave, A. “Sea-Level Rise and Its Impact on Coastal Antarctic ice sheets revealed by GRACE”, Geophysical Research Letters, Zones”, Science, 328: 1517, doi:10.1126/science.1185782, 2010 36:19503, doi:10.1029/2009GL040222, 2009 11 Domingues, C.M, et al “Improved estimates of upper-ocean warming 15 Rahmstorf, S. et al “A Semi-Empirical Approach to Projecting Future and multi-decadal sea-level rise”, Nature 453:1090-93, doi:10.1038/ Sea-Level Rise”, Science, 315:368, doi:10.1126/science.1135456, 2007 nature07080, 2008 16 Horton, R. et al “Sea level rise projections for current generation 12 “Climate Change 2007: Synthesis Report”, Fourth Assessment Report, CGCMs based on the semi-empirical method”, Geophysical Research Let- Intergovernmental Panel on Climate Change, 2007 ters, 35:02715, doi:10.1029/2007GL032486, 2008 www.royalsociety.org.nz September 2010
- 3. SEA LEVEL RISE Figure 2: Recent polar ice loss. Estimates of loss from ice sheets, from measurements by the GRACE satellites. Blue crosses are unfiltered data, red and green show filtered trends.13 also been backed up by new and consistent estimates of the Thermal expansion of the oceans makes a simpler rate at which sea level rose during the Last Interglacial.4 contribution Figure 1 shows several projections made using a variety of The other main cause of sea level rise is easier to predict — methods. With the inclusion of dynamic ice sheet as the oceans heat up, they expand and this expansion behaviour, all extend substantially above the model increases as ocean temperatures increase. This rise is projections without future rapid changes in dynamic becoming better understood as ocean models improve and behaviour from the IPCC’s Fourth Assessment Report. use the increasing amounts of data available from satellites, deep ocean probes, and ocean buoys. The connection between the rate of temperature rise and the rate of ice loss is another question which currently The rise will depend upon the magnitude of warming that cannot be answered with certainty. There may be limits to occurs, which in turn depends upon global emissions of the rate of ice sheet melt in a warmer world, or ice sheets greenhouse gases. Greenhouse gas emissions have been in may influence their own behaviour and set their own speed the upper end of the range of IPCC emissions scenarios for ice loss.20 There is no reason to think that higher over the last decade.21 Even with a halving of global temperatures could lead to a slower rate of sea level rise. emissions by 2050, there is still a substantial chance of warming above 2°C by 2100.22 Thus the world is already Non-polar ice loss adds to sea level rise committed to substantial warming and a consequent future Smaller ice caps and glaciers in the major mountain ranges, sea level rise due to thermal expansion.23 including those in New Zealand, have a simpler and better understood response to warming than do polar ice sheets. New Zealand’s tectonics may be fast enough to alter local The current contribution of these glaciers to sea level rise is sea level rise risks similar to that of thermal expansion but the maximum total While, within the limits of present measurement capability, rise from this source is estimated to be around 0.35 metres the majority of the New Zealand landmass appears to be before the majority of non-polar glaciers are lost.7 relatively stable (despite an expected rise due to a slow adjustment following the last Ice Age), earthquake activity Source Sea level rise by 2100 (m) can quickly alter this situation. While the long-term Pfeffer 13 0.8 plausible (2.0 maximum possible) ongoing tectonic effect is small when compared with changes in ocean height, the data we have do not allow us Rahmstorf15 0.5 - 1.4 to rule out local changes of height which may increase local Horton 16 0.5 - 1.0 risks in areas where strong subsidence is taking place.8, 24 Grinstead 17 0.3 - 2.2 Recent research presents a range of projections above Vermeer 18 0.75 - 1.9 existing guidance Climate change may cause several metres of sea level rise Jevrejeva 19 0.6 - 1.6 over the next thousand years.23 For the decades and centuries that are important for planning purposes, we Table 2: Recent scientific projections of sea level rise by 2100 cannot yet state the likelihood of a given rate of sea level 17 Grinstead, A., et al “Reconstructing sea level from paleo and projected 19 Jevrejeva, S., et al “How will sea level respond to changes in natural and temperatures 200 to 2100AD”, Climate Dynamics, 34:461, doi:10.1007/ anthropogenic forcings by 2100?” Geophysical Research Letters, 37:07703 s00382-008-0507-2, 2009 doi:10.1029/2010GL042947, 2010 18 Vermeer, M. et al “Global sea level linked to global temperatures”, Pro- 20 Lowe, J.A, Gregory, J.M. “A sea of uncertainty” Nature Reports 4: 42 ceedings of the National Academy of Sciences, 106:21527-21532, doi:10.1038/climate.2010.30, 2010 doi:10.1073 pnas.0907765106, 2009 21 Manning, M., et al “Misrepresentation of the IPCC CO2 emission scenar- ios” Nature Geoscience, 3:376-377, 2010 www.royalsociety.org.nz September 2010
- 4. SEA LEVEL RISE Source Sea level rise by 2100 (m) Department of Climate Change, Australia26 0.6 m plausible, 1.5 m “cannot be ruled out”, risk assessment level 1.1 m Dept of Environment, Climate Change & Water, NSW27 0.9 m Department of Environment & Resource 0.8 m Management, Queensland28 California Climate Change Center, USA29 1.0 - 1.4 m by 2100 DEFRA, UK30 0.12 - 0.76 m, extreme scenario 1.9 m Deltacommissie, The Netherlands 31 0.55 - 1.2 m, planning level 1.1 m United Nations Environment Programme 32 0.5 - 1.4 m Climate Change Research Centre, UNSW33 Double IPCC estimates International Alliance of Research Universities 34 0.5 - 1.5 m Table 3: Recent international projections of sea level rise by 2100 relevant to coastal planning rise. However, our uncertainty is mostly one-sided, with Sea level rise compounds known coastal hazards more possible effects that might hasten sea level rise than Twelve of New Zealand’s fifteen largest towns and cities might slow it. are coastal. They are already exposed to coastal hazards from current climate variability and weather events: coastal New research has generated a range of projected rises that erosion; flooding from storm surges, waves and swell, king are considered reasonable, and rises considered plausible. tides, and extreme rainfall; and salt intrusion into Risk management is becoming important as a way of groundwater. Sea level rise will compound these hazards combining the range of potential future changes with the both in terms of frequency and intensity of hazards. cost of their impacts and this provides a clear basis for Several city and regional councils have projects underway taking account of the upper side of estimated ranges. This to quantify the change to these hazards. We have a good approach can allow for planning that does not lock in understanding of many processes involved in existing vulnerability, should an extreme scenario occur. Existing threats, and past data to guide risk assessment. However, Ministry for the Environment guidance reflects this sea level rise adds another dimension to consider in such approach (0.5 metres is considered as a base rise by 2090- risk assessments because the magnitude and rate of rise is 2099, “along with an assessment of the potential poorly known, as is the way in which our coastline may consequences from a range of possible higher sea-level respond these changes. rises… all assessments should consider the consequences of… at least 0.8 m”, with further rise expected beyond Contributors and Reviewers 2100.25 That guidance was based on the IPCC Fourth Assessment Report and science available to 2008 (which Dr John Beavan, Dr Rob Bell, Dr Robert Bindschadler, included the first Rahmstorf & Horton estimates in Dr John Church, Prof John Hannah, Prof Keith Hunter, Table 2); more recent research has suggested the ranges of Dr Andrew Mackintosh, Prof Martin Manning, values shown by the last four estimates in Table 2. Other Prof Tim Naish, Doug Ramsay, Richard Reinen-Hamill, international work being used for coastal planning, Dr Andy Reisinger, Dr James Renwick, Zach Rissel, vulnerability analysis, engineering design, and scientific Prof Caroline Saunders, Dr David Wratt, Dr Dan Zwartz advice is summarised in Table 3. For further information, please contact Dr Jez Weston Jez.weston@royalsociety.org.nz 22 Meinshausen, M., et al “Greenhouse-gas emission targets for limiting 29 California Climate Change Center, USA “The Impacts of Sea-Level global warming to 2°C”, Nature 458:1158, doi:10.1038/nature08017, 2009 Rise on the California Coast”, 2009 23 Solomon, S. et al “Irreversible climate change due to carbon dioxide 30 DEFRA, UK “UK Climate Projections: Briefing Report”, 2009 emissions”, Proceedings of the National Academy of Sciences 106:1704 31 Deltacommissie, The Netherlands “Working together with water: A doi:10.1073/pnas.0812721106, 2009 living land builds for its future”, 2008 24 Beavan, J., Hannah, J. paper in progress 32 United Nations Environment Programme, “Climate Change Science 25 Ministry for the Environment “Coastal Hazards and Climate Change. A Compendium”, 2009 Guidance Manual for Local Government in New Zealand. 2nd edition” 33 Climate Change Research Centre, University of New South Wales “The Revised by Ramsay, D, and Bell, R. (NIWA). 2008 Copenhagen Diagnosis”, 2009 26 Department of Climate Change, Australia “Climate Change Risks to 34 International Alliance of Research Universities “Synthesis Report from Australia’s Coast: A first pass national assessment”, 2009 Climate Change, Global Risks, Challenges & Decisions”, 2009 27 Department of Environment, Climate Change & Water, New South Wales “Sea-level Rise Policy Statement”, 2009 28 Department of Environment & Resource Management, Queensland Except for figures & the RSNZ logo, “Queensland Coastal Plan: Draft State Planning Policy Coastal Protection“, Emerging Issues papers are licensed under a 2009 Creative Commons 3.0 New Zealand Licence. www.royalsociety.org.nz September 2010