SlideShare una empresa de Scribd logo
1 de 63
Descargar para leer sin conexión
contents
    contents
    Profile, mission, vision 2015 and values
    Highlights
    Message from the president
    The conquest of self-sufficiency
    Conduct of the oil market
    Corporate strategy

    our businesses in brazil
     22   Exploration and Production
     29   Refining and Commercialization
     32   Petrochemicals
     35   Transportation
     37   Distribution
     40   Natural Gas
     44   Energy

    I N T E R N AT I O N A L A C T I V I T I E S
     54   South America
     60   North America
     61   Africa
     62   Asia

    S O C I A L A N D E N V I R O N M E N TA L R E S P O N S I B I L I T Y
     66   Social Investiments
     71   Human Resources
     75   Health, Safety, and Environment

    I N TA N G I B L E A S S E TS
     84   Technological Know-how Capital
     87   Organizational Capital
     88   Relationship Capital
     91   Human Capital

    BUSINESS MANAGEMENT
     94   Business Performance
     97   Capital Markets
     103 Risk Management
     106 Corporate Governance
     112 Corporate Information
     116 Glossary, Abbreviations and Addresses
petrobras in brazil and overseas
                                                                                                                                                                                     profile
                                                                                                                                                                                       p r of i l e
                                                                                                                                                                                                                                                 mission
                                                                                                                                                                                                                                                 To operate safely and profitably in
                                                                                                                                                                                                                                                 the oil, gas and energy domestic
                                                                                                                                                                                     Petrobras is a publicly listed company that
                                                                                                                                                                                                                                                 and international markets in a socially
                                                      ENGLAND                                                                                                                        operates on an integrated and specialized basis             and environmentally responsible

                                                                                                                                                                                     in the following segments of the oil, gas and               manner, supplying products and
              T H E U N I T E D STAT ES
                                                                                    L I BYA
                                                                                                                                                                         JA PA N                                                                 services to meet the needs of its
                                                                                                                   IRAN
                                                                                                                                                            CHINA
                                                                                                                                                                                     energy industry: exploration and production;
                                                                                                                                                                                                                                                 customers and contributing to the
M E X I CO
                                                                                                                                                                                     refining, commercialization, transportation and             development of Brazil and the
                                 VENEZUELA
       CO LO M B I A
                                                             NIGERIA                                                                                                                 petrochemicals; distribution of oil products;               countries in which it operates.
      EC UA D O R                               EQ UATO R I A L G U I N E A                                                    SINGAPURE
              PERU
                                   BOLIVIA
                                                                                                      TA N Z A N I A                                                                 natural gas and energy. Founded in 1953, the
                                                                  A N GO L A

                                     PA R AG UAY                                                                                                                                     Company today is the world’s 14th largest oil
                 CHILE

                                      U R U G UAY                                                                                                                                    company according to Petroleum Intelligence                 va l u e s
                                 ARGENTINA
                                                                                                                                                                                     Weekly. Leader in the Brazilian hydrocarbons
                                                                                                                                                                                                                                                   Focus on the Company’s main
                                                                                                                                                                                     sector, Petrobras has been expanding its                      stakeholders: shareholders,

                                                                                                                                                                                     operations to become an integrated energy                     customers, employees, society,
                                                                                                                                                                                                                                                   government, partners, suppliers
                                                                                                                                                                                     company with international operations and a
                                                                                                                                                                                                                                                   and the communities in which
                                                                                                                                                                                     leader in Latin America.                                      it operates;


                                                                                                                                                                                     vision5
                                                                                                                                     BELÉM                                                                                                         A spirit of entrepreneurship and
                                                                              REMAN                                                          SÃO LUÍS
                                                                                                                                                           FORTALEZA
                                                                                                                                                                                                                                                   an ability to meet challenges;
                                                                                     Coari
                                                                                              MANAUS
                                                                                                                                                  LUBNOR
                                                                                                                                                              Mucuripe

                                                                                                                                                                        Guamaré
                                                                                                                                                                         Dunas
                                                                                                                                                                          NATAL
                                                                                                                                                                                         2 0 1
                                                                                                                                                                                       vision 2015
                                                                                                                                                                                                                                                   Focus on obtaining excellent results;
                                                                                                                                                   JOÃO PESSOA
                                                                                                                                                 Campina Grande           Cabedelo
                                                                                                                                                                         RECIFE                                                                    Innovative and competitive spirit
                                                                                                                                                                         Suape
                                                                                                                                                                        MACEIÓ       P E T R O B R A S W I L L B E A N I N T E G R AT E D
                                                                                                                                                                      Candeias                                                                     with a focus on providing services
                                                                                                                                                                   ARACAJU
                                                                                                                                                 RLAM
                                                                                                                                                                                     E N E R G Y C O M PA N Y W I T H A S T R O N G
                                                                                                                                                  DTBAS
                                                                                                                                                            SALVADOR
                                                                                                                                                                                                                                                   with a competitive edge and
                                                                                                                           BRASÍLIA
                                                                                                                       Sen. Canedo              Jequié
                                                              COCHABAMBA
                                                                                         SANTA CRUZ
                                                                                         DE LA SIERRA
                                                                                                                                                            Itabuna                  I N T E R N AT I O N A L P R E S E N C E A N D T H E          technological competence;
                                                                                                                   GOIÂNIA
                                                                                                                                                ESPÍRITO SANTO
                                                                      Gualberto
                                                                       Villarroel
                                                                                             Guillermo
                                                                                             Elder Bell
                                                                                                                                        REGAP               Norte-Capixaba           L E A D E R I N L AT I N A M E R I C A , O P E R AT I N G     Excellence and leadership in
                                                                                                                                                             Regência
                                                                                                                   UBERABA
                                                                                                                                                         VITÓRIA                                                                                   questions of health, safety and the
                                                                                                                                        REVAP                                        W I T H I T S F O C U S O N P R O F I TA B I L I T Y
                                                                                                                        REPLAN                     Macaé
                                                                               PARAGUAI                                                          REDUC                                                                                             preservation of the environment;
                                                                                                                         RECAP               RIO DE JANEIRO
                                                                                                            REPAR                 RPBC São Sebastião                                 A N D S O C I A L A N D E N V I R O N M E N TA L
                                                                      REFINOR                                                       Paranaguá
                                                                                                              SÃO PAULO
                                                                                                                                   São Francisco do Sul (DTSUL)                                                                                    A permanent quest for business
                                                                                                             SIX       CURITIBA                                                      R E S P O N S I B I L I T Y.
                                                                                                              REFAP
                                                                                                                                     FLORIANÓPOLIS                                                                                                 leadership.
                                                                                                                                 Tramandaí
     Pipelines                                                          ARGENTINA
                                                                                                             Copesul
                                                                                                                           PORTO ALEGRE
     Fertilizer Plant                                                      REFISAN
                                                                                                      URUGUAI             Terminal de
     Refinery                                                                                                             Rio Grande

     Terminal
     Petrobras overseas
                                                                  Bahía Blanca
                                                            RICARDO ELIÇABE
HIGHLIGHTS
 HIGHLIGHTS
   HIGHLIGHTS                                                                                               ORIGIN OF NATURAL GAS (million m3/day)        (4)
                                                                                                                                                                                                                           42         45
                                                                                                             Domestic gas                                                                                                  23         23
                                                                                                             Bolivian gas                                                                                                  19         22
  Operational summary | 2005
                                                                                                            NATURAL GAS MARKET DISTRIBUTION (million m3/day)             (4)
                                                                                                                                                                                                                           42         45
                                                                                                             Distributors                                                                                                  28         31
                                                                                          2004     2005      Thermoelectric power plants                                                                                    7             7
                                                                                 (1)(2)
  PROVED RESERVES – SPE criteria (billions of barrels of oil equivalent - boe)              14.9     14.9    Domestic consumption                                                                                           7             7
      Oil and condensate (billions of barrels)                                              12.1     12.3
                                                                                                                      (1)
      Natural gas (billions of boe)                                                          2.8      2.6   ENERGY
                                                                                                             Number of thermoelectric power plants(5)                                                                       7             9
                                                     (1)
  AVERAGE DAILY PRODUCTION (th. boed)                                                      2,020    2,217    Installed capacity (MW)(5)                                                                                  2,194      3,203
  • Oil and NGL (th. bpd)                                                                  1,661    1,847    Energy sales (GWh)                                                                                          11.32      16.64
      Onshore                                                                               407      396     Number of hydroelectric power plants                                                                           2             2
      Offshore                                                                             1,254    1,451    Installed capacity (MW)(5)                                                                                   285        285
  • Natural gas (th. boed)                                                                  359      370     Transmission lines (km)                                                                                    15,414     15,414
      Onshore                                                                               217      213     Energy distribution (TWh/year)                                                                                13             13
      Offshore                                                                              142      157
                                                                                                                             (1)
                                                                                                            FERTILIZERS
                                                                (1)
  PRODUCING WELLS (oil and natural gas) – 12/31/2005                                      13,821   14,061    Number of plants                                                                                               3             3
      Onshore                                                                             13,156   12,803
                                                                                                            Some 2004 data were revised due to changes in the criteria.
      Offshore                                                                              665     1,258
                                                                                                            (1) Includes overseas data, corresponding to Petrobras’ stake in each partnership
                                                                                                            (2) Proved reserves are calculated according to SPE (Society of Petroleum Engineers) criteria
  DRILLING RIGS – 12/31/2005                                                                 50       64
                                                                                                            (3) Includes Transpetro’ port terminals only
      Onshore                                                                                19       22    (4) Excludes flare off, own E&P consumption, liquefaction and reinjection
      Offshore                                                                               31       42    (5) Includes only assets with an equity stake equal or larger than 50%

  OPERATING PRODUCTION PLATFORMS – 12/31/2005                                                95       97
      Fixed                                                                                  72       73    Financial summary | 2005
      Floating                                                                               23       24

  PIPELINES (km) – 12/31/2005                 (1)
                                                                                          30,039   30,343    INVESTMENTS                                                                                                     R$ million

      Oil and oil products                                                                12,553   12,857                                                                                                                 2004       2005
      Natural gas                                                                         17,486   17,486    Own Investments                                                                                             21,151     22,927
                                                                                                             Exploration & Production                                                                                    12,441     13,934
  TANKER FLEET – 12/31/2005
                                                                                                             Supply                                                                                                       3,907      3,286
      Vessels - company owned                                                                50       50
                                                                                                             Gas & Energy                                                                                                  625       1,527
                 - chartered                                                                 74       75
                                                                                                             International                                                                                                2,331      3,153
      Tons (millions of deadweight tons - dwt)                                                8        8
                                                                                                             Distribution                                                                                                 1,223           495
  TERMINALS – 12/31/2005                                                                                     Corporate Areas                                                                                               624            532
      Number                                                                                 65       66     Special Purpose Companies (SPCs)                                                                              775       2,385
      Storage capacity (million m3)     (3)
                                                                                             9.9     10.4    Ventures under Negotiation                                                                                    454            311
                                                                                                             Project Finance                                                                                               169             87
                                      (1)
  REFINERIES – 12/31/2005                                                                                    Total Investments                                                                                           22,549     25,710
      Number                                                                                 16       16
      Nominal installed capacity (th. bpd)                                                 2,114    2,114
                                                                                                              C O N S O L I DAT E D              FINANCIAL            I N F O R M AT I O N                                   R$ million
      Average throughput processed (th. bpd)                                               1,847    1,861
                                                                                                                                                                                                               2004       2005             %
        Brazil                                                                             1,728    1,758
                                                                                                             Gross Operating Revenue                                                                          150,440   179,065       19%
        Overseas                                                                            119      103
                                                                                                             Net Operating Revenue                                                                            111,128   136,605       23%
      Average daily production of oil products (th. bpd)                                   1,797    1,839
                                                                                                             Operating Profit                                                                                  29,930    39,773       33%
  IMPORTS (th. bpd)                                                                                          Financial Result                                                                                 (3,321)   (2,843)       -14%
      Oil                                                                                   450      352     Net Income                                                                                        16,887    23,725       40%
      Oil products                                                                          109       94     Net Income per Share (R$/share)                                                                     3.85      5.41       41%
                                                                                                             EBITDA                                                                                            36,798    47,808       30%
  EXPORTS (th. bpd)
                                                                                                             Total Debt                                                                                        55,803    48,242       -14%
      Oil                                                                                   181      263
                                                                                                             Net Debt                                                                                          35,816    24,825       -31%
      Oil products                                                                          228      241
                                                                                                             Market Value                                                                                     112,458   173,584       54%
  COMMERCIALIZATION OF OIL PRODUCTS (th. bpd)                                                                Gross Margin                                                                                        41%       44%            3%
      Brazil                                                                               1,637    1,655    Operating Margin                                                                                    27%       29%            2%
                                                                                                             Net Margin                                                                                          15%       17%            2%
  INTERNATIONAL SALES (th. bpd)
                                                                                                             Financial and Economic Indicators
      Oil, Gas and Oil Products                                                             416      385
                                                                                                             Brent (US$/bbl)                                                                                    38.21     54.38       42%
                                                                                                             US Dollar Average Price - Sale (R$)                                                               2.9262    2.4350       -17%
                                                                                                             US Dollar final Price - Sale (R$)                                                                 2.6544    2.3407       -12%


  4         PETR OBRA S        annual               report   2005                                                                                                                               PETR OBRA S   annual     report      2005       5
HIGHLIGHTS
                                                                                                                                                                                                                                                                       HIGHLIGHTS
   Voting Capital – Common Shares

              2005                                        2004
      2.8%          1.9%                        2.8%           1.9%                    Production of Oil, NGL,
   4.6%                                      4.9%
                                                                                                                                                                                                                                                                       Gross Margin, Operating and Net                                                      (1)
 7.5%                                      7.9%                                        Condensate and Natural Gas
                                                                                                                                                                         Oil and Oil Products Spill (m3)                                                               BR GAAP Criteria
                                                                                       (th. boed)                                                                                                                                                                                                                      45%                                  44%
                                                                                                                                                                                                                                                                                                                                             41%
                                                                                                                                                                                                                                                                                 39%
                                 55.7%                                  55.7%   2001                                     1,381      258         1,639
                                                                                                                                                                  2001                                                 2,619                                                                    36%
27.5%                                     26.7%
                                                                                2002                                        1,535        275     1,810                                                                                                                                                      29%                                     29%
                                                                                                                                                                  2002        197                                                                                                                                                  27%
                                                                                                                                                                                                                                                                         24%
        Federal Government                                                      2003                                             1,701         335      2,036                                                                                                                           20%
                                                                                                                                                                  2003         276                                                                                                                     19%
                                                                                                                                                                                                                                                                      17%                                                                          17%
        BNDESPar                                                                                                                                                                                                                                                                                                             15%
                                                                                2004                                             1,661         359       2,020                                                                                                                         12%
        ADR Level 3                                                                                                                                               2004               530
        FMP – FGTS Petrobras
                                                                                2005                                               1,847         370      2,217                269
        Foreign Investors (Resolution no. 2.689 C.M.N.)                                                                                                           2005                                                                                                   2001            2002                   2003               2004              2005
        Other individuals and legal entities
                                                                                          Oil, NGL and Condensate                                                                                              3
                                                                                                                                                                         Spills of more than 1 barrel (0.159 m ) impacting                                                Gross Margin
                                                                                          Natural Gas                                                                    the environment outside the installation perimeter.                                              Operating Margin
                                                                                                                                                                                                                                                                          Net Margin
   Voting Capital - Preferred Shares

               2005                                       2004                                                                                                                                                                                                         Debt – BR GAAP Criteria
                                                                                       Proved Reserves of Oil, NGL, Condensate
                                                                                                                                                                                                                                                                       (R$ billion)(1)(3)
    15.7%                                         15.2%                                and Natural Gas SPE Criteria
                                                                                                                                                                         Net Income                                                                                                                             3.3
                                                                                       (billions boed)
                                  37.1%                                37.2%                                                                                             BR GAAP criteria                                                                                                1.3                49.6
15.5%                                     15.8%                                                                                                                                                                                                                                                                                   46.2
                                                                                2001                         8.5     2.1     10.6                                        (R$ million)(1)                                                                                                44.2
                                                                                                                                                                                                                                                                                         40
                                                                                2002                               9.9                                                                                                                                                                                                            35.8               37.1
                                                                                                                           2.3    12.2                            2001                         9,867
    31.7%                                      31.8%                                                                                                                                                                                                                                                        34.7
                                                                                2003                                     11.6      2.9     14.5                   2002                      8,098
                                                                                                                                                                                                                                                                                                                                                     24.8
        BNDESPar
                                                                                2004                                       12.1     2.8        14.9               2003                                             17,795                                                18.2
        ADR Level 3 and Rule 144-A
                                                                                                                                                                                                                                                                          9.7
        Foreign Investors (Resolution no. 2.689 C.M.N.)                         2005                                       12.3     2.6        14.9                                                           16,887
                                                                                                                                                                  2004                                                                                                    8.5            8.1                10.9                    9.6             11.1
        Other individuals and legal entities
                                                                                                                                                                                                                                                                         2001           2002               2003                  2004               2005
                                                                                         Oil, NGL and Condensate                                                  2005                                                         23,725
                                                                                                                                                                                                                                                                          Short-Term
                                                                                         Natural Gas                                                                                                                                                                      Long-Term
   Capital Stock
                                                                                                                                                                                                                                                                          Funds obtained but still not used in projects

                 2005                                         2004                                                                                                                                                                                                        Net Debt
                                                                                                                                                                         Earnings/Share
           2.7%                                        2.8%                            Lost Time Injury                                                                  BR GAAP Criteria
   7.6%                       32.2%             7.8%                  32.2%
                                                                                                                                                                                                                                                                       Market Capitalization x Net Equity
                                                                                       Frequency Rate (LTIFR)                                                            (R$/share)(1)(2)
  8.2%                                         8.1%
                                                                                                                                                                                                                                                                       (R$ billion)(1)
                                                                                                                                                                                                                                                                                                                                                         174
                                                                                2001                                                           2.89               2001                        2.27
15.7%                                    15.4%
                                                                                2002                               1.53                                           2002                     1.86                                                                                                                              112
  15.9%                                        15.7%
                              17.7%                                   18.0%                                                                                                                                                                                                                                87
                                                                                2003                          1.23                                                2003                                        4.06                                                                                                                                       78
                                                                                                                                                                                                                                                                        56              54
        Federal Government                                                                                                                                                                                  3.85                                                                                                                       62
                                                                                2004                       1.04                                                   2004
                                                                                                                                                                                                                                                                                                                  49
        BNDESPar                                                                                                                                                                                                                                                                             34
                                                                                                                                                                                                                                                                       29
        ADR (ON Shares)                                                         2005                     0.97                                                     2005                                                      5.41                                        2001            2002                2003                 2004               2005
        ADR (PN Shares)                                                                                                                                                                                                                                                   2001           2002                   2003                2004             2005
                                                                                                                                                                                                                                                                          Market Capitalization                          Net Equity
        FMP – FGTS Petrobras
                                                                                                                                                                                                                                                                                             Valor de Mercado            Valor Patrimonial
        Foreign Investors (Resolution no. 2.689 C.M.N.)                                Number of lost time injuries per million                                          (1) The 2004 and 2005 fiscal years include the Specific Purpose Companies whose activities are controlled, directly or indirectly, by Petrobras
        Other individuals and legal entities                                           men-hours of exposure to risk.                                                    (2) For the effects of comparison, Net Earnings per share were recalculated for the previous periods as a result of the share split approved by the
                                                                                       Note: LTIFR covers employees and                                                  AGM of July 22, 2005.
                                                                                       outsourced workers                                                                (3) The 2001, 2002 and 2003 fiscal years include debt contracted by the SPEs with which Petrobras structured "Project Finance" and consortia. The
   Commom shares - 2,536,673,672                                                                                                                                         2002, 2003, 2004 and 2005 fiscal years include leasing contracts.
   Preffered shares - 1,849,478,028
   Total shares - 4,386,151,700


                                                                                                                                                                                                                                                            PETR OBRA S                 annual                         report                      2005           7
MESSAGE FROM THE PRESIDENT
 MESSAGE FROM THE PRESIDENT                       MESSAGE FROM THE PRESIDENT
                                                              MESSAGE FROM THE PRESIDENT

MESSAGE FROM THE PRESIDENT


                                                             It is with special pride that I present the Company’s results for 2005, a year in which we set records for
                                                             production, profitability and investments. The Company ended the year with an annual daily production of oil
                                                             and gas of 2,217 million barrels of oil equivalent (boe), consolidated earnings of R$ 23,725 billion and total
                                                             investments of R$ 25,710 billion, all historical records.
                                                                In order to obtain these results, we implemented a vigorous plan of action based principally on the
                                                             continuation of a bold investment cycle that allows us to achieve sustainable returns over the medium and
                                                             long-term. This effort, initiated during the administration of President José Eduardo Dutra with whom I shared
                                                             the command of the company during 2005, made it possible to restructure our activities and improve our
                                                             strategic vision of the future.
 “ I N A S I T U AT I O N I N W H I C H A
                                                                In practical terms, I should mention that we passed the benchmark of 1.8 million barrels of oil per day
             SCARCITY OF ENERGY
                                                             (bpd) produced in Brazil, mainly due to the startup of the P-43 and P-48 platforms. We consider this a
 R E S O U R C E S , M A I N LY O I L , H A S
      BECOME MORE AND MORE                                   milestone in the ability of Petrobras’ technical and managerial staff to overcome challenges. In 2003, these
     E V I D E N T, A C H I E V I N G S E L F -              units were well behind in executing their projects and ran serious risks in contractual and
 SUFFICIENCY REPRESENTS AN                                   operational feasibility. Nevertheless, we were able to reverse the situation and today
     I M P O R TA N T S T E P TO WA R D S
                                                             the two rigs are operating at full production.
        REDUCING THE RISK AND
                                                                As a result, we were able to boost annual oil production in Brazil by 13%. This growth
  VULNERABILITY OF BRAZIL´S
             TRADE BALANCE. AND                              placed Petrobras in the ranks of companies with the highest rise in production in the
   P ET R O B R AS I S P R O U D TO B E                      world oil industry in 2005. Even with our expanded production, we were able to
          M A K I N G A N I M P O R TA N T                   guarantee a 131% replacement rate of our oil reserves. That is, for each barrel we
        CO N T R I B U T I O N TOWA R D S
                                                             produced, we replaced 1.31 barrels in our reserves, meaning that we continue to maintain
           R E A C H I N G T H I S G O A L .”
                                                             long-term sustainable growth.
                                                                In step with the restructuring of our exploration portfolio and the
                                                             preservation of sustainable growth, during the 7th Bidding Round
                                                             run by the National Petroleum, Natural Gas and Biofuel Agency
                                                             (ANP), Petrobras acquired 96 new exploratory blocks, of which
                                                             42 were exclusive and 54 were in partnership, totaling the
                                                             greatest number of exploratory areas in its portfolio since
                                                             the Agency began running the auctions.
                                                                We are now quite close to self-sufficiency in
                                                             providing oil and oil products to our main market
MESSAGE FROM THE
                                                                                                                                                               PRESIDENT
        — Brazil. This target, which is symbolic for Brazilian society, will materialize in a sustainable manner in 2006,   in its composition, and it already is fueling fleets of buses and trucks in large cities. Developed by
        as soon as the recently launched P-50 platform reaches its peak production capacity of 180,000 bpd in               Petrobras, the new fuel contributes to improve air quality and is part of the Company’s commitment to
        the Campos Basin. In a situation in which a scarcity of energy resources, mainly oil, has become more and           social and environmental responsibility.
        more evident, achieving self-sufficiency represents an important step towards reducing the risk and                    Moreover, the projects that have been approved by the current management in Brazil have a
        vulnerability of Brazil´s trade balance. And Petrobras is proud to be making an important contribution              commitment to domestic content of at least 60%, which will strengthen local industry and generate
        towards reaching this goal.                                                                                         thousands of direct and indirect jobs. Of particular note in this regard was the approval of the order for
           Petrobras has sought to expand its activities with the same entrepreneurial determination and spirit.            42 tankers — the largest to be given to the naval industry in the country.
        The Company’s project for international expansion is based upon the same ethical and business                          The confidence of our shareholders and investors in the Company’s results can be
        principles that are leading the Brazilian market to sustainable self-sufficiency. Thus, in 2005 Petrobras           measured by the performance of our shares. During the course of 2005, there was an
        intensified its activities in Africa, South America and United States, strengthening its international              increase in the average daily financial trading volume of Petrobras’ shares. After the
        presence. The Company’s overseas offensive also includes the purchase of assets in Colombia, Paraguay               stock split concluded in September 2005, to make shares more accessible to small
        and Uruguay, and the acquisition of 50% of the Passadena Refinery in the United States, an investment               and medium sized investors, Petrobras’ shares became the most-traded security on
        of some US$ 370 million that will add value to the oil produced by the Company.                                     the São Paulo Stock Exchange. We expanded our shareholder base and earned an
           Pursuing the same strategic objective of adding value to its products, Petrobras decided to build a new          investment grade rating from Moody’s Investor Service for our foreign currency debt
        refinery in the Northeast of Brazil, in the state of Pernambuco, with scheduled investments of US$ 2.5              — four levels higher than the classification of the Brazilian sovereign risk.
        billion. This is the first project for a Petrobras refining facility since conclusion of the Henrique Laje             Petrobras’ results in 2005 were reflected in the Company’s market capitalization,
        Refinery (Revap) in 1980 in the state of São Paulo.                                                                 which rose 54% in 2005. Today we are the 8th most valuable company in the sector in
           In the energy area, Petrobras took over full control of three power plants in 2005: TermoRio (1,040              the world and the highest valued in Latin America, according to Business Week magazine
        MW), Eletrobolt (388 MW) and TermoCeará (220 MW) — the latter two being Merchant type plants. In                       In the following pages, you will find greater detail about Petrobras’ results in 2005.
        February 2006, we signed a memorandum of understanding for the acquisition of the Macaé Merchant                    They were conquests that consecrated the efforts of our employees and suppliers
        Plant (929 MW), thus reducing the need to make contingency payments. We took major steps to expand                  along with the trust of our shareholders and customers.
        natural gas distribution infrastructure with the approval of projects such as the Southeast-Northeast
        Interconnection Pipeline (Gasene) and the expansion of the Southeast and Northeast grids, satisfying the
                                                                                                                            JOSÉ SERGIO GABRIELLI DE AZEVEDO
        growing demand for our product.                                                                                     President and CEO of Petrobras

           One of the underpinnings of our action plan has been continuous massive investment in technological
        development. And the results can be seen in, for example, the national record for drilling depth: a slanting
        well that reached 6,915 meters below the sea bottom in the Santos Basin. Our refineries have been
        adapted — and this is a permanent practice — to process more heavy oil and to improve the quality of
        our products, extracting high added value oil products. We introduced Diesel 500, with 75% less sulfur


10   PETR OBRA S    annual       report      2005
self-sufficiency
The conquest of self-sufficiency
                                                                                                                                                                                                                                                                     2003
                                                                                                                                                                                                                                                                     The largest natural gas
                                                                                                                                                                                                                                                                     reserve on the
                                                                                                                                                                                                                                                                     Brazilian continental
                                                                                                                                                                                                                                                                     shelf is discovered in
                                                                                                                                                                                                                                                                     the Santos Basin. New
                                                                                                                                                                                                                                                                     light oil provinces are
                                                                                                                                                                                                                          1996                                       found in Espírito Santo
                                                                                                                                                                     1987                                                                                            and Sergipe, with high
1953
1953                                                                                                                                                                                                                      The giant Roncador
                                                                                                                                                                                                                                                                     potential for
                                                                                                                                                                     Oil production at the giant Albacora field in        field in the Campos
October 3 | President Getúlio                                                                                                                                        the Campos Basin is initiated in 420 meters                                                     exploration and
                                                                                                                                                                                                                          Basin is discovered.
Vargas signs Law 2004 that                                         1966                                                                                              of water depth, a world record at the time.                                                     production.
establishes the monopoly of the
                                                                   Creation of the                                                                                   Another giant oil field is discovered at the
federal government over the
                                                                   Petrobras Research                                                                                Campos Basin: Marlim Sul.
activities of the oil industry in the
                                                                   Center (Cenpes).
country and authorizes the
creation of Petróleo Brasileiro S.
A. – Petrobras as the state
                                                                                                                                                                                                                                1997
company to be the executor of
                                                                                                                                                                                                                                 Oil industry activities in Brazil
the monopoly.
                                                                                                                                                                                                                                 are opened up to private
                                                                                                          1977                    1985                                                                                           initiative. Production exceeds
                                                                                                                                                                                                                                 the historic milestone of 1
                                                                                                          Campos Basin
                                                                                                                                  The giant Marlim


                                                                                                                                                                                                                                                                                          Oil production in Brazil | 1953 to 2005
                                                                                                                                                                                                                                 million barrels per day.
                                                                                                          production begins
                                                                                                                                  field is discovered
                                                                                                          through an early
                                                                                                          system installed at
                                                                                                                                  in the Campos                            1988
                                                                                                                                  Basin.
                                                                                                          the Enchova field.                                               The Rio Urucu field starts producing in Alto
                                                                                                                                                                           Amazonas, celebrating a long period of

                                        1961                                  1968                                                                                         prospecting activities in the Amazon region.


                                        Exploration of the                     First offshore discovery
                                        continental platform                   of oil: the Guaricema
                                        from Maranhão to                       field in Sergipe.
                                        Espírito Santo is
                                        initiated.


                                                                                                                                                        1986
                                                                                                                                                        The Technological Innovation and Advanced
                                                                        1963                                                                            Development in Deep and Ultra-Deep Water
                                                                                                                                                        Program (PROCAP) is created. Initially, the
      1954                                                               The discovery of
                                                                                                                                                        program studies solutions for exploration and
                                                                         the Carmópolis
       Petrobras begins its                                                                                                                             production in water up to 1,000 meters deep.
                                                                         (SE) field opens
       activities, taking over                                                                                                                          Subsequently, the studies are extended to
                                                                         up prospects for
       the collection of                                                                                                                                waters 2,000-3,000 meters in depth.
                                                                         production outside
       assets of the former                                              of Bahia.                           1974                                                                                                         1999
       National Petroleum
       Council (CNP).                                                                                         The discovery of
                                             1962                                                                                                                                      1994                               Petrobras breaks the
       Production is 2,700
       barrels of oil per day.
                                              The company
                                                                                                              the Garoupa field
                                                                                                              off the northern
                                                                                                              coast of Rio de
                                                                                                                                                                                        The first semi-submersible
                                                                                                                                                                                                                          work offshore
                                                                                                                                                                                                                          production record at             2005
                                              reaches the                                                                                                                               platform totally developed by     the Roncador field
                                                                                                              Janeiro marks the                                                                                                                            On December 19, Petrobras sets a
                                              production mark                                                                                                                           Petrobras technicians             in the Campos
                                                                                                              beginning of the                                                                                                                             production record of 1,857,425
                                              of 100,000 barrels                                                                                                                        (Petrobras-18) begins             Basin, producing at
                                                                                                              conquest of the                                                                                                                              barrels of oil per day. Work on the
                                              of oil per day.                                                                                                                           operations in the Marlim field    1,853 meters of
                                                                                                              Campos Basin,                                                                                                                                P-50 platform, which has the
                                                                                                                                                                                        of the Campos Basin).             water depth.
                                                                                                              which will become      1984                                                                                                                  capacity to produce 180,000
                                                                                                              the largest                                                                                                                                  barrels a day, is concluded.
                                                                                                              production region       The giant Albacora field is                                                                                          Installed in the Albacora Leste
                                                                                                              in the country.         discovered in the Campos Basin.                                                                                      field of the Campos Basin, it will
                                                                                                                                      Production reaches 500,000                                                                                           assure sustainable oil self-
                                                                                                                                      barrels per day.                                                                                                     sufficiency for the country when it
                                                                                                                                                                                                                                                           hits peak production in 2006.
Conduct of the Oil market
 Conduct of the Oil market


                           Oil prices continued rising in 2005, following a trend that began in 2004.                                                                   the International Energy Agency, the oil price peaks were of short duration — US$ 67.5/bbl for Brent and US$
Even with the
                           Brent and WTI oil were, respectively, 42% and 36% more expensive than the                                                                    69.8/bbl for WTI. On the oil product market, however, the reduction by 30% of refining activity in United States
slowdown in the            average of the previous year. This increase in prices, compared to the rises of                                                              led to an increase in real prices only comparable to that seen in the 1970s.
                           similar magnitude that occurred during the decade of the 1970s, has been                                                                          Even with the slowdown in the growth of world demand — 1.4% in 2005 against 3.8% in 2004 — it cannot
growth of world
                           presenting a singular characteristic because it is predominantly due to market                                                               be said that the increase in the price of oil is reducing the consumption of oil products and, as a result, crude oil
demand — 1.4% in           fundamentals rather than geopolitical events.                                                                                                sales. The control of the price of oil products in China and the subsequent stagnation of Chinese imports of such
                                                                                                                                                                        products contributed to reduced growth in demand, as did the impact of the hurricanes on the U.S. economy.
2005 against 3.8% in
                           Oil Prices (US$/bbl, nominal)                                                                                                                Nevertheless, prices remained high.
                           Source: Bloomberg
2004 — it cannot be                                                                                                                                                         The growth of oil production in non-OPEC countries declined drastically in 2005, remaining practically stable,
                            80


said that the increase      70
                                                                                                                                                                        according to the calculations of the International Energy Agency, compared to an increase of about 1 million bpd
                            60                                                                                                                                          in 2004. This decline is explained less by the fall in production in the mature regions such as the North Sea, than
in the price of oil is      50                                                                                                                                          by the temporary halt in the Gulf of Mexico and — more importantly — by the strong slowdown of production in

reducing the                40
                                                                                                                                                                        Russia that went from average annual increases of 10% in each of the past five years to 2.4% in 2005.
                            30

consumption of oil          20


                            10
products and, as a               1.1.00 1.5.00 1.9.00 1.1.01 1.5.01 1.9.01 1.1.02 1.5.02 1.9.02 1.1.03 1.5.03 1.9.03 1.1.04 1.5.04 1.9.04 1.1.05 1.5.05 1.9.05 1.1.06
                                                                                                                                                                        Private Oil Stocks in the U.S. (M bbl)
                                                                           OPEC Basket              WTI         Brent                                                   Source: US-DOE/EIA

result, crude oil sales.                                                      Cesta OPEP            WTI          Brent


                                                                                                                                                                            350.000
                                 Strong price swings during the year also demonstrated the nervousness of
                           the market in the face of any changes in the perception of the market funda-
                                                                                                                                                                            330.000

                           mentals, a symptom of the exhaustion of capacity in the oil chain. In particu-
                           lar, in 2005 attention was concentrated more on the stress in refining rather                                                                    310.000


                           than on production capacity.
                                                                                                                                                                            290.000

                                  In this sense, the effect of the passage of Hurricanes Katrina and Rita
                           through the Gulf of Mexico was a clear sign that the system lacks flexibility to                                                                 270.000
                                                                                                                                                                                                                                                                                                 2000-2004 band
                                                                                                                                                                                                                                                                                                   2004
                           deal with unexpected events. Because the interruption of production was
                                                                                                                                                                            250.000                                                                                                                2005
                           compensated for through the liberation of strategic inventories managed by                                                                                   1    4    7     10    13   16   19     22   25   28     31   34   37      40     43    46      49   52
                                                                                                                                                                                                                                                                                                   (after the hurricanes)
                                                                                                                                                                                                                                weeks
                                                                                                                                                                                                                                 (semanas)


                                                                                                                                                                                                 Faixa 2000-2004             2004             2005             (Depois dos furações)
Annual Report 2005
Annual Report 2005
Annual Report 2005
Annual Report 2005
Annual Report 2005
Annual Report 2005
Annual Report 2005
Annual Report 2005
Annual Report 2005
Annual Report 2005
Annual Report 2005
Annual Report 2005
Annual Report 2005
Annual Report 2005
Annual Report 2005
Annual Report 2005
Annual Report 2005
Annual Report 2005
Annual Report 2005
Annual Report 2005
Annual Report 2005
Annual Report 2005
Annual Report 2005
Annual Report 2005
Annual Report 2005
Annual Report 2005
Annual Report 2005
Annual Report 2005
Annual Report 2005
Annual Report 2005
Annual Report 2005
Annual Report 2005
Annual Report 2005
Annual Report 2005
Annual Report 2005
Annual Report 2005
Annual Report 2005
Annual Report 2005
Annual Report 2005
Annual Report 2005
Annual Report 2005
Annual Report 2005
Annual Report 2005
Annual Report 2005
Annual Report 2005
Annual Report 2005
Annual Report 2005
Annual Report 2005
Annual Report 2005
Annual Report 2005
Annual Report 2005
Annual Report 2005
Annual Report 2005
Annual Report 2005
Annual Report 2005

Más contenido relacionado

Destacado

"CLSA Investors' Forum 2006"
"CLSA Investors' Forum 2006" "CLSA Investors' Forum 2006"
"CLSA Investors' Forum 2006" Petrobras
 
Almir barbassa china india_nov2007
Almir barbassa china india_nov2007Almir barbassa china india_nov2007
Almir barbassa china india_nov2007Petrobras
 
Plano de Negócios 2010-2014
Plano de Negócios 2010-2014Plano de Negócios 2010-2014
Plano de Negócios 2010-2014Petrobras
 
"Estratégia da Petrobras Foco na Responsabilidade Social e Ambiental"
"Estratégia da Petrobras Foco na Responsabilidade Social e Ambiental""Estratégia da Petrobras Foco na Responsabilidade Social e Ambiental"
"Estratégia da Petrobras Foco na Responsabilidade Social e Ambiental"Petrobras
 
Rio oil and gas expo conference gerente executiva de e&p – engenharia de pr...
Rio oil and gas expo conference   gerente executiva de e&p – engenharia de pr...Rio oil and gas expo conference   gerente executiva de e&p – engenharia de pr...
Rio oil and gas expo conference gerente executiva de e&p – engenharia de pr...Petrobras
 
Webcast 4T09
Webcast 4T09Webcast 4T09
Webcast 4T09Petrobras
 
"Plano de Negócios 2007-2011" FIEB
"Plano de Negócios 2007-2011"  FIEB"Plano de Negócios 2007-2011"  FIEB
"Plano de Negócios 2007-2011" FIEBPetrobras
 
Plano de investimentos 2008 2012
Plano de investimentos 2008 2012Plano de investimentos 2008 2012
Plano de investimentos 2008 2012Petrobras
 
Diretor almir-ibef-final
Diretor almir-ibef-finalDiretor almir-ibef-final
Diretor almir-ibef-finalPetrobras
 
Webcast 4Q14
Webcast 4Q14Webcast 4Q14
Webcast 4Q14Petrobras
 
Latibex biofuels 21nov07
Latibex biofuels 21nov07Latibex biofuels 21nov07
Latibex biofuels 21nov07Petrobras
 
Financial times petrobras_190607
Financial times petrobras_190607Financial times petrobras_190607
Financial times petrobras_190607Petrobras
 
The 4th Brazil Investment Forum - Latin Finance
The 4th Brazil Investment Forum - Latin FinanceThe 4th Brazil Investment Forum - Latin Finance
The 4th Brazil Investment Forum - Latin FinancePetrobras
 
"Contrato Petrobras - YPFB” Espanhol
"Contrato Petrobras - YPFB”  Espanhol"Contrato Petrobras - YPFB”  Espanhol
"Contrato Petrobras - YPFB” EspanholPetrobras
 
Rio oil and gas expo conference diretor de abastecimento, paulo roberto costa
Rio oil and gas expo conference diretor de abastecimento, paulo roberto costaRio oil and gas expo conference diretor de abastecimento, paulo roberto costa
Rio oil and gas expo conference diretor de abastecimento, paulo roberto costaPetrobras
 
8º Foro Latibex - Strategic Plan and 3rd Quarter Results
8º Foro Latibex - Strategic Plan and 3rd Quarter Results8º Foro Latibex - Strategic Plan and 3rd Quarter Results
8º Foro Latibex - Strategic Plan and 3rd Quarter ResultsPetrobras
 
Webcast 2009-2013
Webcast 2009-2013Webcast 2009-2013
Webcast 2009-2013Petrobras
 
Relatório Anual 2005
Relatório Anual 2005Relatório Anual 2005
Relatório Anual 2005Petrobras
 
"O reflexo da auto-suficiência da Petrobras”
"O reflexo da auto-suficiência da Petrobras”"O reflexo da auto-suficiência da Petrobras”
"O reflexo da auto-suficiência da Petrobras”Petrobras
 
Road show october 2007
Road show october 2007Road show october 2007
Road show october 2007Petrobras
 

Destacado (20)

"CLSA Investors' Forum 2006"
"CLSA Investors' Forum 2006" "CLSA Investors' Forum 2006"
"CLSA Investors' Forum 2006"
 
Almir barbassa china india_nov2007
Almir barbassa china india_nov2007Almir barbassa china india_nov2007
Almir barbassa china india_nov2007
 
Plano de Negócios 2010-2014
Plano de Negócios 2010-2014Plano de Negócios 2010-2014
Plano de Negócios 2010-2014
 
"Estratégia da Petrobras Foco na Responsabilidade Social e Ambiental"
"Estratégia da Petrobras Foco na Responsabilidade Social e Ambiental""Estratégia da Petrobras Foco na Responsabilidade Social e Ambiental"
"Estratégia da Petrobras Foco na Responsabilidade Social e Ambiental"
 
Rio oil and gas expo conference gerente executiva de e&p – engenharia de pr...
Rio oil and gas expo conference   gerente executiva de e&p – engenharia de pr...Rio oil and gas expo conference   gerente executiva de e&p – engenharia de pr...
Rio oil and gas expo conference gerente executiva de e&p – engenharia de pr...
 
Webcast 4T09
Webcast 4T09Webcast 4T09
Webcast 4T09
 
"Plano de Negócios 2007-2011" FIEB
"Plano de Negócios 2007-2011"  FIEB"Plano de Negócios 2007-2011"  FIEB
"Plano de Negócios 2007-2011" FIEB
 
Plano de investimentos 2008 2012
Plano de investimentos 2008 2012Plano de investimentos 2008 2012
Plano de investimentos 2008 2012
 
Diretor almir-ibef-final
Diretor almir-ibef-finalDiretor almir-ibef-final
Diretor almir-ibef-final
 
Webcast 4Q14
Webcast 4Q14Webcast 4Q14
Webcast 4Q14
 
Latibex biofuels 21nov07
Latibex biofuels 21nov07Latibex biofuels 21nov07
Latibex biofuels 21nov07
 
Financial times petrobras_190607
Financial times petrobras_190607Financial times petrobras_190607
Financial times petrobras_190607
 
The 4th Brazil Investment Forum - Latin Finance
The 4th Brazil Investment Forum - Latin FinanceThe 4th Brazil Investment Forum - Latin Finance
The 4th Brazil Investment Forum - Latin Finance
 
"Contrato Petrobras - YPFB” Espanhol
"Contrato Petrobras - YPFB”  Espanhol"Contrato Petrobras - YPFB”  Espanhol
"Contrato Petrobras - YPFB” Espanhol
 
Rio oil and gas expo conference diretor de abastecimento, paulo roberto costa
Rio oil and gas expo conference diretor de abastecimento, paulo roberto costaRio oil and gas expo conference diretor de abastecimento, paulo roberto costa
Rio oil and gas expo conference diretor de abastecimento, paulo roberto costa
 
8º Foro Latibex - Strategic Plan and 3rd Quarter Results
8º Foro Latibex - Strategic Plan and 3rd Quarter Results8º Foro Latibex - Strategic Plan and 3rd Quarter Results
8º Foro Latibex - Strategic Plan and 3rd Quarter Results
 
Webcast 2009-2013
Webcast 2009-2013Webcast 2009-2013
Webcast 2009-2013
 
Relatório Anual 2005
Relatório Anual 2005Relatório Anual 2005
Relatório Anual 2005
 
"O reflexo da auto-suficiência da Petrobras”
"O reflexo da auto-suficiência da Petrobras”"O reflexo da auto-suficiência da Petrobras”
"O reflexo da auto-suficiência da Petrobras”
 
Road show october 2007
Road show october 2007Road show october 2007
Road show october 2007
 

Similar a Annual Report 2005

Fact Sheet 1Q07
Fact Sheet 1Q07Fact Sheet 1Q07
Fact Sheet 1Q07CPFL RI
 
Goals and focus areas of the Programmes
Goals and focus areas of the ProgrammesGoals and focus areas of the Programmes
Goals and focus areas of the ProgrammesSamiksha Sanghi
 
Marketing Plan Radio Mirchi
Marketing Plan Radio MirchiMarketing Plan Radio Mirchi
Marketing Plan Radio MirchiShruti Bhatia
 
Suncor Energy Investor Relations Presentation
Suncor Energy  Investor Relations PresentationSuncor Energy  Investor Relations Presentation
Suncor Energy Investor Relations Presentationearningsreport
 
Case Study - New Lead Qualification
Case Study - New Lead QualificationCase Study - New Lead Qualification
Case Study - New Lead Qualificationdtrombino
 
The Sustainable Buildings Series: Retrofits
The Sustainable Buildings Series: RetrofitsThe Sustainable Buildings Series: Retrofits
The Sustainable Buildings Series: RetrofitsGSMIweb
 
Business Plan for Job Insurance
Business Plan for Job InsuranceBusiness Plan for Job Insurance
Business Plan for Job InsuranceArchana Kadam
 
Job Insurance Need Of The Hour!
Job Insurance   Need Of The Hour!Job Insurance   Need Of The Hour!
Job Insurance Need Of The Hour!Ajay Panandikar
 
Case Study Renault Clio mobilike 2012
Case Study Renault Clio mobilike 2012Case Study Renault Clio mobilike 2012
Case Study Renault Clio mobilike 2012mobilike
 
Willis re d. g. akkor general liability in turkish market (1)
Willis re d. g. akkor general liability in turkish market (1)Willis re d. g. akkor general liability in turkish market (1)
Willis re d. g. akkor general liability in turkish market (1)Deniz Güney Akkor
 
ICT In Normandy Overview
ICT In Normandy OverviewICT In Normandy Overview
ICT In Normandy OverviewNormandyDev
 
Pharmaceutical CoCrystals agenda
Pharmaceutical CoCrystals agendaPharmaceutical CoCrystals agenda
Pharmaceutical CoCrystals agendaVeronica Araujo
 

Similar a Annual Report 2005 (16)

Global Feed Markets: May - June 2011
Global Feed Markets: May - June 2011Global Feed Markets: May - June 2011
Global Feed Markets: May - June 2011
 
Fact Sheet 1Q07
Fact Sheet 1Q07Fact Sheet 1Q07
Fact Sheet 1Q07
 
Goals and focus areas of the Programmes
Goals and focus areas of the ProgrammesGoals and focus areas of the Programmes
Goals and focus areas of the Programmes
 
Marketing Plan Radio Mirchi
Marketing Plan Radio MirchiMarketing Plan Radio Mirchi
Marketing Plan Radio Mirchi
 
Suncor Energy Investor Relations Presentation
Suncor Energy  Investor Relations PresentationSuncor Energy  Investor Relations Presentation
Suncor Energy Investor Relations Presentation
 
Itac 2009 2010 biennial report
Itac 2009 2010 biennial reportItac 2009 2010 biennial report
Itac 2009 2010 biennial report
 
Case Study - New Lead Qualification
Case Study - New Lead QualificationCase Study - New Lead Qualification
Case Study - New Lead Qualification
 
Print Booklet
Print BookletPrint Booklet
Print Booklet
 
The Sustainable Buildings Series: Retrofits
The Sustainable Buildings Series: RetrofitsThe Sustainable Buildings Series: Retrofits
The Sustainable Buildings Series: Retrofits
 
Business Plan for Job Insurance
Business Plan for Job InsuranceBusiness Plan for Job Insurance
Business Plan for Job Insurance
 
Job Insurance Need Of The Hour!
Job Insurance   Need Of The Hour!Job Insurance   Need Of The Hour!
Job Insurance Need Of The Hour!
 
Case Study Renault Clio mobilike 2012
Case Study Renault Clio mobilike 2012Case Study Renault Clio mobilike 2012
Case Study Renault Clio mobilike 2012
 
Willis re d. g. akkor general liability in turkish market (1)
Willis re d. g. akkor general liability in turkish market (1)Willis re d. g. akkor general liability in turkish market (1)
Willis re d. g. akkor general liability in turkish market (1)
 
ICT In Normandy Overview
ICT In Normandy OverviewICT In Normandy Overview
ICT In Normandy Overview
 
Pharmaceutical CoCrystals agenda
Pharmaceutical CoCrystals agendaPharmaceutical CoCrystals agenda
Pharmaceutical CoCrystals agenda
 
About IPsoft
About IPsoftAbout IPsoft
About IPsoft
 

Más de Petrobras

Strategic Plan 2040 || Business and Management Plan 2019-2023
Strategic Plan 2040 || Business and Management Plan 2019-2023Strategic Plan 2040 || Business and Management Plan 2019-2023
Strategic Plan 2040 || Business and Management Plan 2019-2023Petrobras
 
Plano Estratégico 2040 || Plano de Negócios e Gestão 2019-2023
Plano Estratégico 2040 || Plano de Negócios e Gestão 2019-2023Plano Estratégico 2040 || Plano de Negócios e Gestão 2019-2023
Plano Estratégico 2040 || Plano de Negócios e Gestão 2019-2023Petrobras
 
Petrobras Overview - September 2018
Petrobras Overview - September 2018Petrobras Overview - September 2018
Petrobras Overview - September 2018Petrobras
 
Apresentação Investor Day, São Paulo, 2018
Apresentação Investor Day, São Paulo, 2018Apresentação Investor Day, São Paulo, 2018
Apresentação Investor Day, São Paulo, 2018Petrobras
 
Petrobras Investor Day - London 2018
Petrobras Investor Day - London 2018Petrobras Investor Day - London 2018
Petrobras Investor Day - London 2018Petrobras
 
Sustentabilidade 2017
Sustentabilidade 2017Sustentabilidade 2017
Sustentabilidade 2017Petrobras
 
Apresentacao png-2018-2022-webcast-ingles
Apresentacao png-2018-2022-webcast-inglesApresentacao png-2018-2022-webcast-ingles
Apresentacao png-2018-2022-webcast-inglesPetrobras
 
Apresentação PNG 2018-2022
Apresentação PNG 2018-2022Apresentação PNG 2018-2022
Apresentação PNG 2018-2022Petrobras
 
Apresentação de Pedro Parente no Investor Day Nova York
Apresentação de Pedro Parente no Investor Day Nova YorkApresentação de Pedro Parente no Investor Day Nova York
Apresentação de Pedro Parente no Investor Day Nova YorkPetrobras
 
Apresentação de Pedro Parente no Investor Day Londres
Apresentação de Pedro Parente no Investor Day LondresApresentação de Pedro Parente no Investor Day Londres
Apresentação de Pedro Parente no Investor Day LondresPetrobras
 
Apresentação de Pedro Parente no Investor Day São Paulo
Apresentação de Pedro Parente no Investor Day São PauloApresentação de Pedro Parente no Investor Day São Paulo
Apresentação de Pedro Parente no Investor Day São PauloPetrobras
 
Visão Geral 2017 fevereiro
Visão Geral   2017 fevereiro Visão Geral   2017 fevereiro
Visão Geral 2017 fevereiro Petrobras
 
Petrobras General Overview
Petrobras General OverviewPetrobras General Overview
Petrobras General OverviewPetrobras
 
Petrobras at a Glance
Petrobras at a GlancePetrobras at a Glance
Petrobras at a GlancePetrobras
 
Visão Geral Petrobras
Visão Geral PetrobrasVisão Geral Petrobras
Visão Geral PetrobrasPetrobras
 
Strategic Plan and 2017-2021 Business & Management Plan
Strategic Plan and 2017-2021 Business & Management PlanStrategic Plan and 2017-2021 Business & Management Plan
Strategic Plan and 2017-2021 Business & Management PlanPetrobras
 
Plano Estratégico e Plano de Negócios e Gestão 2017-2021
Plano Estratégico e Plano de Negócios e Gestão 2017-2021Plano Estratégico e Plano de Negócios e Gestão 2017-2021
Plano Estratégico e Plano de Negócios e Gestão 2017-2021Petrobras
 
Plano de Negócios e Gestão 2015 – 2019
Plano de Negócios e Gestão 2015 – 2019 Plano de Negócios e Gestão 2015 – 2019
Plano de Negócios e Gestão 2015 – 2019 Petrobras
 
Webcast 1T16
Webcast 1T16Webcast 1T16
Webcast 1T16Petrobras
 
Webcast 1Q16
Webcast 1Q16Webcast 1Q16
Webcast 1Q16Petrobras
 

Más de Petrobras (20)

Strategic Plan 2040 || Business and Management Plan 2019-2023
Strategic Plan 2040 || Business and Management Plan 2019-2023Strategic Plan 2040 || Business and Management Plan 2019-2023
Strategic Plan 2040 || Business and Management Plan 2019-2023
 
Plano Estratégico 2040 || Plano de Negócios e Gestão 2019-2023
Plano Estratégico 2040 || Plano de Negócios e Gestão 2019-2023Plano Estratégico 2040 || Plano de Negócios e Gestão 2019-2023
Plano Estratégico 2040 || Plano de Negócios e Gestão 2019-2023
 
Petrobras Overview - September 2018
Petrobras Overview - September 2018Petrobras Overview - September 2018
Petrobras Overview - September 2018
 
Apresentação Investor Day, São Paulo, 2018
Apresentação Investor Day, São Paulo, 2018Apresentação Investor Day, São Paulo, 2018
Apresentação Investor Day, São Paulo, 2018
 
Petrobras Investor Day - London 2018
Petrobras Investor Day - London 2018Petrobras Investor Day - London 2018
Petrobras Investor Day - London 2018
 
Sustentabilidade 2017
Sustentabilidade 2017Sustentabilidade 2017
Sustentabilidade 2017
 
Apresentacao png-2018-2022-webcast-ingles
Apresentacao png-2018-2022-webcast-inglesApresentacao png-2018-2022-webcast-ingles
Apresentacao png-2018-2022-webcast-ingles
 
Apresentação PNG 2018-2022
Apresentação PNG 2018-2022Apresentação PNG 2018-2022
Apresentação PNG 2018-2022
 
Apresentação de Pedro Parente no Investor Day Nova York
Apresentação de Pedro Parente no Investor Day Nova YorkApresentação de Pedro Parente no Investor Day Nova York
Apresentação de Pedro Parente no Investor Day Nova York
 
Apresentação de Pedro Parente no Investor Day Londres
Apresentação de Pedro Parente no Investor Day LondresApresentação de Pedro Parente no Investor Day Londres
Apresentação de Pedro Parente no Investor Day Londres
 
Apresentação de Pedro Parente no Investor Day São Paulo
Apresentação de Pedro Parente no Investor Day São PauloApresentação de Pedro Parente no Investor Day São Paulo
Apresentação de Pedro Parente no Investor Day São Paulo
 
Visão Geral 2017 fevereiro
Visão Geral   2017 fevereiro Visão Geral   2017 fevereiro
Visão Geral 2017 fevereiro
 
Petrobras General Overview
Petrobras General OverviewPetrobras General Overview
Petrobras General Overview
 
Petrobras at a Glance
Petrobras at a GlancePetrobras at a Glance
Petrobras at a Glance
 
Visão Geral Petrobras
Visão Geral PetrobrasVisão Geral Petrobras
Visão Geral Petrobras
 
Strategic Plan and 2017-2021 Business & Management Plan
Strategic Plan and 2017-2021 Business & Management PlanStrategic Plan and 2017-2021 Business & Management Plan
Strategic Plan and 2017-2021 Business & Management Plan
 
Plano Estratégico e Plano de Negócios e Gestão 2017-2021
Plano Estratégico e Plano de Negócios e Gestão 2017-2021Plano Estratégico e Plano de Negócios e Gestão 2017-2021
Plano Estratégico e Plano de Negócios e Gestão 2017-2021
 
Plano de Negócios e Gestão 2015 – 2019
Plano de Negócios e Gestão 2015 – 2019 Plano de Negócios e Gestão 2015 – 2019
Plano de Negócios e Gestão 2015 – 2019
 
Webcast 1T16
Webcast 1T16Webcast 1T16
Webcast 1T16
 
Webcast 1Q16
Webcast 1Q16Webcast 1Q16
Webcast 1Q16
 

Último

the 25 most beautiful words for a loving and lasting relationship.pdf
the 25 most beautiful words for a loving and lasting relationship.pdfthe 25 most beautiful words for a loving and lasting relationship.pdf
the 25 most beautiful words for a loving and lasting relationship.pdfFrancenel Paul
 
Collective Mining | Corporate Presentation - April 2024
Collective Mining | Corporate Presentation - April 2024Collective Mining | Corporate Presentation - April 2024
Collective Mining | Corporate Presentation - April 2024CollectiveMining1
 
Corporate Presentation Probe April 2024.pdf
Corporate Presentation Probe April 2024.pdfCorporate Presentation Probe April 2024.pdf
Corporate Presentation Probe April 2024.pdfProbe Gold
 
WheelTug PLC Pitch Deck | Investor Insights | April 2024
WheelTug PLC Pitch Deck | Investor Insights | April 2024WheelTug PLC Pitch Deck | Investor Insights | April 2024
WheelTug PLC Pitch Deck | Investor Insights | April 2024Hector Del Castillo, CPM, CPMM
 
Corporate Presentation Probe April 2024.pdf
Corporate Presentation Probe April 2024.pdfCorporate Presentation Probe April 2024.pdf
Corporate Presentation Probe April 2024.pdfProbe Gold
 
Q1 Probe Gold Quarterly Update- April 2024
Q1 Probe Gold Quarterly Update- April 2024Q1 Probe Gold Quarterly Update- April 2024
Q1 Probe Gold Quarterly Update- April 2024Probe Gold
 
Leveraging USDA Rural Development Grants for Community Growth and Sustainabil...
Leveraging USDA Rural Development Grants for Community Growth and Sustainabil...Leveraging USDA Rural Development Grants for Community Growth and Sustainabil...
Leveraging USDA Rural Development Grants for Community Growth and Sustainabil...USDAReapgrants.com
 
Q1 Quarterly Update - April 16, 2024.pdf
Q1 Quarterly Update - April 16, 2024.pdfQ1 Quarterly Update - April 16, 2024.pdf
Q1 Quarterly Update - April 16, 2024.pdfProbe Gold
 
Collective Mining | Corporate Presentation - April 2024
Collective Mining | Corporate Presentation - April 2024Collective Mining | Corporate Presentation - April 2024
Collective Mining | Corporate Presentation - April 2024CollectiveMining1
 
slideshare_2404_presentation materials_en.pdf
slideshare_2404_presentation materials_en.pdfslideshare_2404_presentation materials_en.pdf
slideshare_2404_presentation materials_en.pdfsansanir
 

Último (10)

the 25 most beautiful words for a loving and lasting relationship.pdf
the 25 most beautiful words for a loving and lasting relationship.pdfthe 25 most beautiful words for a loving and lasting relationship.pdf
the 25 most beautiful words for a loving and lasting relationship.pdf
 
Collective Mining | Corporate Presentation - April 2024
Collective Mining | Corporate Presentation - April 2024Collective Mining | Corporate Presentation - April 2024
Collective Mining | Corporate Presentation - April 2024
 
Corporate Presentation Probe April 2024.pdf
Corporate Presentation Probe April 2024.pdfCorporate Presentation Probe April 2024.pdf
Corporate Presentation Probe April 2024.pdf
 
WheelTug PLC Pitch Deck | Investor Insights | April 2024
WheelTug PLC Pitch Deck | Investor Insights | April 2024WheelTug PLC Pitch Deck | Investor Insights | April 2024
WheelTug PLC Pitch Deck | Investor Insights | April 2024
 
Corporate Presentation Probe April 2024.pdf
Corporate Presentation Probe April 2024.pdfCorporate Presentation Probe April 2024.pdf
Corporate Presentation Probe April 2024.pdf
 
Q1 Probe Gold Quarterly Update- April 2024
Q1 Probe Gold Quarterly Update- April 2024Q1 Probe Gold Quarterly Update- April 2024
Q1 Probe Gold Quarterly Update- April 2024
 
Leveraging USDA Rural Development Grants for Community Growth and Sustainabil...
Leveraging USDA Rural Development Grants for Community Growth and Sustainabil...Leveraging USDA Rural Development Grants for Community Growth and Sustainabil...
Leveraging USDA Rural Development Grants for Community Growth and Sustainabil...
 
Q1 Quarterly Update - April 16, 2024.pdf
Q1 Quarterly Update - April 16, 2024.pdfQ1 Quarterly Update - April 16, 2024.pdf
Q1 Quarterly Update - April 16, 2024.pdf
 
Collective Mining | Corporate Presentation - April 2024
Collective Mining | Corporate Presentation - April 2024Collective Mining | Corporate Presentation - April 2024
Collective Mining | Corporate Presentation - April 2024
 
slideshare_2404_presentation materials_en.pdf
slideshare_2404_presentation materials_en.pdfslideshare_2404_presentation materials_en.pdf
slideshare_2404_presentation materials_en.pdf
 

Annual Report 2005

  • 1. contents contents Profile, mission, vision 2015 and values Highlights Message from the president The conquest of self-sufficiency Conduct of the oil market Corporate strategy our businesses in brazil 22 Exploration and Production 29 Refining and Commercialization 32 Petrochemicals 35 Transportation 37 Distribution 40 Natural Gas 44 Energy I N T E R N AT I O N A L A C T I V I T I E S 54 South America 60 North America 61 Africa 62 Asia S O C I A L A N D E N V I R O N M E N TA L R E S P O N S I B I L I T Y 66 Social Investiments 71 Human Resources 75 Health, Safety, and Environment I N TA N G I B L E A S S E TS 84 Technological Know-how Capital 87 Organizational Capital 88 Relationship Capital 91 Human Capital BUSINESS MANAGEMENT 94 Business Performance 97 Capital Markets 103 Risk Management 106 Corporate Governance 112 Corporate Information 116 Glossary, Abbreviations and Addresses
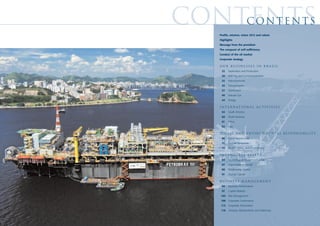
  • 2. petrobras in brazil and overseas profile p r of i l e mission To operate safely and profitably in the oil, gas and energy domestic Petrobras is a publicly listed company that and international markets in a socially ENGLAND operates on an integrated and specialized basis and environmentally responsible in the following segments of the oil, gas and manner, supplying products and T H E U N I T E D STAT ES L I BYA JA PA N services to meet the needs of its IRAN CHINA energy industry: exploration and production; customers and contributing to the M E X I CO refining, commercialization, transportation and development of Brazil and the VENEZUELA CO LO M B I A NIGERIA petrochemicals; distribution of oil products; countries in which it operates. EC UA D O R EQ UATO R I A L G U I N E A SINGAPURE PERU BOLIVIA TA N Z A N I A natural gas and energy. Founded in 1953, the A N GO L A PA R AG UAY Company today is the world’s 14th largest oil CHILE U R U G UAY company according to Petroleum Intelligence va l u e s ARGENTINA Weekly. Leader in the Brazilian hydrocarbons Focus on the Company’s main sector, Petrobras has been expanding its stakeholders: shareholders, operations to become an integrated energy customers, employees, society, government, partners, suppliers company with international operations and a and the communities in which leader in Latin America. it operates; vision5 BELÉM A spirit of entrepreneurship and REMAN SÃO LUÍS FORTALEZA an ability to meet challenges; Coari MANAUS LUBNOR Mucuripe Guamaré Dunas NATAL 2 0 1 vision 2015 Focus on obtaining excellent results; JOÃO PESSOA Campina Grande Cabedelo RECIFE Innovative and competitive spirit Suape MACEIÓ P E T R O B R A S W I L L B E A N I N T E G R AT E D Candeias with a focus on providing services ARACAJU RLAM E N E R G Y C O M PA N Y W I T H A S T R O N G DTBAS SALVADOR with a competitive edge and BRASÍLIA Sen. Canedo Jequié COCHABAMBA SANTA CRUZ DE LA SIERRA Itabuna I N T E R N AT I O N A L P R E S E N C E A N D T H E technological competence; GOIÂNIA ESPÍRITO SANTO Gualberto Villarroel Guillermo Elder Bell REGAP Norte-Capixaba L E A D E R I N L AT I N A M E R I C A , O P E R AT I N G Excellence and leadership in Regência UBERABA VITÓRIA questions of health, safety and the REVAP W I T H I T S F O C U S O N P R O F I TA B I L I T Y REPLAN Macaé PARAGUAI REDUC preservation of the environment; RECAP RIO DE JANEIRO REPAR RPBC São Sebastião A N D S O C I A L A N D E N V I R O N M E N TA L REFINOR Paranaguá SÃO PAULO São Francisco do Sul (DTSUL) A permanent quest for business SIX CURITIBA R E S P O N S I B I L I T Y. REFAP FLORIANÓPOLIS leadership. Tramandaí Pipelines ARGENTINA Copesul PORTO ALEGRE Fertilizer Plant REFISAN URUGUAI Terminal de Refinery Rio Grande Terminal Petrobras overseas Bahía Blanca RICARDO ELIÇABE
  • 3. HIGHLIGHTS HIGHLIGHTS HIGHLIGHTS ORIGIN OF NATURAL GAS (million m3/day) (4) 42 45 Domestic gas 23 23 Bolivian gas 19 22 Operational summary | 2005 NATURAL GAS MARKET DISTRIBUTION (million m3/day) (4) 42 45 Distributors 28 31 2004 2005 Thermoelectric power plants 7 7 (1)(2) PROVED RESERVES – SPE criteria (billions of barrels of oil equivalent - boe) 14.9 14.9 Domestic consumption 7 7 Oil and condensate (billions of barrels) 12.1 12.3 (1) Natural gas (billions of boe) 2.8 2.6 ENERGY Number of thermoelectric power plants(5) 7 9 (1) AVERAGE DAILY PRODUCTION (th. boed) 2,020 2,217 Installed capacity (MW)(5) 2,194 3,203 • Oil and NGL (th. bpd) 1,661 1,847 Energy sales (GWh) 11.32 16.64 Onshore 407 396 Number of hydroelectric power plants 2 2 Offshore 1,254 1,451 Installed capacity (MW)(5) 285 285 • Natural gas (th. boed) 359 370 Transmission lines (km) 15,414 15,414 Onshore 217 213 Energy distribution (TWh/year) 13 13 Offshore 142 157 (1) FERTILIZERS (1) PRODUCING WELLS (oil and natural gas) – 12/31/2005 13,821 14,061 Number of plants 3 3 Onshore 13,156 12,803 Some 2004 data were revised due to changes in the criteria. Offshore 665 1,258 (1) Includes overseas data, corresponding to Petrobras’ stake in each partnership (2) Proved reserves are calculated according to SPE (Society of Petroleum Engineers) criteria DRILLING RIGS – 12/31/2005 50 64 (3) Includes Transpetro’ port terminals only Onshore 19 22 (4) Excludes flare off, own E&P consumption, liquefaction and reinjection Offshore 31 42 (5) Includes only assets with an equity stake equal or larger than 50% OPERATING PRODUCTION PLATFORMS – 12/31/2005 95 97 Fixed 72 73 Financial summary | 2005 Floating 23 24 PIPELINES (km) – 12/31/2005 (1) 30,039 30,343 INVESTMENTS R$ million Oil and oil products 12,553 12,857 2004 2005 Natural gas 17,486 17,486 Own Investments 21,151 22,927 Exploration & Production 12,441 13,934 TANKER FLEET – 12/31/2005 Supply 3,907 3,286 Vessels - company owned 50 50 Gas & Energy 625 1,527 - chartered 74 75 International 2,331 3,153 Tons (millions of deadweight tons - dwt) 8 8 Distribution 1,223 495 TERMINALS – 12/31/2005 Corporate Areas 624 532 Number 65 66 Special Purpose Companies (SPCs) 775 2,385 Storage capacity (million m3) (3) 9.9 10.4 Ventures under Negotiation 454 311 Project Finance 169 87 (1) REFINERIES – 12/31/2005 Total Investments 22,549 25,710 Number 16 16 Nominal installed capacity (th. bpd) 2,114 2,114 C O N S O L I DAT E D FINANCIAL I N F O R M AT I O N R$ million Average throughput processed (th. bpd) 1,847 1,861 2004 2005 % Brazil 1,728 1,758 Gross Operating Revenue 150,440 179,065 19% Overseas 119 103 Net Operating Revenue 111,128 136,605 23% Average daily production of oil products (th. bpd) 1,797 1,839 Operating Profit 29,930 39,773 33% IMPORTS (th. bpd) Financial Result (3,321) (2,843) -14% Oil 450 352 Net Income 16,887 23,725 40% Oil products 109 94 Net Income per Share (R$/share) 3.85 5.41 41% EBITDA 36,798 47,808 30% EXPORTS (th. bpd) Total Debt 55,803 48,242 -14% Oil 181 263 Net Debt 35,816 24,825 -31% Oil products 228 241 Market Value 112,458 173,584 54% COMMERCIALIZATION OF OIL PRODUCTS (th. bpd) Gross Margin 41% 44% 3% Brazil 1,637 1,655 Operating Margin 27% 29% 2% Net Margin 15% 17% 2% INTERNATIONAL SALES (th. bpd) Financial and Economic Indicators Oil, Gas and Oil Products 416 385 Brent (US$/bbl) 38.21 54.38 42% US Dollar Average Price - Sale (R$) 2.9262 2.4350 -17% US Dollar final Price - Sale (R$) 2.6544 2.3407 -12% 4 PETR OBRA S annual report 2005 PETR OBRA S annual report 2005 5
  • 4. HIGHLIGHTS HIGHLIGHTS Voting Capital – Common Shares 2005 2004 2.8% 1.9% 2.8% 1.9% Production of Oil, NGL, 4.6% 4.9% Gross Margin, Operating and Net (1) 7.5% 7.9% Condensate and Natural Gas Oil and Oil Products Spill (m3) BR GAAP Criteria (th. boed) 45% 44% 41% 39% 55.7% 55.7% 2001 1,381 258 1,639 2001 2,619 36% 27.5% 26.7% 2002 1,535 275 1,810 29% 29% 2002 197 27% 24% Federal Government 2003 1,701 335 2,036 20% 2003 276 19% 17% 17% BNDESPar 15% 2004 1,661 359 2,020 12% ADR Level 3 2004 530 FMP – FGTS Petrobras 2005 1,847 370 2,217 269 Foreign Investors (Resolution no. 2.689 C.M.N.) 2005 2001 2002 2003 2004 2005 Other individuals and legal entities Oil, NGL and Condensate 3 Spills of more than 1 barrel (0.159 m ) impacting Gross Margin Natural Gas the environment outside the installation perimeter. Operating Margin Net Margin Voting Capital - Preferred Shares 2005 2004 Debt – BR GAAP Criteria Proved Reserves of Oil, NGL, Condensate (R$ billion)(1)(3) 15.7% 15.2% and Natural Gas SPE Criteria Net Income 3.3 (billions boed) 37.1% 37.2% BR GAAP criteria 1.3 49.6 15.5% 15.8% 46.2 2001 8.5 2.1 10.6 (R$ million)(1) 44.2 40 2002 9.9 35.8 37.1 2.3 12.2 2001 9,867 31.7% 31.8% 34.7 2003 11.6 2.9 14.5 2002 8,098 24.8 BNDESPar 2004 12.1 2.8 14.9 2003 17,795 18.2 ADR Level 3 and Rule 144-A 9.7 Foreign Investors (Resolution no. 2.689 C.M.N.) 2005 12.3 2.6 14.9 16,887 2004 8.5 8.1 10.9 9.6 11.1 Other individuals and legal entities 2001 2002 2003 2004 2005 Oil, NGL and Condensate 2005 23,725 Short-Term Natural Gas Long-Term Capital Stock Funds obtained but still not used in projects 2005 2004 Net Debt Earnings/Share 2.7% 2.8% Lost Time Injury BR GAAP Criteria 7.6% 32.2% 7.8% 32.2% Market Capitalization x Net Equity Frequency Rate (LTIFR) (R$/share)(1)(2) 8.2% 8.1% (R$ billion)(1) 174 2001 2.89 2001 2.27 15.7% 15.4% 2002 1.53 2002 1.86 112 15.9% 15.7% 17.7% 18.0% 87 2003 1.23 2003 4.06 78 56 54 Federal Government 3.85 62 2004 1.04 2004 49 BNDESPar 34 29 ADR (ON Shares) 2005 0.97 2005 5.41 2001 2002 2003 2004 2005 ADR (PN Shares) 2001 2002 2003 2004 2005 Market Capitalization Net Equity FMP – FGTS Petrobras Valor de Mercado Valor Patrimonial Foreign Investors (Resolution no. 2.689 C.M.N.) Number of lost time injuries per million (1) The 2004 and 2005 fiscal years include the Specific Purpose Companies whose activities are controlled, directly or indirectly, by Petrobras Other individuals and legal entities men-hours of exposure to risk. (2) For the effects of comparison, Net Earnings per share were recalculated for the previous periods as a result of the share split approved by the Note: LTIFR covers employees and AGM of July 22, 2005. outsourced workers (3) The 2001, 2002 and 2003 fiscal years include debt contracted by the SPEs with which Petrobras structured "Project Finance" and consortia. The Commom shares - 2,536,673,672 2002, 2003, 2004 and 2005 fiscal years include leasing contracts. Preffered shares - 1,849,478,028 Total shares - 4,386,151,700 PETR OBRA S annual report 2005 7
  • 5. MESSAGE FROM THE PRESIDENT MESSAGE FROM THE PRESIDENT MESSAGE FROM THE PRESIDENT MESSAGE FROM THE PRESIDENT MESSAGE FROM THE PRESIDENT It is with special pride that I present the Company’s results for 2005, a year in which we set records for production, profitability and investments. The Company ended the year with an annual daily production of oil and gas of 2,217 million barrels of oil equivalent (boe), consolidated earnings of R$ 23,725 billion and total investments of R$ 25,710 billion, all historical records. In order to obtain these results, we implemented a vigorous plan of action based principally on the continuation of a bold investment cycle that allows us to achieve sustainable returns over the medium and long-term. This effort, initiated during the administration of President José Eduardo Dutra with whom I shared the command of the company during 2005, made it possible to restructure our activities and improve our strategic vision of the future. “ I N A S I T U AT I O N I N W H I C H A In practical terms, I should mention that we passed the benchmark of 1.8 million barrels of oil per day SCARCITY OF ENERGY (bpd) produced in Brazil, mainly due to the startup of the P-43 and P-48 platforms. We consider this a R E S O U R C E S , M A I N LY O I L , H A S BECOME MORE AND MORE milestone in the ability of Petrobras’ technical and managerial staff to overcome challenges. In 2003, these E V I D E N T, A C H I E V I N G S E L F - units were well behind in executing their projects and ran serious risks in contractual and SUFFICIENCY REPRESENTS AN operational feasibility. Nevertheless, we were able to reverse the situation and today I M P O R TA N T S T E P TO WA R D S the two rigs are operating at full production. REDUCING THE RISK AND As a result, we were able to boost annual oil production in Brazil by 13%. This growth VULNERABILITY OF BRAZIL´S TRADE BALANCE. AND placed Petrobras in the ranks of companies with the highest rise in production in the P ET R O B R AS I S P R O U D TO B E world oil industry in 2005. Even with our expanded production, we were able to M A K I N G A N I M P O R TA N T guarantee a 131% replacement rate of our oil reserves. That is, for each barrel we CO N T R I B U T I O N TOWA R D S produced, we replaced 1.31 barrels in our reserves, meaning that we continue to maintain R E A C H I N G T H I S G O A L .” long-term sustainable growth. In step with the restructuring of our exploration portfolio and the preservation of sustainable growth, during the 7th Bidding Round run by the National Petroleum, Natural Gas and Biofuel Agency (ANP), Petrobras acquired 96 new exploratory blocks, of which 42 were exclusive and 54 were in partnership, totaling the greatest number of exploratory areas in its portfolio since the Agency began running the auctions. We are now quite close to self-sufficiency in providing oil and oil products to our main market
  • 6. MESSAGE FROM THE PRESIDENT — Brazil. This target, which is symbolic for Brazilian society, will materialize in a sustainable manner in 2006, in its composition, and it already is fueling fleets of buses and trucks in large cities. Developed by as soon as the recently launched P-50 platform reaches its peak production capacity of 180,000 bpd in Petrobras, the new fuel contributes to improve air quality and is part of the Company’s commitment to the Campos Basin. In a situation in which a scarcity of energy resources, mainly oil, has become more and social and environmental responsibility. more evident, achieving self-sufficiency represents an important step towards reducing the risk and Moreover, the projects that have been approved by the current management in Brazil have a vulnerability of Brazil´s trade balance. And Petrobras is proud to be making an important contribution commitment to domestic content of at least 60%, which will strengthen local industry and generate towards reaching this goal. thousands of direct and indirect jobs. Of particular note in this regard was the approval of the order for Petrobras has sought to expand its activities with the same entrepreneurial determination and spirit. 42 tankers — the largest to be given to the naval industry in the country. The Company’s project for international expansion is based upon the same ethical and business The confidence of our shareholders and investors in the Company’s results can be principles that are leading the Brazilian market to sustainable self-sufficiency. Thus, in 2005 Petrobras measured by the performance of our shares. During the course of 2005, there was an intensified its activities in Africa, South America and United States, strengthening its international increase in the average daily financial trading volume of Petrobras’ shares. After the presence. The Company’s overseas offensive also includes the purchase of assets in Colombia, Paraguay stock split concluded in September 2005, to make shares more accessible to small and Uruguay, and the acquisition of 50% of the Passadena Refinery in the United States, an investment and medium sized investors, Petrobras’ shares became the most-traded security on of some US$ 370 million that will add value to the oil produced by the Company. the São Paulo Stock Exchange. We expanded our shareholder base and earned an Pursuing the same strategic objective of adding value to its products, Petrobras decided to build a new investment grade rating from Moody’s Investor Service for our foreign currency debt refinery in the Northeast of Brazil, in the state of Pernambuco, with scheduled investments of US$ 2.5 — four levels higher than the classification of the Brazilian sovereign risk. billion. This is the first project for a Petrobras refining facility since conclusion of the Henrique Laje Petrobras’ results in 2005 were reflected in the Company’s market capitalization, Refinery (Revap) in 1980 in the state of São Paulo. which rose 54% in 2005. Today we are the 8th most valuable company in the sector in In the energy area, Petrobras took over full control of three power plants in 2005: TermoRio (1,040 the world and the highest valued in Latin America, according to Business Week magazine MW), Eletrobolt (388 MW) and TermoCeará (220 MW) — the latter two being Merchant type plants. In In the following pages, you will find greater detail about Petrobras’ results in 2005. February 2006, we signed a memorandum of understanding for the acquisition of the Macaé Merchant They were conquests that consecrated the efforts of our employees and suppliers Plant (929 MW), thus reducing the need to make contingency payments. We took major steps to expand along with the trust of our shareholders and customers. natural gas distribution infrastructure with the approval of projects such as the Southeast-Northeast Interconnection Pipeline (Gasene) and the expansion of the Southeast and Northeast grids, satisfying the JOSÉ SERGIO GABRIELLI DE AZEVEDO growing demand for our product. President and CEO of Petrobras One of the underpinnings of our action plan has been continuous massive investment in technological development. And the results can be seen in, for example, the national record for drilling depth: a slanting well that reached 6,915 meters below the sea bottom in the Santos Basin. Our refineries have been adapted — and this is a permanent practice — to process more heavy oil and to improve the quality of our products, extracting high added value oil products. We introduced Diesel 500, with 75% less sulfur 10 PETR OBRA S annual report 2005
  • 7. self-sufficiency The conquest of self-sufficiency 2003 The largest natural gas reserve on the Brazilian continental shelf is discovered in the Santos Basin. New light oil provinces are 1996 found in Espírito Santo 1987 and Sergipe, with high 1953 1953 The giant Roncador potential for Oil production at the giant Albacora field in field in the Campos October 3 | President Getúlio the Campos Basin is initiated in 420 meters exploration and Basin is discovered. Vargas signs Law 2004 that 1966 of water depth, a world record at the time. production. establishes the monopoly of the Creation of the Another giant oil field is discovered at the federal government over the Petrobras Research Campos Basin: Marlim Sul. activities of the oil industry in the Center (Cenpes). country and authorizes the creation of Petróleo Brasileiro S. A. – Petrobras as the state 1997 company to be the executor of Oil industry activities in Brazil the monopoly. are opened up to private 1977 1985 initiative. Production exceeds the historic milestone of 1 Campos Basin The giant Marlim Oil production in Brazil | 1953 to 2005 million barrels per day. production begins field is discovered through an early system installed at in the Campos 1988 Basin. the Enchova field. The Rio Urucu field starts producing in Alto Amazonas, celebrating a long period of 1961 1968 prospecting activities in the Amazon region. Exploration of the First offshore discovery continental platform of oil: the Guaricema from Maranhão to field in Sergipe. Espírito Santo is initiated. 1986 The Technological Innovation and Advanced 1963 Development in Deep and Ultra-Deep Water Program (PROCAP) is created. Initially, the 1954 The discovery of program studies solutions for exploration and the Carmópolis Petrobras begins its production in water up to 1,000 meters deep. (SE) field opens activities, taking over Subsequently, the studies are extended to up prospects for the collection of waters 2,000-3,000 meters in depth. production outside assets of the former of Bahia. 1974 1999 National Petroleum Council (CNP). The discovery of 1962 1994 Petrobras breaks the Production is 2,700 barrels of oil per day. The company the Garoupa field off the northern coast of Rio de The first semi-submersible work offshore production record at 2005 reaches the platform totally developed by the Roncador field Janeiro marks the On December 19, Petrobras sets a production mark Petrobras technicians in the Campos beginning of the production record of 1,857,425 of 100,000 barrels (Petrobras-18) begins Basin, producing at conquest of the barrels of oil per day. Work on the of oil per day. operations in the Marlim field 1,853 meters of Campos Basin, P-50 platform, which has the of the Campos Basin). water depth. which will become 1984 capacity to produce 180,000 the largest barrels a day, is concluded. production region The giant Albacora field is Installed in the Albacora Leste in the country. discovered in the Campos Basin. field of the Campos Basin, it will Production reaches 500,000 assure sustainable oil self- barrels per day. sufficiency for the country when it hits peak production in 2006.
  • 8. Conduct of the Oil market Conduct of the Oil market Oil prices continued rising in 2005, following a trend that began in 2004. the International Energy Agency, the oil price peaks were of short duration — US$ 67.5/bbl for Brent and US$ Even with the Brent and WTI oil were, respectively, 42% and 36% more expensive than the 69.8/bbl for WTI. On the oil product market, however, the reduction by 30% of refining activity in United States slowdown in the average of the previous year. This increase in prices, compared to the rises of led to an increase in real prices only comparable to that seen in the 1970s. similar magnitude that occurred during the decade of the 1970s, has been Even with the slowdown in the growth of world demand — 1.4% in 2005 against 3.8% in 2004 — it cannot growth of world presenting a singular characteristic because it is predominantly due to market be said that the increase in the price of oil is reducing the consumption of oil products and, as a result, crude oil demand — 1.4% in fundamentals rather than geopolitical events. sales. The control of the price of oil products in China and the subsequent stagnation of Chinese imports of such products contributed to reduced growth in demand, as did the impact of the hurricanes on the U.S. economy. 2005 against 3.8% in Oil Prices (US$/bbl, nominal) Nevertheless, prices remained high. Source: Bloomberg 2004 — it cannot be The growth of oil production in non-OPEC countries declined drastically in 2005, remaining practically stable, 80 said that the increase 70 according to the calculations of the International Energy Agency, compared to an increase of about 1 million bpd 60 in 2004. This decline is explained less by the fall in production in the mature regions such as the North Sea, than in the price of oil is 50 by the temporary halt in the Gulf of Mexico and — more importantly — by the strong slowdown of production in reducing the 40 Russia that went from average annual increases of 10% in each of the past five years to 2.4% in 2005. 30 consumption of oil 20 10 products and, as a 1.1.00 1.5.00 1.9.00 1.1.01 1.5.01 1.9.01 1.1.02 1.5.02 1.9.02 1.1.03 1.5.03 1.9.03 1.1.04 1.5.04 1.9.04 1.1.05 1.5.05 1.9.05 1.1.06 Private Oil Stocks in the U.S. (M bbl) OPEC Basket WTI Brent Source: US-DOE/EIA result, crude oil sales. Cesta OPEP WTI Brent 350.000 Strong price swings during the year also demonstrated the nervousness of the market in the face of any changes in the perception of the market funda- 330.000 mentals, a symptom of the exhaustion of capacity in the oil chain. In particu- lar, in 2005 attention was concentrated more on the stress in refining rather 310.000 than on production capacity. 290.000 In this sense, the effect of the passage of Hurricanes Katrina and Rita through the Gulf of Mexico was a clear sign that the system lacks flexibility to 270.000 2000-2004 band 2004 deal with unexpected events. Because the interruption of production was 250.000 2005 compensated for through the liberation of strategic inventories managed by 1 4 7 10 13 16 19 22 25 28 31 34 37 40 43 46 49 52 (after the hurricanes) weeks (semanas) Faixa 2000-2004 2004 2005 (Depois dos furações)