Más contenido relacionado
Gulf of Mexico decommissioning market 2013
- 1. Decomworld Market Analysis, Gulf of Mexico
Offshore Decommissioning Report 2013-14, Gulf of Mexico
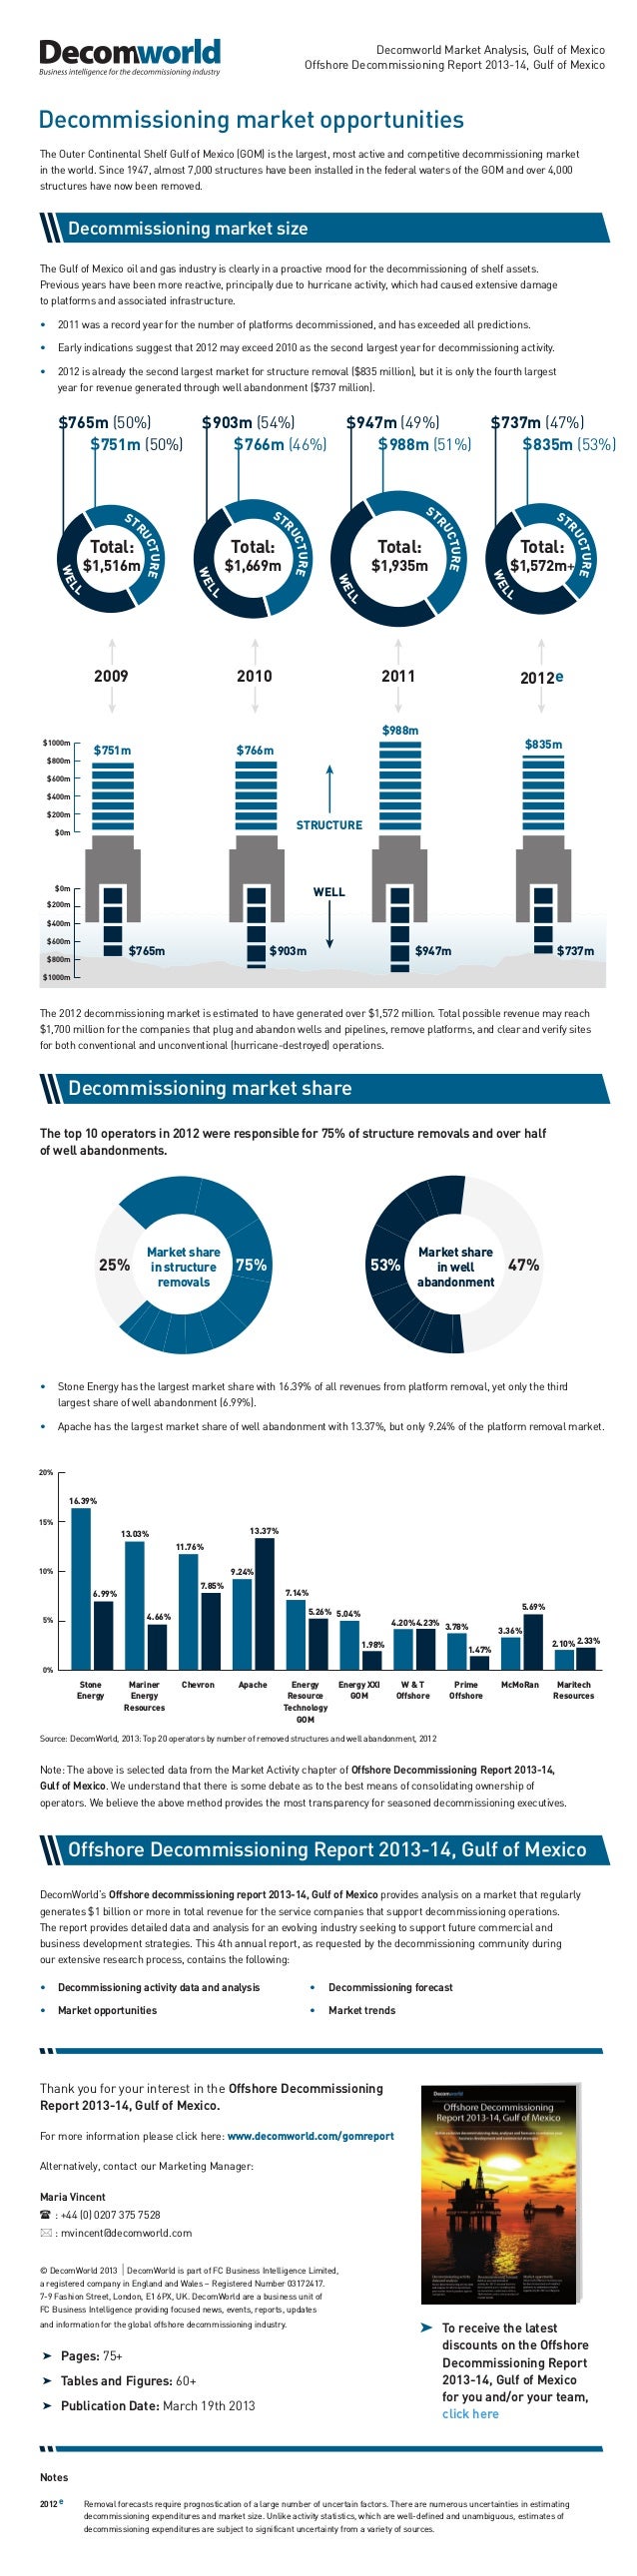
Decommissioning market opportunities
The Outer Continental Shelf Gulf of Mexico (GOM) is the largest, most active and competitive decommissioning market
in the world. Since 1947, almost 7,000 structures have been installed in the federal waters of the GOM and over 4,000
structures have now been removed.
Thank you for your interest in the Offshore Decommissioning
Report 2013-14, Gulf of Mexico.
For more information please click here: www.decomworld.com/gomreport
Alternatively, contact our Marketing Manager:
Maria Vincent
œ : +44 (0) 0207 375 7528
* : mvincent@decomworld.com
© DecomWorld 2013 | DecomWorld is part of FC Business Intelligence Limited,
a registered company in England and Wales – Registered Number 03172417.
7-9 Fashion Street, London, E1 6PX, UK. DecomWorld are a business unit of
FC Business Intelligence providing focused news, events, reports, updates
and information for the global offshore decommissioning industry.
Notes
2012e Removal forecasts require prognostication of a large number of uncertain factors. There are numerous uncertainties in estimating
decommissioning expenditures and market size. Unlike activity statistics, which are well-defined and unambiguous, estimates of
decommissioning expenditures are subject to significant uncertainty from a variety of sources.
➤ To receive the latest
discounts on the Offshore
Decommissioning Report
2013-14, Gulf of Mexico
for you and/or your team,
click here
STR
U
C
T
U
R
E
ST
R
U
C
T
U
R
E
STR
U
C
T
U
R
E
STR
U
C
T
U
R
E
Decommissioning market size
DecomWorld’s Offshore decommissioning report 2013-14, Gulf of Mexico provides analysis on a market that regularly
generates $1 billion or more in total revenue for the service companies that support decommissioning operations.
The report provides detailed data and analysis for an evolving industry seeking to support future commercial and
business development strategies. This 4th annual report, as requested by the decommissioning community during
our extensive research process, contains the following:
• Decommissioning activity data and analysis • Decommissioning forecast
• Market opportunities • Market trends
Offshore Decommissioning Report 2013-14, Gulf of Mexico
The top 10 operators in 2012 were responsible for 75% of structure removals and over half
of well abandonments.
Source: DecomWorld, 2013: Top 20 operators by number of removed structures and well abandonment, 2012
Note: The above is selected data from the Market Activity chapter of Offshore Decommissioning Report 2013-14,
Gulf of Mexico. We understand that there is some debate as to the best means of consolidating ownership of
operators. We believe the above method provides the most transparency for seasoned decommissioning executives.
Decommissioning market share
$765m (50%)
$751m (50%)
$903m (54%)
$766m (46%)
$947m (49%)
$988m (51%)
$737m (47%)
$835m (53%)
Total:
$1,935m
The Gulf of Mexico oil and gas industry is clearly in a proactive mood for the decommissioning of shelf assets.
Previous years have been more reactive, principally due to hurricane activity, which had caused extensive damage
to platforms and associated infrastructure.
• 2011 was a record year for the number of platforms decommissioned, and has exceeded all predictions.
• Early indications suggest that 2012 may exceed 2010 as the second largest year for decommissioning activity.
• 2012 is already the second largest market for structure removal ($835 million), but it is only the fourth largest
year for revenue generated through well abandonment ($737 million).
• Stone Energy has the largest market share with 16.39% of all revenues from platform removal, yet only the third
largest share of well abandonment (6.99%).
• Apache has the largest market share of well abandonment with 13.37%, but only 9.24% of the platform removal market.
W
E
L
L
W
E
L
L
W
E
L
L
W
E
L
L
2011
2010 2012e
2009
Total:
$1,572m+
Total:
$1,516m
Total:
$1,669m
Stone
Energy
Mariner
Energy
Resources
Chevron Apache Energy
Resource
Technology
GOM
Energy XXI
GOM
W & T
Offshore
Prime
Offshore
McMoRan Maritech
Resources
13.03%
11.76%
9.24%
7.14%
4.20%
3.78%
3.36%
2.10%
5.04%
16.39%
6.99%
7.85%
13.37%
5.26%
1.98%
4.23%
1.47%
5.69%
2.33%
4.66%
$765m $903m $947m $737m
$0m
$200m
$400m
$600m
$800m
$1000m
$0m
$200m
$800m
$600m
$400m
$1000m
STRUCTURE
WELL
$988m
$835m
$751m $766m
The 2012 decommissioning market is estimated to have generated over $1,572 million. Total possible revenue may reach
$1,700 million for the companies that plug and abandon wells and pipelines, remove platforms, and clear and verify sites
for both conventional and unconventional (hurricane-destroyed) operations.
0%
5%
10%
15%
20%
Market share
in structure
removals
Market share
in well
abandonment
25% 75% 53% 47%
➤ Pages: 75+
➤ Tables and Figures: 60+
➤ Publication Date: March 19th 2013