SlideShare una empresa de Scribd logo
1 de 47
EX.NO:01                 ANALYSIS DESCRIPTIVE MEASURES ON
DATE:08.03.10
                                  STUDENTS MARKS

The marks of 12 students in mathematics are as follows:


Students 1       2     3      4     5         6    7      8    9    10   11   12
Marks    45      67    78     98    100       72   91     34   94   61   82   92


CALCULATE THE FOLLOWING:

1.CENTRL TENDENCY

                 MEAN
                 MEDIAN
                 MODE
                 SUM

2. DISPERSION

                STANDARD DEVIATION
                VARIANCE
                RANGE
                MINIMUM
                MAXIMUM
                S.E.MEAN

3.DISTRIBUTION

                 SKEWNESS
                 KURTOSIS


                                          1
AIM:

         To analysis the descriptive measures of students marks using SPSS

ALGORITHM:

STEP1: Open SPSS software 13.0

STEP2: Click and select „Data view‟

STEP3: Type the marks of the students in the marks column

STEP4: Click on <Analyze><Descriptive statistics><Frequencies>

STEP5: Select the marks and click on the scrollbar

STEP6: Click on the “Statistics bar” and select all central tendency and
       dispersion, distribution boxes then click on continue and “ok

STEP7: Solve the solution tables and Generate reports.


                                        2
OUTPUT:


          3
4
RESULT:

           Thus, the descriptive measures like central tendency, dispersion and
distribution of student‟s marks are analyzed and output is verified using SPSS 13.0.


                                         5
EX.NO:02                           DIAGRAMMATIC ANALYSIS ON
DATE:08.03.10
                                        STUDENTS MARKS

The Quiz final marks are as follows:


Name Suji     Ravi   Bini   Devi   Sumi Siji   Vani   Gayana Deepa Saji   Suthi Cibi
Marks 45      67     78     98     100  72     91     34     94    61     82    92

FIND THE FOLLOWING:

        1. Frequencies
        2. Bar graph
        3. pichart
        4. histogram
        5. Create a title for the above

AIM:

   To analysis students marks diagrammatically using SPSS 13.0

ALGORITHM:

STEP1: Open SPSS software 13.0

STEP2: Click and select „Data view‟

STEP3: Type the final marks of the students in the marks column

STEP4: Click on <Analyze><Descriptive statistics><Frequencies>

STEP5: Select the marks and click on the scrollbar

STEP6: Click on the “Charts “and select bar graph, pichart, histogram then click
       On continue and “ok”

STEP7: Type the name of the charts and Generate reports.


                                          6
OUTPUT:


          7
BAR CHART:


             8
PICHART:


           9
FINAL QUIZ MARKS DETAILS:


                            10
RESULT:

        Thus, students marks has diagrammatically been analyzed and output is verified
using SPSS 13.3.


                                       11
EX.NO:03                        HYPOTHESIS TESTING ON SALES AND
DATE:15.3.10                       EXPENDITURE DATA(T-TEST)

The Following data have been taken from the marketing company


sales       50      55     67      74   80    85     89   95     98    99    100   110
Expenditure 45      67     78      98   100   72     91   34     94    61    86    89


   From the above data find out:

   1.Means
   2.One sample T- test
   3.One way ANOVA

AIM:

   To analysis sales and expenditure using T-Test


ALGORITHM:

STEP1: Open SPSS software 13.0

STEP2: Click and select „Data view‟

STEP3: Type the sales and expenditure of the company

STEP4: Click on <Analyze><compare means><one sample T test>
       <One-Way ANOVA>

STEP5: Select the sales and click on the scrollbar

STEP6:    Select the Expenditure and click on the scrollbar and click “ok”

STEP7: solve the solution tables and Generate reports.


                                        12
OUTPUT:


          13
14
15
16
RESULT:

        Thus, Sales and Expenditure are analyzed by T – test and output is

Verified using SPSS 13.0.


                                      17
EX.NO:04                  CHI SQUARE TESTING ON PERFORMANCE IN
DATE:15.3.10                      STRESSFULL SITUATION


The Following data have been taken the test of mental performance in stress full situation
for 10 boys and10 girls


    Boys 2         2       4       1       4       3      0       2       7     5
    Girls 4        4       6       0       6       5      2       3       6     4

   Analysis the above data using chi square test

AIM:

   To analysis the performance in stress full situation using chi-square test

ALGORITHM:

STEP1: Open SPSS software 13.0

STEP2: Click and select „Data view‟

STEP3: Type the boys and girls mental performance

STEP4: Click on <Analyze><non parametric test><chi square test>

STEP5: Select the boys and click on the scrollbar

STEP6:    Select the girls and click on the scrollbar and click “ok”

STEP7: solve the solution tables and Generate reports


                                         18
OUTPUT:


          19
RESULT:

         Thus, the performance in stress full situation by using Chi-Square test is
analyzed.


                                         20
EX.NO:05                         FINDING THE CORRELATION
DATE:23.3.10
                                       COEFFICIENT

Calculate the Karl Pearson correlation coefficient for the following data


    x       28     41      40      38      35       33    40      32        36   33
    y       23     34      33      34      30       26    28      31        36   38

Aim:

   To find the correlation coefficient using SPSS

ALGORITHM:

STEP1: Open SPSS software 13.0

STEP2: Click and select „Data view‟

STEP3: Type the X and Y values

STEP4: Click on <Analyze><correlate><Bivarite><Pearson>

STEP5: Select the x and y and click on the scrollbar

STEP6: Click “ok” to solve the solution tables

STEP7: Generate reports


                                         21
OUTPUT:


          22
RESULT:

     Thus, correlation coefficient is found out and verified the output using SPSS 13.0


                                      23
EX.NO:06                         FINDING THE REGRESSION
DATE:23.3.10

Calculate the regression for the following data

 X        1        5        3         2           1   1       7   3
 Y        6        1        0         0           1   2       1   3

Aim:

To find the Regression using SPSS 13.0


ALGORITHM:

STEP1: Open spss Package 13.0

STEP2: Click and select „Data view‟

STEP3: Type the X and Y values

STEP4: Click on <Analyze><regression><linear>

STEP5: Select the x click on the scrollbar of dependent

STEP6: Select the y click on the scrollbar of independent

STEP7: click “ok” to solve the solution tables Generate reports


                                          24
OUTPUT:


          25
RESULT:

      Thus Regression is found out and output is verified using SPSS 13.0


                                   26
EX.NO:07                     LINEAR PROGRAMMING PROBLEM
DATE:30.3.10
 Problem :

       Max Z=15x1+6x2+9x3+2x4.

       Subject to the constraints,

            2x1+x2+5x3+6x4≤20
            3x1+x2+3x3+25x4≤24
            7x1+x4≤70.
            x1,x2,x3,x4≥0


Aim:

       To solve the Linear Programming Problem using the TORA.


ALGORITHM:

STEP1: Open the TORA software

STEP2: Choose the type of problem to be solved

STEP3: Enter the problem

STEP4: Save the problem using F8key

STEP5: View the given data to ensure the correctness of given problem

STEP6: Solve the problem either by automated procedure or user guided
       Procedure.

STEP7: view the solution and print the solution


                                       27
OUTPUT:


          28
29
30
31
RESULT:

              Thus, Linear Programming Problem is solved and output is
verified using TORA software.


                                  32
EX.NO:08                       TRANSPORTATION PROBLEM
DATE:07.4.10

Problem:
     A company has factories at three different bases S1, S2, S3. Which supply item to
warehouse D1, D2, D3 monthly factory capacity are 140,160,120 respectively.

    Monthly warehouse requirements are 100, 160, and 70 respectively. Unit shipping
cost are given (rupees) in following details.


          Plant       D1       D2      D3      D4    Supply

            S1        16        19     12       0     140

            S2        12        13     19       0     160

            S3        14        28      8      0      120

         Demand       100      150     70     100     420

Aim:

    To solve the Transportation Problem using the TORA software.


ALGORITHM:

STEP1: Open the TORA software

STEP2: Choose the type of problem to be solved

STEP3: Enter the problem

STEP4: Save the problem using F8key

STEP5: View the given data to ensure the correctness of given problem


                                        33
STEP6: Solve the problem either by automated procedure or user guided
       Procedure

STEP7: view the solution and print the solution


                                       34
OUTPUT:


          35
36
RESULT:

        Thus, the Transportation Problem is solved and output is verified
using TORA software.


                                   37
EX.NO:09                            QUEUING PROBLEM
DATE:13.5.10

Problem:
      A television repairman finds that the time spent on his jobs has an
exponential distribution with a mean of 30 minutes. If he repairs sets in the order in
which they came in, and if the arrival of sets follows a Poisson distribution
approximately with an average rate of 10 per 8-hour day, what is the repairman‟s
expected idle time each day? How many jobs are ahead of the average set just
brought in?


Aim:

     To solve the Queuing Problem using the TORA software.

Steps to be followed:

STEP1: Open the TORA software

STEP2: Choose the type of problem to be solved

STEP3: Enter the problem

STEP4: Save the problem using F8 key

STEP5: View the given data to ensure the correctness of given data

STEP6: Solve the problem either by automated procedure or user guided
       Procedure

STEP7: view the solution and print the solution


                                          38
OUTPUT:


          39
RESULT:

      Thus the Queuing problem is solved and output is verified using
TORA software.


                                  40
EX.NO:10                 INTEGER LINEAR PROGRAMMING
DATE19.5.10

Problem:

      Solve the following integer linear programming using Gomory‟s cutting
plane algorithm.

    Max Z=x1+2x2.

    Subject to the constraints,

         2x2 ≤ 7
         x1+x2 ≥ 7
         2x1 ≥ 11
         x1,x2 ≥ 0

Aim:

    To solve the Integer Linear Programming Problem using the TORA software.


ALGORITHM:

STEP1: Open the TORA software

STEP2: Choose the type of problem to be solved

STEP3: Enter the problem

STEP4: Save the problem using F8 key

STEP5: View the given data to ensure the correctness of given problem

STEP6: Solve the problem either by automated procedure or user guided
       Procedure

STEP7: view the solution and print the solution


                                       41
OUTPUT:


          42
RESULT:

          Thus, the Integer Linear Programming Problem is solved and
output is verified using TORA software.


                                    43
EX.NO:11                                NETWORK MODELS
DATE:20.5.10

Problem:
            Consider the details of a distance network as shown below.
                  Arc           Distance
                  1-2           3
                  1-3           8
                  1-4           10
                  2-3           4
                  2-4           7
                  3-4           2
                  3-5           8
                  4-5           6
       Apply Floyd‟s algorithm and obtain the final matrices using TORA.

Aim:

    To solve the Network models Programming Problem using the TORA
Software.


ALGORITHM:

STEP1: Open the TORA software

STEP2: Choose the type of problem to be solved

STEP3: Enter the problem

STEP4: Save the problem using F8 key

STEP5: View the given data to ensure the correctness of given problem

STEP6: Solve the problem either by automated procedure or user guided
       Procedure

STEP7: view the solution and print the solution


                                        44
OUTPUT:


          45
46
RESULT:

          Thus, the Integer Linear Programming Problem is solved and
output is verified using TORA software.


                                    47

Más contenido relacionado

Similar a Spss&tora

qc-tools.ppt
qc-tools.pptqc-tools.ppt
qc-tools.pptAlpharoot
 
Calculator Manipulation.pptx
Calculator Manipulation.pptxCalculator Manipulation.pptx
Calculator Manipulation.pptxfroilandoblon1
 
Software testing - EXAMPLE
Software testing  - EXAMPLESoftware testing  - EXAMPLE
Software testing - EXAMPLEpriyasoundar
 
Exploratory data analysis v1.0
Exploratory data analysis v1.0Exploratory data analysis v1.0
Exploratory data analysis v1.0Vishy Chandra
 
7 QC(Quality Control) Tools
7 QC(Quality Control) Tools7 QC(Quality Control) Tools
7 QC(Quality Control) Toolsmanju3426
 
problem-solving.pptx
problem-solving.pptxproblem-solving.pptx
problem-solving.pptxhadi261715
 
CSC1100 - Chapter12 - Flow Charts
CSC1100 - Chapter12 - Flow ChartsCSC1100 - Chapter12 - Flow Charts
CSC1100 - Chapter12 - Flow ChartsYhal Htet Aung
 
What are Clickers?
What are Clickers?What are Clickers?
What are Clickers?smceuen
 
Missing Parts I don’t think you understood the assignment.docx
Missing Parts I don’t think you understood the assignment.docxMissing Parts I don’t think you understood the assignment.docx
Missing Parts I don’t think you understood the assignment.docxannandleola
 
Six Sigma Process Capability Study (PCS) Training Module
Six Sigma Process Capability Study (PCS) Training Module Six Sigma Process Capability Study (PCS) Training Module
Six Sigma Process Capability Study (PCS) Training Module Frank-G. Adler
 
Engineering Data Analysis-ProfCharlton
Engineering Data  Analysis-ProfCharltonEngineering Data  Analysis-ProfCharlton
Engineering Data Analysis-ProfCharltonCharltonInao1
 
Workshop: Your first machine learning project
Workshop: Your first machine learning projectWorkshop: Your first machine learning project
Workshop: Your first machine learning projectAlex Austin
 
7 QC Tools For Problem Solving Presentation.pdf
7 QC Tools For Problem Solving Presentation.pdf7 QC Tools For Problem Solving Presentation.pdf
7 QC Tools For Problem Solving Presentation.pdfOlivierNgono
 

Similar a Spss&tora (20)

qc-tools.ppt
qc-tools.pptqc-tools.ppt
qc-tools.ppt
 
Quality control tools
Quality control toolsQuality control tools
Quality control tools
 
Calculator Manipulation.pptx
Calculator Manipulation.pptxCalculator Manipulation.pptx
Calculator Manipulation.pptx
 
Practical 01 (detailed)
Practical 01 (detailed)Practical 01 (detailed)
Practical 01 (detailed)
 
Software testing - EXAMPLE
Software testing  - EXAMPLESoftware testing  - EXAMPLE
Software testing - EXAMPLE
 
Mathcad
MathcadMathcad
Mathcad
 
Exploratory data analysis v1.0
Exploratory data analysis v1.0Exploratory data analysis v1.0
Exploratory data analysis v1.0
 
7 QC(Quality Control) Tools
7 QC(Quality Control) Tools7 QC(Quality Control) Tools
7 QC(Quality Control) Tools
 
problem-solving.pptx
problem-solving.pptxproblem-solving.pptx
problem-solving.pptx
 
Fundamentals of Programming Chapter 3
Fundamentals of Programming Chapter 3Fundamentals of Programming Chapter 3
Fundamentals of Programming Chapter 3
 
PSP LAB MANUAL.pdf
PSP LAB MANUAL.pdfPSP LAB MANUAL.pdf
PSP LAB MANUAL.pdf
 
CSC1100 - Chapter12 - Flow Charts
CSC1100 - Chapter12 - Flow ChartsCSC1100 - Chapter12 - Flow Charts
CSC1100 - Chapter12 - Flow Charts
 
What are Clickers?
What are Clickers?What are Clickers?
What are Clickers?
 
Aguirre.Module2.Problemset.pdf
Aguirre.Module2.Problemset.pdfAguirre.Module2.Problemset.pdf
Aguirre.Module2.Problemset.pdf
 
Missing Parts I don’t think you understood the assignment.docx
Missing Parts I don’t think you understood the assignment.docxMissing Parts I don’t think you understood the assignment.docx
Missing Parts I don’t think you understood the assignment.docx
 
Six Sigma Process Capability Study (PCS) Training Module
Six Sigma Process Capability Study (PCS) Training Module Six Sigma Process Capability Study (PCS) Training Module
Six Sigma Process Capability Study (PCS) Training Module
 
Data Analysis
Data AnalysisData Analysis
Data Analysis
 
Engineering Data Analysis-ProfCharlton
Engineering Data  Analysis-ProfCharltonEngineering Data  Analysis-ProfCharlton
Engineering Data Analysis-ProfCharlton
 
Workshop: Your first machine learning project
Workshop: Your first machine learning projectWorkshop: Your first machine learning project
Workshop: Your first machine learning project
 
7 QC Tools For Problem Solving Presentation.pdf
7 QC Tools For Problem Solving Presentation.pdf7 QC Tools For Problem Solving Presentation.pdf
7 QC Tools For Problem Solving Presentation.pdf
 

Último

THEORIES OF ORGANIZATION-PUBLIC ADMINISTRATION
THEORIES OF ORGANIZATION-PUBLIC ADMINISTRATIONTHEORIES OF ORGANIZATION-PUBLIC ADMINISTRATION
THEORIES OF ORGANIZATION-PUBLIC ADMINISTRATIONHumphrey A Beña
 
MULTIDISCIPLINRY NATURE OF THE ENVIRONMENTAL STUDIES.pptx
MULTIDISCIPLINRY NATURE OF THE ENVIRONMENTAL STUDIES.pptxMULTIDISCIPLINRY NATURE OF THE ENVIRONMENTAL STUDIES.pptx
MULTIDISCIPLINRY NATURE OF THE ENVIRONMENTAL STUDIES.pptxAnupkumar Sharma
 
Virtual-Orientation-on-the-Administration-of-NATG12-NATG6-and-ELLNA.pdf
Virtual-Orientation-on-the-Administration-of-NATG12-NATG6-and-ELLNA.pdfVirtual-Orientation-on-the-Administration-of-NATG12-NATG6-and-ELLNA.pdf
Virtual-Orientation-on-the-Administration-of-NATG12-NATG6-and-ELLNA.pdfErwinPantujan2
 
Inclusivity Essentials_ Creating Accessible Websites for Nonprofits .pdf
Inclusivity Essentials_ Creating Accessible Websites for Nonprofits .pdfInclusivity Essentials_ Creating Accessible Websites for Nonprofits .pdf
Inclusivity Essentials_ Creating Accessible Websites for Nonprofits .pdfTechSoup
 
Influencing policy (training slides from Fast Track Impact)
Influencing policy (training slides from Fast Track Impact)Influencing policy (training slides from Fast Track Impact)
Influencing policy (training slides from Fast Track Impact)Mark Reed
 
Field Attribute Index Feature in Odoo 17
Field Attribute Index Feature in Odoo 17Field Attribute Index Feature in Odoo 17
Field Attribute Index Feature in Odoo 17Celine George
 
Choosing the Right CBSE School A Comprehensive Guide for Parents
Choosing the Right CBSE School A Comprehensive Guide for ParentsChoosing the Right CBSE School A Comprehensive Guide for Parents
Choosing the Right CBSE School A Comprehensive Guide for Parentsnavabharathschool99
 
Visit to a blind student's school🧑‍🦯🧑‍🦯(community medicine)
Visit to a blind student's school🧑‍🦯🧑‍🦯(community medicine)Visit to a blind student's school🧑‍🦯🧑‍🦯(community medicine)
Visit to a blind student's school🧑‍🦯🧑‍🦯(community medicine)lakshayb543
 
Student Profile Sample - We help schools to connect the data they have, with ...
Student Profile Sample - We help schools to connect the data they have, with ...Student Profile Sample - We help schools to connect the data they have, with ...
Student Profile Sample - We help schools to connect the data they have, with ...Seán Kennedy
 
Activity 2-unit 2-update 2024. English translation
Activity 2-unit 2-update 2024. English translationActivity 2-unit 2-update 2024. English translation
Activity 2-unit 2-update 2024. English translationRosabel UA
 
ISYU TUNGKOL SA SEKSWLADIDA (ISSUE ABOUT SEXUALITY
ISYU TUNGKOL SA SEKSWLADIDA (ISSUE ABOUT SEXUALITYISYU TUNGKOL SA SEKSWLADIDA (ISSUE ABOUT SEXUALITY
ISYU TUNGKOL SA SEKSWLADIDA (ISSUE ABOUT SEXUALITYKayeClaireEstoconing
 
Food processing presentation for bsc agriculture hons
Food processing presentation for bsc agriculture honsFood processing presentation for bsc agriculture hons
Food processing presentation for bsc agriculture honsManeerUddin
 
ENGLISH 7_Q4_LESSON 2_ Employing a Variety of Strategies for Effective Interp...
ENGLISH 7_Q4_LESSON 2_ Employing a Variety of Strategies for Effective Interp...ENGLISH 7_Q4_LESSON 2_ Employing a Variety of Strategies for Effective Interp...
ENGLISH 7_Q4_LESSON 2_ Employing a Variety of Strategies for Effective Interp...JhezDiaz1
 
Grade 9 Quarter 4 Dll Grade 9 Quarter 4 DLL.pdf
Grade 9 Quarter 4 Dll Grade 9 Quarter 4 DLL.pdfGrade 9 Quarter 4 Dll Grade 9 Quarter 4 DLL.pdf
Grade 9 Quarter 4 Dll Grade 9 Quarter 4 DLL.pdfJemuel Francisco
 
Daily Lesson Plan in Mathematics Quarter 4
Daily Lesson Plan in Mathematics Quarter 4Daily Lesson Plan in Mathematics Quarter 4
Daily Lesson Plan in Mathematics Quarter 4JOYLYNSAMANIEGO
 
ANG SEKTOR NG agrikultura.pptx QUARTER 4
ANG SEKTOR NG agrikultura.pptx QUARTER 4ANG SEKTOR NG agrikultura.pptx QUARTER 4
ANG SEKTOR NG agrikultura.pptx QUARTER 4MiaBumagat1
 

Último (20)

THEORIES OF ORGANIZATION-PUBLIC ADMINISTRATION
THEORIES OF ORGANIZATION-PUBLIC ADMINISTRATIONTHEORIES OF ORGANIZATION-PUBLIC ADMINISTRATION
THEORIES OF ORGANIZATION-PUBLIC ADMINISTRATION
 
MULTIDISCIPLINRY NATURE OF THE ENVIRONMENTAL STUDIES.pptx
MULTIDISCIPLINRY NATURE OF THE ENVIRONMENTAL STUDIES.pptxMULTIDISCIPLINRY NATURE OF THE ENVIRONMENTAL STUDIES.pptx
MULTIDISCIPLINRY NATURE OF THE ENVIRONMENTAL STUDIES.pptx
 
FINALS_OF_LEFT_ON_C'N_EL_DORADO_2024.pptx
FINALS_OF_LEFT_ON_C'N_EL_DORADO_2024.pptxFINALS_OF_LEFT_ON_C'N_EL_DORADO_2024.pptx
FINALS_OF_LEFT_ON_C'N_EL_DORADO_2024.pptx
 
Virtual-Orientation-on-the-Administration-of-NATG12-NATG6-and-ELLNA.pdf
Virtual-Orientation-on-the-Administration-of-NATG12-NATG6-and-ELLNA.pdfVirtual-Orientation-on-the-Administration-of-NATG12-NATG6-and-ELLNA.pdf
Virtual-Orientation-on-the-Administration-of-NATG12-NATG6-and-ELLNA.pdf
 
Inclusivity Essentials_ Creating Accessible Websites for Nonprofits .pdf
Inclusivity Essentials_ Creating Accessible Websites for Nonprofits .pdfInclusivity Essentials_ Creating Accessible Websites for Nonprofits .pdf
Inclusivity Essentials_ Creating Accessible Websites for Nonprofits .pdf
 
Influencing policy (training slides from Fast Track Impact)
Influencing policy (training slides from Fast Track Impact)Influencing policy (training slides from Fast Track Impact)
Influencing policy (training slides from Fast Track Impact)
 
Field Attribute Index Feature in Odoo 17
Field Attribute Index Feature in Odoo 17Field Attribute Index Feature in Odoo 17
Field Attribute Index Feature in Odoo 17
 
Choosing the Right CBSE School A Comprehensive Guide for Parents
Choosing the Right CBSE School A Comprehensive Guide for ParentsChoosing the Right CBSE School A Comprehensive Guide for Parents
Choosing the Right CBSE School A Comprehensive Guide for Parents
 
Visit to a blind student's school🧑‍🦯🧑‍🦯(community medicine)
Visit to a blind student's school🧑‍🦯🧑‍🦯(community medicine)Visit to a blind student's school🧑‍🦯🧑‍🦯(community medicine)
Visit to a blind student's school🧑‍🦯🧑‍🦯(community medicine)
 
Student Profile Sample - We help schools to connect the data they have, with ...
Student Profile Sample - We help schools to connect the data they have, with ...Student Profile Sample - We help schools to connect the data they have, with ...
Student Profile Sample - We help schools to connect the data they have, with ...
 
LEFT_ON_C'N_ PRELIMS_EL_DORADO_2024.pptx
LEFT_ON_C'N_ PRELIMS_EL_DORADO_2024.pptxLEFT_ON_C'N_ PRELIMS_EL_DORADO_2024.pptx
LEFT_ON_C'N_ PRELIMS_EL_DORADO_2024.pptx
 
Activity 2-unit 2-update 2024. English translation
Activity 2-unit 2-update 2024. English translationActivity 2-unit 2-update 2024. English translation
Activity 2-unit 2-update 2024. English translation
 
YOUVE_GOT_EMAIL_PRELIMS_EL_DORADO_2024.pptx
YOUVE_GOT_EMAIL_PRELIMS_EL_DORADO_2024.pptxYOUVE_GOT_EMAIL_PRELIMS_EL_DORADO_2024.pptx
YOUVE_GOT_EMAIL_PRELIMS_EL_DORADO_2024.pptx
 
ISYU TUNGKOL SA SEKSWLADIDA (ISSUE ABOUT SEXUALITY
ISYU TUNGKOL SA SEKSWLADIDA (ISSUE ABOUT SEXUALITYISYU TUNGKOL SA SEKSWLADIDA (ISSUE ABOUT SEXUALITY
ISYU TUNGKOL SA SEKSWLADIDA (ISSUE ABOUT SEXUALITY
 
Raw materials used in Herbal Cosmetics.pptx
Raw materials used in Herbal Cosmetics.pptxRaw materials used in Herbal Cosmetics.pptx
Raw materials used in Herbal Cosmetics.pptx
 
Food processing presentation for bsc agriculture hons
Food processing presentation for bsc agriculture honsFood processing presentation for bsc agriculture hons
Food processing presentation for bsc agriculture hons
 
ENGLISH 7_Q4_LESSON 2_ Employing a Variety of Strategies for Effective Interp...
ENGLISH 7_Q4_LESSON 2_ Employing a Variety of Strategies for Effective Interp...ENGLISH 7_Q4_LESSON 2_ Employing a Variety of Strategies for Effective Interp...
ENGLISH 7_Q4_LESSON 2_ Employing a Variety of Strategies for Effective Interp...
 
Grade 9 Quarter 4 Dll Grade 9 Quarter 4 DLL.pdf
Grade 9 Quarter 4 Dll Grade 9 Quarter 4 DLL.pdfGrade 9 Quarter 4 Dll Grade 9 Quarter 4 DLL.pdf
Grade 9 Quarter 4 Dll Grade 9 Quarter 4 DLL.pdf
 
Daily Lesson Plan in Mathematics Quarter 4
Daily Lesson Plan in Mathematics Quarter 4Daily Lesson Plan in Mathematics Quarter 4
Daily Lesson Plan in Mathematics Quarter 4
 
ANG SEKTOR NG agrikultura.pptx QUARTER 4
ANG SEKTOR NG agrikultura.pptx QUARTER 4ANG SEKTOR NG agrikultura.pptx QUARTER 4
ANG SEKTOR NG agrikultura.pptx QUARTER 4
 

Spss&tora

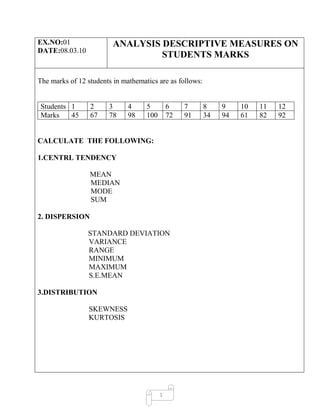
  • 1. EX.NO:01 ANALYSIS DESCRIPTIVE MEASURES ON DATE:08.03.10 STUDENTS MARKS The marks of 12 students in mathematics are as follows: Students 1 2 3 4 5 6 7 8 9 10 11 12 Marks 45 67 78 98 100 72 91 34 94 61 82 92 CALCULATE THE FOLLOWING: 1.CENTRL TENDENCY MEAN MEDIAN MODE SUM 2. DISPERSION STANDARD DEVIATION VARIANCE RANGE MINIMUM MAXIMUM S.E.MEAN 3.DISTRIBUTION SKEWNESS KURTOSIS 1
  • 2. AIM: To analysis the descriptive measures of students marks using SPSS ALGORITHM: STEP1: Open SPSS software 13.0 STEP2: Click and select „Data view‟ STEP3: Type the marks of the students in the marks column STEP4: Click on <Analyze><Descriptive statistics><Frequencies> STEP5: Select the marks and click on the scrollbar STEP6: Click on the “Statistics bar” and select all central tendency and dispersion, distribution boxes then click on continue and “ok STEP7: Solve the solution tables and Generate reports. 2
  • 4. 4
  • 5. RESULT: Thus, the descriptive measures like central tendency, dispersion and distribution of student‟s marks are analyzed and output is verified using SPSS 13.0. 5
  • 6. EX.NO:02 DIAGRAMMATIC ANALYSIS ON DATE:08.03.10 STUDENTS MARKS The Quiz final marks are as follows: Name Suji Ravi Bini Devi Sumi Siji Vani Gayana Deepa Saji Suthi Cibi Marks 45 67 78 98 100 72 91 34 94 61 82 92 FIND THE FOLLOWING: 1. Frequencies 2. Bar graph 3. pichart 4. histogram 5. Create a title for the above AIM: To analysis students marks diagrammatically using SPSS 13.0 ALGORITHM: STEP1: Open SPSS software 13.0 STEP2: Click and select „Data view‟ STEP3: Type the final marks of the students in the marks column STEP4: Click on <Analyze><Descriptive statistics><Frequencies> STEP5: Select the marks and click on the scrollbar STEP6: Click on the “Charts “and select bar graph, pichart, histogram then click On continue and “ok” STEP7: Type the name of the charts and Generate reports. 6
  • 10. FINAL QUIZ MARKS DETAILS: 10
  • 11. RESULT: Thus, students marks has diagrammatically been analyzed and output is verified using SPSS 13.3. 11
  • 12. EX.NO:03 HYPOTHESIS TESTING ON SALES AND DATE:15.3.10 EXPENDITURE DATA(T-TEST) The Following data have been taken from the marketing company sales 50 55 67 74 80 85 89 95 98 99 100 110 Expenditure 45 67 78 98 100 72 91 34 94 61 86 89 From the above data find out: 1.Means 2.One sample T- test 3.One way ANOVA AIM: To analysis sales and expenditure using T-Test ALGORITHM: STEP1: Open SPSS software 13.0 STEP2: Click and select „Data view‟ STEP3: Type the sales and expenditure of the company STEP4: Click on <Analyze><compare means><one sample T test> <One-Way ANOVA> STEP5: Select the sales and click on the scrollbar STEP6: Select the Expenditure and click on the scrollbar and click “ok” STEP7: solve the solution tables and Generate reports. 12
  • 13. OUTPUT: 13
  • 14. 14
  • 15. 15
  • 16. 16
  • 17. RESULT: Thus, Sales and Expenditure are analyzed by T – test and output is Verified using SPSS 13.0. 17
  • 18. EX.NO:04 CHI SQUARE TESTING ON PERFORMANCE IN DATE:15.3.10 STRESSFULL SITUATION The Following data have been taken the test of mental performance in stress full situation for 10 boys and10 girls Boys 2 2 4 1 4 3 0 2 7 5 Girls 4 4 6 0 6 5 2 3 6 4 Analysis the above data using chi square test AIM: To analysis the performance in stress full situation using chi-square test ALGORITHM: STEP1: Open SPSS software 13.0 STEP2: Click and select „Data view‟ STEP3: Type the boys and girls mental performance STEP4: Click on <Analyze><non parametric test><chi square test> STEP5: Select the boys and click on the scrollbar STEP6: Select the girls and click on the scrollbar and click “ok” STEP7: solve the solution tables and Generate reports 18
  • 19. OUTPUT: 19
  • 20. RESULT: Thus, the performance in stress full situation by using Chi-Square test is analyzed. 20
  • 21. EX.NO:05 FINDING THE CORRELATION DATE:23.3.10 COEFFICIENT Calculate the Karl Pearson correlation coefficient for the following data x 28 41 40 38 35 33 40 32 36 33 y 23 34 33 34 30 26 28 31 36 38 Aim: To find the correlation coefficient using SPSS ALGORITHM: STEP1: Open SPSS software 13.0 STEP2: Click and select „Data view‟ STEP3: Type the X and Y values STEP4: Click on <Analyze><correlate><Bivarite><Pearson> STEP5: Select the x and y and click on the scrollbar STEP6: Click “ok” to solve the solution tables STEP7: Generate reports 21
  • 22. OUTPUT: 22
  • 23. RESULT: Thus, correlation coefficient is found out and verified the output using SPSS 13.0 23
  • 24. EX.NO:06 FINDING THE REGRESSION DATE:23.3.10 Calculate the regression for the following data X 1 5 3 2 1 1 7 3 Y 6 1 0 0 1 2 1 3 Aim: To find the Regression using SPSS 13.0 ALGORITHM: STEP1: Open spss Package 13.0 STEP2: Click and select „Data view‟ STEP3: Type the X and Y values STEP4: Click on <Analyze><regression><linear> STEP5: Select the x click on the scrollbar of dependent STEP6: Select the y click on the scrollbar of independent STEP7: click “ok” to solve the solution tables Generate reports 24
  • 25. OUTPUT: 25
  • 26. RESULT: Thus Regression is found out and output is verified using SPSS 13.0 26
  • 27. EX.NO:07 LINEAR PROGRAMMING PROBLEM DATE:30.3.10 Problem : Max Z=15x1+6x2+9x3+2x4. Subject to the constraints, 2x1+x2+5x3+6x4≤20 3x1+x2+3x3+25x4≤24 7x1+x4≤70. x1,x2,x3,x4≥0 Aim: To solve the Linear Programming Problem using the TORA. ALGORITHM: STEP1: Open the TORA software STEP2: Choose the type of problem to be solved STEP3: Enter the problem STEP4: Save the problem using F8key STEP5: View the given data to ensure the correctness of given problem STEP6: Solve the problem either by automated procedure or user guided Procedure. STEP7: view the solution and print the solution 27
  • 28. OUTPUT: 28
  • 29. 29
  • 30. 30
  • 31. 31
  • 32. RESULT: Thus, Linear Programming Problem is solved and output is verified using TORA software. 32
  • 33. EX.NO:08 TRANSPORTATION PROBLEM DATE:07.4.10 Problem: A company has factories at three different bases S1, S2, S3. Which supply item to warehouse D1, D2, D3 monthly factory capacity are 140,160,120 respectively. Monthly warehouse requirements are 100, 160, and 70 respectively. Unit shipping cost are given (rupees) in following details. Plant D1 D2 D3 D4 Supply S1 16 19 12 0 140 S2 12 13 19 0 160 S3 14 28 8 0 120 Demand 100 150 70 100 420 Aim: To solve the Transportation Problem using the TORA software. ALGORITHM: STEP1: Open the TORA software STEP2: Choose the type of problem to be solved STEP3: Enter the problem STEP4: Save the problem using F8key STEP5: View the given data to ensure the correctness of given problem 33
  • 34. STEP6: Solve the problem either by automated procedure or user guided Procedure STEP7: view the solution and print the solution 34
  • 35. OUTPUT: 35
  • 36. 36
  • 37. RESULT: Thus, the Transportation Problem is solved and output is verified using TORA software. 37
  • 38. EX.NO:09 QUEUING PROBLEM DATE:13.5.10 Problem: A television repairman finds that the time spent on his jobs has an exponential distribution with a mean of 30 minutes. If he repairs sets in the order in which they came in, and if the arrival of sets follows a Poisson distribution approximately with an average rate of 10 per 8-hour day, what is the repairman‟s expected idle time each day? How many jobs are ahead of the average set just brought in? Aim: To solve the Queuing Problem using the TORA software. Steps to be followed: STEP1: Open the TORA software STEP2: Choose the type of problem to be solved STEP3: Enter the problem STEP4: Save the problem using F8 key STEP5: View the given data to ensure the correctness of given data STEP6: Solve the problem either by automated procedure or user guided Procedure STEP7: view the solution and print the solution 38
  • 39. OUTPUT: 39
  • 40. RESULT: Thus the Queuing problem is solved and output is verified using TORA software. 40
  • 41. EX.NO:10 INTEGER LINEAR PROGRAMMING DATE19.5.10 Problem: Solve the following integer linear programming using Gomory‟s cutting plane algorithm. Max Z=x1+2x2. Subject to the constraints, 2x2 ≤ 7 x1+x2 ≥ 7 2x1 ≥ 11 x1,x2 ≥ 0 Aim: To solve the Integer Linear Programming Problem using the TORA software. ALGORITHM: STEP1: Open the TORA software STEP2: Choose the type of problem to be solved STEP3: Enter the problem STEP4: Save the problem using F8 key STEP5: View the given data to ensure the correctness of given problem STEP6: Solve the problem either by automated procedure or user guided Procedure STEP7: view the solution and print the solution 41
  • 42. OUTPUT: 42
  • 43. RESULT: Thus, the Integer Linear Programming Problem is solved and output is verified using TORA software. 43
  • 44. EX.NO:11 NETWORK MODELS DATE:20.5.10 Problem: Consider the details of a distance network as shown below. Arc Distance 1-2 3 1-3 8 1-4 10 2-3 4 2-4 7 3-4 2 3-5 8 4-5 6 Apply Floyd‟s algorithm and obtain the final matrices using TORA. Aim: To solve the Network models Programming Problem using the TORA Software. ALGORITHM: STEP1: Open the TORA software STEP2: Choose the type of problem to be solved STEP3: Enter the problem STEP4: Save the problem using F8 key STEP5: View the given data to ensure the correctness of given problem STEP6: Solve the problem either by automated procedure or user guided Procedure STEP7: view the solution and print the solution 44
  • 45. OUTPUT: 45
  • 46. 46
  • 47. RESULT: Thus, the Integer Linear Programming Problem is solved and output is verified using TORA software. 47