Canberra housing affordability feels weight of price falls
•
0 recomendaciones•221 vistas

Propell National Valuers

Recomendados
Recomendados
Más contenido relacionado
La actualidad más candente
La actualidad más candente (18)
Similar a Canberra housing affordability feels weight of price falls
Similar a Canberra housing affordability feels weight of price falls (20)
Más de Property News
Más de Property News (14)
Último
Último (16)
Canberra housing affordability feels weight of price falls
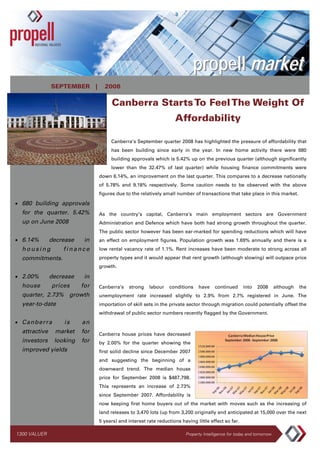
- 1. propell market SEPTEMBER | 2008 Canberra Starts To Feel The Weight Of Affordability Canberra’s September quarter 2008 has highlighted the pressure of affordability that has been building since early in the year. In new home activity there were 680 building approvals which is 5.42% up on the previous quarter (although significantly lower than the 32.47% of last quarter) while housing finance commitments were down 6.14%, an improvement on the last quarter. This compares to a decrease nationally of 5.78% and 9.18% respectively. Some caution needs to be observed with the above figures due to the relatively small number of transactions that take place in this market. • 680 building approvals for the quarter. 5.42% As the country’s capital, Canberra’s main employment sectors are Government up on June 2008 Administration and Defence which have both had strong growth throughout the quarter. The public sector however has been ear-marked for spending reductions which will have • 6.14% decrease in an effect on employment figures. Population growth was 1.69% annually and there is a housing finance low rental vacancy rate of 1.1%. Rent increases have been moderate to strong across all property types and it would appear that rent growth (although slowing) will outpace price commitments. growth. • 2.00% decrease in house prices for Canberra’s strong labour conditions have continued into 2008 although the quarter, 2.73% growth unemployment rate increased slightly to 2.9% from 2.7% registered in June. The year-to-date importation of skill sets in the private sector through migration could potentially offset the withdrawal of public sector numbers recently flagged by the Government. • Canberra is an attractive market for Canberra house prices have decreased investors looking for by 2.00% for the quarter showing the improved yields first solid decline since December 2007 and suggesting the beginning of a downward trend. The median house price for September 2008 is $487,798. This represents an increase of 2.73% since September 2007. Affordability is now keeping first home buyers out of the market with moves such as the increasing of land releases to 3,470 lots (up from 3,200 originally and anticipated at 15,000 over the next 5 years) and interest rate reductions having little effect so far. 1300 VALUER Property Intelligence for today and tomorrow
- 2. Propell National Valuers | Residential Overview | SEPT 2008 House and unit price growth in the top 10 suburbs for the year-to-date varied from 46.4% in Forrest through to 17.5% in Weetangera for houses, and 45.8% in Farrer to 17.2% in Holt for units, with evidence showing that properties near the CBD and outer suburban areas had the most growth. Deteriorating affordability saw activity increase in the fringe suburbs and properties located near major transport routes also did well. While rental growth has eased, investors have still been active in the higher yielding suburbs. The diversity of suburb locations and variety of product type in Canberra (not to mention the fact that property is held on a leasehold basis in this market) has lead to disparity in house price growth. While • Forrest top the general market has only fallen slightly at this stage, and some areas have done quite well performing suburb over the year-to-date as detailed below, there is evidence of 6% falls in the mid to lower with growth of 46.4% range and up to 15% falls in the top end product type in recent months. for houses and Farrer The table below illustrates the top 10 Canberra growth suburbs based on median house and unit prices for the September quarter 2008 year-to-date. with 45.8% for units Top 10 Growth Suburbs • Rental growth set to Suburb Median Q3 Median% Suburb Median Q3 Median% (Houses) 2008 Change (Units) 2008 Change be the dominant Forrest $2,160,000 46.4 Farrer $358,000 45.8 factor for 2008-09 Yarralumla $1,000,000 24.2 Mawson $387,000 41.2 Isaacs $884,000 22.8 Kaleen $409,000 34.1 Scullin $420,000 20.8 Pearce $397,500 32.5 Banks $540,000 20.3 Hughes $240,000 29.7 Lyneham $550,000 19.6 Campbell $300,000 23.5 Bruce $595,000 19.0 Dickson $380,000 22.6 Dickson $535,000 18.9 Evatt $358,500 21.5 Fisher $472,500 18.7 City $415,000 20.3 Weetangera $622,500 17.5 Holt $322,250 17.2 Source: RPData Canberra’s house price has increased by 2.73% for the year to September, while unit price growth has been 7.64%. This compares to South Australia(10.84% and 11.46%), Melbourne (5.80% and 4.16%), Brisbane(3.66% and 1.73%), Darwin(12.89 and 10.34%), Perth(-4.31% and 1.26%), Hobart(9.94% and –7.23%), and Sydney(-1.48% and -1.18%) Source: RPData 2| QUARTERLY RESIDENTIAL REPORT—Canberra
- 3. Propell National Valuers | Residential Overview | SEPT 2008 Residential Rental Market In the September quarter vacancy rates increased to 1.1%, from 1.0% in June 2008. The average weekly rent for a two bedroom unit in Canberra is $385 per week. This is an increase of 1.31% over the quarter and 5.47% for the year-to-date. The average weekly rent for a three bedroom house in Canberra is $410 per week, an increase of 1.23% and 5.12% year-to-date. Current tenant demand for rental properties in Canberra is strong although rents are considered by some to be too high, which is reflected in the low growth this quarter. Rental distress is still evident in the marketplace and people are looking outside the city centre for value. The graph below illustrates the average residential rent growth in three bedroom houses and two bedroom units in the Canberra area over the last two years. • Vacancy rate increases to1.1% for quarter • Competition for rental properties strong and Source: REIACT rental stress evident • Yields on houses at The table below highlights median rents within the Statistical Division of Canberra for the 4.71%, units 5.60% September quarter 2008. These figures represent the average of all house and units within the Division. The gross rental yield figure is also shown. Canberra Statistical Sept-08 Sept-07 Qtr Yearly Gross Division % Change % Change Rental Yield Houses $410 $390 1.23% 5.12% 4.71% Units $385 $365 1.31% 5.47% 5.60% Source: REIACT Suburb Sales Q1 2007 Median Q1 2007 Sales Q1 2008 Median Q1 2008 Median % Change 3| QUARTERLY RESIDENTIAL REPORT—Canberra
- 4. Propell National Valuers | Residential Overview | SEPT 2008 Population As at December 2007, The Canberra Statistical Division had a population growth of 1.69%, the fourth highest in the country behind the Statistical Divisions of Darwin (2.65%), Perth (2.32%) and Brisbane (2.04%). This represented a total of 5,633 people or the equivalent of 108 people per week. The ACT and Balance as a whole grew by 1.69% or 5,640 people. The largest growth continued to occur in the Statistical Subdivisions of Gungahlin-Hall (7.10%), North Canberra(2.11%) and Belconnen(1.57%) with a decrease in Tuggeranong (0.01%) and a low in Woden Valley(0.19%) Net Natural Increase to December 2007 decreased from 836 to 766(9.1%) compared to September 2007, while Net Interstate Migration decreased significantly by 62% with 222 people leaving the state as opposed to 587 the previous quarter. Net Overseas Migration was also low at only 53 arrivals compared to 211 the previous quarter. The ACT is not traditionally a state that attracts a lot of overseas migrants with most of the state’s growth being achieved through natural increase and the attraction of government employment position from interstaters. In terms of the natural increase and its relation to property growth, an emerging trend has been the number of local youth moving into the property • Canberra Statistical market after leaving home. This trend has been increasing lately and is expected to Division has population continue for some years. The development of new suburbs and the opportunities for employment are keeping many of the younger generation in the local area instead of increase of 1.69% leaving town for opportunities elsewhere. • Net interstate migration The Australian Capital Territory’s Gross State Product for the year to December 2007 was decreases significantly 5.0% (above the average of 3.6%), with a State Final Demand of 5.6%. This contributed to Total Domestic Demand by 0.2%. • Canberrans work fewer According to the latest ACT Stats (1334.8) release of December 2007, more Canberrans hours than national are participating in the labour force but are working fewer hours. Full-time employees in counterparts the ACT worked an average of 42.4 hours per week, lower than the national average of 44.1 hours per week. Part-time employees worked an average of 18.4 hours per week which is on-par with the national average. Approximately three quarters (73%) of the population aged 15 years and over participated in the labour force. This was the highest of all states and territories compared to the national average of 65%. Women(67%) were twice as likely as men(33%) to participate in part-time employment. In a not-so-surprising twist, it would seem that residents of the ACT live longer than the rest of the country. A boy born today is expected to live to the age of 79.9 while a girl could expect to live to 84. This compares to the national average of 75.5 and 83.3 respectively. 4| QUARTERLY RESIDENTIAL REPORT—Canberra
- 5. Propell National Valuers | Residential Overview | SEPT 2008 Major Projects The 2008-2009 ACT budget (The Building The Future Program) outlined a massive investment in Capital Works infrastructure including: Capital Works Investment $300 million start up investment in the creation of a new health system $200 million to boost existing capital works $250 million on roads and transport $100 million on urban amenities $100 million on climate change initiatives $50 million on Information and communications technology Health $90 million—Women’s and children’s hospital at Canberra Hospital $23.6 million—Adult acute mental health unit $18 million—New community health centre at Gungahlin Transport $21 million—Upgrade of Tharwa Drive and Airport roads • Over $1 billion outlined $49.5 million—ACTION bus fleet replacement for Capital Works $22 million—Duplication of Athllon Drive and Flemington Road programs for 2008-09 $40-$50 million on the duplication of Gungahlin Drive providing better access to emerging suburbs • The “Building The Future” program will be FOR MORE INFORMATION Summary CONTACT carried out over 5 years Jeff Whitman Canberra’s September quarter has confirmed the Manager ACT June quarter predictions that house prices have peaked, rental growth is slowing and affordability is AAPI, CPV beginning to bite. Reductions in interest rates and jwhitman@propellvaluers.com release of land parcels have not produced any 02 6257 7112 stimulus as yet (partly due to the long lead time involved where the land is concerned) and whispers of public sector spending reductions could produce Aaron Parker further stress in the region. Outer lying areas of Research Manager Canberra seem to be offering the best prospects for investors due to high yields but lack of capital growth aparker@propellvaluers.com in the near future could see them sitting on the OR CALL sidelines for a while. First home buyers are priced out of the market and local and global economic 1300 VALUER problems are not making it any easier for them to get (1300 825 837) in. There is some support however from local youth buying in to the market (maybe with parental assistance) after moving out of home. Propell National Values does not give any warranty in relation to the accuracy of the information contained in this report. If you intend to rely upon the information contained herein, you must take note that the information, figures and projections have been provided by various sources and have not been verified by us. Whilst all care has been taken in the preparation of this report, we have no belief one-way or the other in relation to the accuracy of such information, figures and projections contained herein. Propell National Valuers will not be liable for any loss or damage resulting from any statement, figure, projection or any other information that you rely upon that is contained in the material. COPYRIGHT - Propell National Valuers 2008 5| QUARTERLY RESIDENTIAL REPORT—Canberra