

Recomendados
Más contenido relacionado
La actualidad más candente
La actualidad más candente (20)
Destacado
Destacado (18)
Similar a what-drives-a-movie-goer-to-wach-movies
Similar a what-drives-a-movie-goer-to-wach-movies (20)
Último
Último (20)
what-drives-a-movie-goer-to-wach-movies
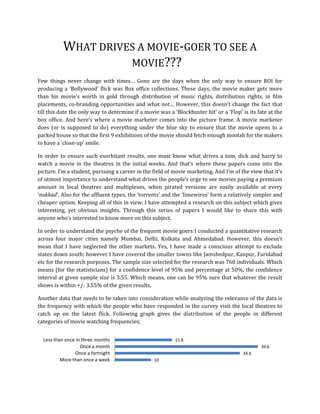
- 1. WHAT DRIVES A MOVIE‐GOER TO SEE A MOVIE??? Few things never change with times… Gone are the days when the only way to ensure ROI for producing a ‘Bollywood’ flick was Box office collections. These days, the movie maker gets more than his movie’s worth in gold through distribution of music rights, distribution rights, in film placements, co‐branding opportunities and what not… However, this doesn’t change the fact that till this date the only way to determine if a movie was a ‘Blockbuster hit’ or a ‘Flop’ is its fate at the box office. And here’s where a movie marketer comes into the picture frame. A movie marketer does (or is supposed to do) everything under the blue sky to ensure that the movie opens to a packed house so that the first 9 exhibitions of the movie should fetch enough moolah for the makers to have a ‘close‐up’ smile. In order to ensure such exorbitant results, one must know what drives a tom, dick and harry to watch a movie in the theatres in the initial weeks. And that’s where these papers come into the picture. I’m a student, pursuing a career in the field of movie marketing. And I’m of the view that it’s of utmost importance to understand what drives the people’s urge to see movies paying a premium amount in local theatres and multiplexes, when pirated versions are easily available at every ‘nukkad’. Also for the affluent types, the ‘torrents’ and the ‘limewires’ form a relatively simpler and cheaper option. Keeping all of this in view, I have attempted a research on this subject which gives interesting, yet obvious insights. Through this series of papers I would like to share this with anyone who’s interested to know more on this subject. In order to understand the psyche of the frequent movie goers I conducted a quantitative research across four major cities namely Mumbai, Delhi, Kolkata and Ahmedabad. However, this doesn’t mean that I have neglected the other markets. Yes, I have made a conscious attempt to exclude states down south; however I have covered the smaller towns like Jamshedpur, Kanpur, Faridabad etc for the research purposes. The sample size selected for the research was 760 individuals. Which means (for the statisticians) for a confidence level of 95% and percentage at 50%, the confidence interval at given sample size is 3.55. Which means, one can be 95% sure that whatever the result shows is within +/‐ 3.55% of the given results. Another data that needs to be taken into consideration while analyzing the relevance of the data is the frequency with which the people who have responded in the survey visit the local theatres to catch up on the latest flick. Following graph gives the distribution of the people in different categories of movie watching frequencies; Less than once in three months 15.8 Once a month 39.6 Once a fortnight 34.6 More than once a week 10
- 2. The graph clearly shows that around 84% of the total respondents watch movies in the theatres which includes single theatres, multiplexes, local screens (like the one in Sanpada station) and open theatres (like ‘Drive in’ in Ahmedabad). To give you the age‐wise distribution of the respondents, please refer to the following fig; 40+ years 1.8 30 years‐39 years 15.8 20 years‐29 years 61.2 15 years‐19 years 14 12 years‐14 years 7.1 The research data shows a bit of a skew towards the 20+ year age group, as compared to any other age group. However, the numbers here are indicative of the percentage in each age group, which when computed comes out to be a sizeable number. For example, 15.8% in the 30 years‐39 years category amounts to 120 odd respondents across cities and so on so forth. Also, as per the reports submitted by major research organizations of the country, the reach of cinema as a medium within age groups also matches the above graph, which validates the age‐wise distribution of the respondents. Now let’s get down to hard core number crunching… For this part, we would be looking at the trends and likes of respondents who watch movies in theatres once or more than once a fortnight. For people in this group, following is the distribution; More than once a week Once a fortnight When we look at the age‐wise distribution within this group, it more or less resembles the overall distribution with 60.9% in the 20 years‐29 years category, 14.2% each in 30 years‐39 years and 15 years‐19 years category. Followed by 12 years‐14 years category at 8.3% and 40+ years category at 2.4%. What would be interesting to know is what do these people love to see in the theatres? These can be determined from their current viewing habits. The reason why its important to know their viewing habits is because they form the core part of the opinion leaders amongst their peer group, influencing the movie viewing decisions of a sizeable audience. Thus following are their preferences,
- 3. Love story 56.8 Epics 27.8 Children 19.5 Musicals 29.0 Animation 29.0 Action 46.2 Thriller 53.8 Comedy 69.2 As the results show, there is a clear preference of ‘Comedy/Humor’ as a genre over any other. Probably that explains the success of latest Vipul Shah Movies, without undermining Akshay Kumar’s role as well. The next in line is ‘Love Stories’, the age old bollywood formula…What follows is, ‘thrillers’ and ‘Action’ movies. As the result clearly shows, there’s no real enthusiasm towards Animation and Musicals as a genre of movies, probably ‘Roadside Romeo’ by Yashraj Films might change this a little bit; although we have seen movies like ‘Hanuman’ succeed at the box office. I think we can end this part here, probably discuss a few more insights from the research next time round. However, I would solicit your feedback on this article. Also if you wish to see the entire report, please feel free to write to me at filmmarketeer@gmail.com