SlideShare una empresa de Scribd logo
1 de 2
Descargar para leer sin conexión
Investor Actions and Consequences

                    The current bear market situation has many people contemplating their commitment to long-
                    term strategic asset allocation. Investors may be asking themselves, “Where will the market go
                    from here? Is this the bottom, or is the market headed lower?”

                    The graph below shows the results of four hypothetical investors. All of them invested $10,000
                    in January 1976. With the exception of the 100% equity investor who invested solely in the S&P
                    500, all others rebalanced annually.

                    Of the four, two investors bought and held:
Understand the
long-term cost of   •	 The	dark	blue	line	represents	an	investor	who	bought	the	S&P	500	and	held.		His	experience	was	
being out of the       the most volatile, but he ended with the highest return.
market              •	 The	green	line	shows	an	investor	who	invested	in	60%	S&P	500	and	40%	Lehman	Aggregate	
                       Bond, and held through all types of markets throughout the past 32 years. While she netted a
                       lower return than the 100% equity investor, she experienced a smoother ride.
                    The other two investors pulled their money out either during or after a 10% or greater decline in
                    the S&P 500. Their thinking follows that of some investors today, “I’ll just sit on the sidelines for
                    awhile, and wait for the market to come back a bit…”
                    •	 The	orange	line	shows	an	investor	who	sold	at	the	worst	possible	time.		He	withdrew	his	
                       money when the market bottomed out and waited for the S&P 500 to get back to even before
                       reinvesting.
                    •	 The	yellow	line	represents	an	investor	with	slightly	better	timing.		She	sold	when	the	market	was	
                       down 10%, experiencing only some of the market decline, but still waited for the S&P 500 to get
                       back to breakeven. In other words, if the market was ultimately down 20% at its worst point, this
                       investor would have had the foresight to get out while there was only a 10% decline.
                    •	 The	blue	shaded	areas	show	when	these	clients	were	out	of	the	market.		The	investor	with	slightly	
                       better timing was out of the market for a longer period of time than the investor who redeemed
                       at the absolute bottom, 29% of the time vs. 15% respectively.

                                                                                                                                                                                              Ending
                                                                                                                                                                                              Values
                      $450,000
                                                   60 Eq / 40 Fl Portfolio

                                                   60 Eq / 40 Fl Missing the Worst,
                      $400,000                                                                                                                                                                $387,656
                                                   But Waiting for Breakeven
                                                   60 Eq / 40 Fl Selling at the Bottom
                      $350,000
                                                   S&P 500

                      $300,000
                                                                                                                                                                                              $278,976
                      $250,000
                                                    Performance of a $10,000 Investment
                                                         from Jan 1976 to July 2008
                      $200,000

                      $150,000

                                                                                                                                                                                              $112,855
                      $100,000
                                                                                                                                                                                              $77,084
                       $50,000

                           $0
                                 Jan-76


                                          Jan-78


                                                       Jan-80


                                                                Jan-82


                                                                         Jan-84


                                                                                  Jan-86


                                                                                           Jan-88


                                                                                                    Jan-90


                                                                                                             Jan-92


                                                                                                                      Jan-94


                                                                                                                               Jan-96


                                                                                                                                        Jan-98


                                                                                                                                                 Jan-00


                                                                                                                                                          Jan-02


                                                                                                                                                                   Jan-04


                                                                                                                                                                            Jan-06


                                                                                                                                                                                     Jan-08


                           Performance data is for Lehman Brothers Aggregate Bond Index and S&P 500 rebalanced annually                                     Source: Morningstar Encorr


Avoid selling at     As illustrated above, the investors who panicked and sold were in a much worse position over
the wrong time       time. Their inability to correctly time the market bottom and the missed opportunities of being
                     out of the market altogether had a negative impact for these investors over the long run.
92-0601 (1008)
Outcomes for 60% Equity / 40% Fixed Income Investors
                                                                                                             % Shortfall vs. Stay the
                                          Investor                                  Ending Balance                                              Dollar Shortfall
                                                                                                                Course Investor
                  Staying the Course                                                  $278,976                           ---                           ---
                  Losing Only 10%                                                     $112,855                       - 59.5%                     - $166,121
                  Getting Out at the Worst Time                                           $77,084                    - 72.4%                     - $201,892


                                   Below is a chart that illustrates the length and severity of S&P 500 declines of 10% or greater. You’ll
                                   notice that although some of the declines have been severe, the market and the economy have come
                                   back to reach new highs.

                 S&P 500 Declines of 10% or Greater
                       Peak Date                 Trough Date               Recovery Date             Decline (%)             Decline Duration    Recovery Duration
                         Aug-29                      Jun-32                   Jan-45                  - 83.41                      34                    151
                         May-46                      Nov-46                    Oct-49                 - 21.76                       6                        35
                          Jul-56                     Feb-57                    Jul-57                 - 10.24                       7                        5
                          Jul-57                     Dec-57                    Jul-58                 - 14.95                       5                        7
                         Dec-61                      Jun-62                    Apr-63                 - 22.28                       6                        10
                         Jan-66                      Sep-66                   Mar-67                  - 15.64                       8                        6
                         Nov-68                      Jun-70                   Mar-71                  - 29.25                      19                        9
                         Dec-72                      Sep-74                   Jun-76                  - 42.63                      21                        21
                         Dec-76                      Feb-78                    Jul-78                 - 14.13                      14                        5
                         Nov-80                      Jul-82                    Oct-82                 - 16.91                      20                        3
                         Aug-87                      Nov-87                   May-89                  - 29.53                       3                        18
                         May-90                      Oct-90                   Feb-91                   - 14.7                       5                        4
                         Jun-98                      Aug-98                   Nov-98                  - 15.37                       2                        3
                         Aug-00                      Sep-02                    Oct-06                 - 44.73                      25                        49
                         Oct-07                       ???                       ???                   - 16.89                       9                    ???

Let logic prevail                  The result of this analysis is clear. Investors who attempt to avoid losses, or otherwise “time” the
                                   market, did more harm to themselves than good when compared to the investor who “stayed the
over fear
                                   course.” Investors who sold out after significant drops experienced the worst returns by far. Attempting
                                   to pick market tops or bottoms can result in increased transaction costs, lost opportunities, and the
                                   potential for investing or withdrawing at the worst time. Some investors who attempt to time the
                                   market may think, “Well I won’t wait for the market to break even before reinvesting.” That may sound
                                   logical, but when is the right time to reinvest? What if you invest the money too soon and the market
                                   heads lower and continues to acheive new lows? Do you sell again? What if the market has several good
                                   days and you miss your planned entry point?
                                   Although it may be painful or seem like the wrong thing to do, staying invested in a well diversified,
                                   strategically allocated portfolio helps investors fare better in both good and bad markets.


                                                                                                            The Northwestern Mutual
Past performance is no guarantee of future results. This is for illustrative purposes
only and not indicative of any investment. An investment cannot be made directly in an                      Life Insurance Company • Milwaukee, WI
index. Returns and principal invested in stocks are not guaranteed. Holding a portfolio
                                                                                                            www.nmfn.com
of securities for the long-term does not insure a profitable outcome and investing in
securities always involves risk of loss.                                                                    92-0601 (1008)
Source: Stocks are represented by the Standard & Poor’s 500®, which is an unmanaged
group of securities and considered to be representative of the stock market in general.
The Northwestern Mutual Financial Network is a marketing name for the sales and
distribution arm of The Northwestern Mutual Life Insurance Company, its affiliates and
subsidiaries. Securities offered through Northwestern Mutual Investment Services, LLC
(NMIS), member FINRA and SIPC. 1-866-664-7737. NMIS is a wholly owned company of
Northwestern Mutual. Northwestern Mutual is not a broker-dealer.

Más contenido relacionado

Similar a Understand the long-term cost of being out of the market

January 2010 Windermere Real Estate Sales Charts
January 2010   Windermere Real Estate Sales ChartsJanuary 2010   Windermere Real Estate Sales Charts
January 2010 Windermere Real Estate Sales Chartsgueste6ce48
 
January 2010 Windermere Real Estate Sales Charts
January 2010   Windermere Real Estate Sales ChartsJanuary 2010   Windermere Real Estate Sales Charts
January 2010 Windermere Real Estate Sales Chartsguest80a43a
 
January 2010 Windermere Real Estate Sales Charts
January 2010    Windermere  Real  Estate  Sales  ChartsJanuary 2010    Windermere  Real  Estate  Sales  Charts
January 2010 Windermere Real Estate Sales Chartsguest80a43a
 
Windermere Real Estate January 2010 Sales Charts (Palm Springs Area)
Windermere Real Estate January 2010 Sales Charts (Palm Springs Area) Windermere Real Estate January 2010 Sales Charts (Palm Springs Area)
Windermere Real Estate January 2010 Sales Charts (Palm Springs Area) SDM: Music Venture
 
20 July Presentation
20 July Presentation20 July Presentation
20 July PresentationDonBrown3PM
 
Gold correction represents buying opportunity skyrocketing u s federal debt ...
Gold correction represents buying opportunity skyrocketing u s  federal debt ...Gold correction represents buying opportunity skyrocketing u s  federal debt ...
Gold correction represents buying opportunity skyrocketing u s federal debt ...Lucas Litwiniuk, CFA
 
ASIAN CAPITAL FLOWS – INTO, OUT OF, AND WITHIN ASIA (Paige Mueller) - ULI fal...
ASIAN CAPITAL FLOWS – INTO, OUT OF, AND WITHIN ASIA (Paige Mueller) - ULI fal...ASIAN CAPITAL FLOWS – INTO, OUT OF, AND WITHIN ASIA (Paige Mueller) - ULI fal...
ASIAN CAPITAL FLOWS – INTO, OUT OF, AND WITHIN ASIA (Paige Mueller) - ULI fal...Virtual ULI
 

Similar a Understand the long-term cost of being out of the market (11)

January 2010 Windermere Real Estate Sales Charts
January 2010   Windermere Real Estate Sales ChartsJanuary 2010   Windermere Real Estate Sales Charts
January 2010 Windermere Real Estate Sales Charts
 
January 2010 Windermere Real Estate Sales Charts
January 2010   Windermere Real Estate Sales ChartsJanuary 2010   Windermere Real Estate Sales Charts
January 2010 Windermere Real Estate Sales Charts
 
January 2010 Windermere Real Estate Sales Charts
January 2010    Windermere  Real  Estate  Sales  ChartsJanuary 2010    Windermere  Real  Estate  Sales  Charts
January 2010 Windermere Real Estate Sales Charts
 
Windermere Real Estate January 2010 Sales Charts (Palm Springs Area)
Windermere Real Estate January 2010 Sales Charts (Palm Springs Area) Windermere Real Estate January 2010 Sales Charts (Palm Springs Area)
Windermere Real Estate January 2010 Sales Charts (Palm Springs Area)
 
Annuity graph
Annuity graphAnnuity graph
Annuity graph
 
Annuity graph
Annuity graphAnnuity graph
Annuity graph
 
20 July Presentation
20 July Presentation20 July Presentation
20 July Presentation
 
Gold correction represents buying opportunity skyrocketing u s federal debt ...
Gold correction represents buying opportunity skyrocketing u s  federal debt ...Gold correction represents buying opportunity skyrocketing u s  federal debt ...
Gold correction represents buying opportunity skyrocketing u s federal debt ...
 
Midas Quick Overview
Midas Quick OverviewMidas Quick Overview
Midas Quick Overview
 
Samp1
Samp1Samp1
Samp1
 
ASIAN CAPITAL FLOWS – INTO, OUT OF, AND WITHIN ASIA (Paige Mueller) - ULI fal...
ASIAN CAPITAL FLOWS – INTO, OUT OF, AND WITHIN ASIA (Paige Mueller) - ULI fal...ASIAN CAPITAL FLOWS – INTO, OUT OF, AND WITHIN ASIA (Paige Mueller) - ULI fal...
ASIAN CAPITAL FLOWS – INTO, OUT OF, AND WITHIN ASIA (Paige Mueller) - ULI fal...
 

Más de ramit

Ramit Sethi in Glamour Magazine 2010
Ramit Sethi in Glamour Magazine 2010Ramit Sethi in Glamour Magazine 2010
Ramit Sethi in Glamour Magazine 2010ramit
 
2 ricky ramit seo presentation(2)
2 ricky ramit seo presentation(2)2 ricky ramit seo presentation(2)
2 ricky ramit seo presentation(2)ramit
 
1 ramit august 3rd 2010 iwt overview
1 ramit august 3rd 2010   iwt overview1 ramit august 3rd 2010   iwt overview
1 ramit august 3rd 2010 iwt overviewramit
 
Recession-Proof Graduate
Recession-Proof GraduateRecession-Proof Graduate
Recession-Proof Graduateramit
 
I Will Teach You To Be Rich is a New York Times bestseller
I Will Teach You To Be Rich is a New York Times bestsellerI Will Teach You To Be Rich is a New York Times bestseller
I Will Teach You To Be Rich is a New York Times bestsellerramit
 
Save 1,000 In 30 Days
Save 1,000 In 30 DaysSave 1,000 In 30 Days
Save 1,000 In 30 Daysramit
 
Create your automatic money flow
Create your automatic money flowCreate your automatic money flow
Create your automatic money flowramit
 
Cheap vs. frugal
Cheap vs. frugalCheap vs. frugal
Cheap vs. frugalramit
 
Table Of Contents Ppt For Iwillteachyoutoberich Book
Table Of Contents Ppt For Iwillteachyoutoberich BookTable Of Contents Ppt For Iwillteachyoutoberich Book
Table Of Contents Ppt For Iwillteachyoutoberich Bookramit
 
Are you spending less because of a possible recession?
Are you spending less because of a possible recession?Are you spending less because of a possible recession?
Are you spending less because of a possible recession?ramit
 

Más de ramit (10)

Ramit Sethi in Glamour Magazine 2010
Ramit Sethi in Glamour Magazine 2010Ramit Sethi in Glamour Magazine 2010
Ramit Sethi in Glamour Magazine 2010
 
2 ricky ramit seo presentation(2)
2 ricky ramit seo presentation(2)2 ricky ramit seo presentation(2)
2 ricky ramit seo presentation(2)
 
1 ramit august 3rd 2010 iwt overview
1 ramit august 3rd 2010   iwt overview1 ramit august 3rd 2010   iwt overview
1 ramit august 3rd 2010 iwt overview
 
Recession-Proof Graduate
Recession-Proof GraduateRecession-Proof Graduate
Recession-Proof Graduate
 
I Will Teach You To Be Rich is a New York Times bestseller
I Will Teach You To Be Rich is a New York Times bestsellerI Will Teach You To Be Rich is a New York Times bestseller
I Will Teach You To Be Rich is a New York Times bestseller
 
Save 1,000 In 30 Days
Save 1,000 In 30 DaysSave 1,000 In 30 Days
Save 1,000 In 30 Days
 
Create your automatic money flow
Create your automatic money flowCreate your automatic money flow
Create your automatic money flow
 
Cheap vs. frugal
Cheap vs. frugalCheap vs. frugal
Cheap vs. frugal
 
Table Of Contents Ppt For Iwillteachyoutoberich Book
Table Of Contents Ppt For Iwillteachyoutoberich BookTable Of Contents Ppt For Iwillteachyoutoberich Book
Table Of Contents Ppt For Iwillteachyoutoberich Book
 
Are you spending less because of a possible recession?
Are you spending less because of a possible recession?Are you spending less because of a possible recession?
Are you spending less because of a possible recession?
 

Último

Annual General Meeting Presentation Slides
Annual General Meeting Presentation SlidesAnnual General Meeting Presentation Slides
Annual General Meeting Presentation SlidesKeppelCorporation
 
8447779800, Low rate Call girls in Tughlakabad Delhi NCR
8447779800, Low rate Call girls in Tughlakabad Delhi NCR8447779800, Low rate Call girls in Tughlakabad Delhi NCR
8447779800, Low rate Call girls in Tughlakabad Delhi NCRashishs7044
 
FULL ENJOY Call girls in Paharganj Delhi | 8377087607
FULL ENJOY Call girls in Paharganj Delhi | 8377087607FULL ENJOY Call girls in Paharganj Delhi | 8377087607
FULL ENJOY Call girls in Paharganj Delhi | 8377087607dollysharma2066
 
Kenya’s Coconut Value Chain by Gatsby Africa
Kenya’s Coconut Value Chain by Gatsby AfricaKenya’s Coconut Value Chain by Gatsby Africa
Kenya’s Coconut Value Chain by Gatsby Africaictsugar
 
MAHA Global and IPR: Do Actions Speak Louder Than Words?
MAHA Global and IPR: Do Actions Speak Louder Than Words?MAHA Global and IPR: Do Actions Speak Louder Than Words?
MAHA Global and IPR: Do Actions Speak Louder Than Words?Olivia Kresic
 
Case study on tata clothing brand zudio in detail
Case study on tata clothing brand zudio in detailCase study on tata clothing brand zudio in detail
Case study on tata clothing brand zudio in detailAriel592675
 
Intro to BCG's Carbon Emissions Benchmark_vF.pdf
Intro to BCG's Carbon Emissions Benchmark_vF.pdfIntro to BCG's Carbon Emissions Benchmark_vF.pdf
Intro to BCG's Carbon Emissions Benchmark_vF.pdfpollardmorgan
 
8447779800, Low rate Call girls in New Ashok Nagar Delhi NCR
8447779800, Low rate Call girls in New Ashok Nagar Delhi NCR8447779800, Low rate Call girls in New Ashok Nagar Delhi NCR
8447779800, Low rate Call girls in New Ashok Nagar Delhi NCRashishs7044
 
Memorándum de Entendimiento (MoU) entre Codelco y SQM
Memorándum de Entendimiento (MoU) entre Codelco y SQMMemorándum de Entendimiento (MoU) entre Codelco y SQM
Memorándum de Entendimiento (MoU) entre Codelco y SQMVoces Mineras
 
8447779800, Low rate Call girls in Shivaji Enclave Delhi NCR
8447779800, Low rate Call girls in Shivaji Enclave Delhi NCR8447779800, Low rate Call girls in Shivaji Enclave Delhi NCR
8447779800, Low rate Call girls in Shivaji Enclave Delhi NCRashishs7044
 
Independent Call Girls Andheri Nightlaila 9967584737
Independent Call Girls Andheri Nightlaila 9967584737Independent Call Girls Andheri Nightlaila 9967584737
Independent Call Girls Andheri Nightlaila 9967584737Riya Pathan
 
Flow Your Strategy at Flight Levels Day 2024
Flow Your Strategy at Flight Levels Day 2024Flow Your Strategy at Flight Levels Day 2024
Flow Your Strategy at Flight Levels Day 2024Kirill Klimov
 
Ms Motilal Padampat Sugar Mills vs. State of Uttar Pradesh & Ors. - A Milesto...
Ms Motilal Padampat Sugar Mills vs. State of Uttar Pradesh & Ors. - A Milesto...Ms Motilal Padampat Sugar Mills vs. State of Uttar Pradesh & Ors. - A Milesto...
Ms Motilal Padampat Sugar Mills vs. State of Uttar Pradesh & Ors. - A Milesto...ShrutiBose4
 
8447779800, Low rate Call girls in Kotla Mubarakpur Delhi NCR
8447779800, Low rate Call girls in Kotla Mubarakpur Delhi NCR8447779800, Low rate Call girls in Kotla Mubarakpur Delhi NCR
8447779800, Low rate Call girls in Kotla Mubarakpur Delhi NCRashishs7044
 
Future Of Sample Report 2024 | Redacted Version
Future Of Sample Report 2024 | Redacted VersionFuture Of Sample Report 2024 | Redacted Version
Future Of Sample Report 2024 | Redacted VersionMintel Group
 
International Business Environments and Operations 16th Global Edition test b...
International Business Environments and Operations 16th Global Edition test b...International Business Environments and Operations 16th Global Edition test b...
International Business Environments and Operations 16th Global Edition test b...ssuserf63bd7
 
APRIL2024_UKRAINE_xml_0000000000000 .pdf
APRIL2024_UKRAINE_xml_0000000000000 .pdfAPRIL2024_UKRAINE_xml_0000000000000 .pdf
APRIL2024_UKRAINE_xml_0000000000000 .pdfRbc Rbcua
 

Último (20)

Japan IT Week 2024 Brochure by 47Billion (English)
Japan IT Week 2024 Brochure by 47Billion (English)Japan IT Week 2024 Brochure by 47Billion (English)
Japan IT Week 2024 Brochure by 47Billion (English)
 
Annual General Meeting Presentation Slides
Annual General Meeting Presentation SlidesAnnual General Meeting Presentation Slides
Annual General Meeting Presentation Slides
 
8447779800, Low rate Call girls in Tughlakabad Delhi NCR
8447779800, Low rate Call girls in Tughlakabad Delhi NCR8447779800, Low rate Call girls in Tughlakabad Delhi NCR
8447779800, Low rate Call girls in Tughlakabad Delhi NCR
 
FULL ENJOY Call girls in Paharganj Delhi | 8377087607
FULL ENJOY Call girls in Paharganj Delhi | 8377087607FULL ENJOY Call girls in Paharganj Delhi | 8377087607
FULL ENJOY Call girls in Paharganj Delhi | 8377087607
 
Kenya’s Coconut Value Chain by Gatsby Africa
Kenya’s Coconut Value Chain by Gatsby AfricaKenya’s Coconut Value Chain by Gatsby Africa
Kenya’s Coconut Value Chain by Gatsby Africa
 
MAHA Global and IPR: Do Actions Speak Louder Than Words?
MAHA Global and IPR: Do Actions Speak Louder Than Words?MAHA Global and IPR: Do Actions Speak Louder Than Words?
MAHA Global and IPR: Do Actions Speak Louder Than Words?
 
Case study on tata clothing brand zudio in detail
Case study on tata clothing brand zudio in detailCase study on tata clothing brand zudio in detail
Case study on tata clothing brand zudio in detail
 
Intro to BCG's Carbon Emissions Benchmark_vF.pdf
Intro to BCG's Carbon Emissions Benchmark_vF.pdfIntro to BCG's Carbon Emissions Benchmark_vF.pdf
Intro to BCG's Carbon Emissions Benchmark_vF.pdf
 
8447779800, Low rate Call girls in New Ashok Nagar Delhi NCR
8447779800, Low rate Call girls in New Ashok Nagar Delhi NCR8447779800, Low rate Call girls in New Ashok Nagar Delhi NCR
8447779800, Low rate Call girls in New Ashok Nagar Delhi NCR
 
Memorándum de Entendimiento (MoU) entre Codelco y SQM
Memorándum de Entendimiento (MoU) entre Codelco y SQMMemorándum de Entendimiento (MoU) entre Codelco y SQM
Memorándum de Entendimiento (MoU) entre Codelco y SQM
 
8447779800, Low rate Call girls in Shivaji Enclave Delhi NCR
8447779800, Low rate Call girls in Shivaji Enclave Delhi NCR8447779800, Low rate Call girls in Shivaji Enclave Delhi NCR
8447779800, Low rate Call girls in Shivaji Enclave Delhi NCR
 
Independent Call Girls Andheri Nightlaila 9967584737
Independent Call Girls Andheri Nightlaila 9967584737Independent Call Girls Andheri Nightlaila 9967584737
Independent Call Girls Andheri Nightlaila 9967584737
 
Call Us ➥9319373153▻Call Girls In North Goa
Call Us ➥9319373153▻Call Girls In North GoaCall Us ➥9319373153▻Call Girls In North Goa
Call Us ➥9319373153▻Call Girls In North Goa
 
Flow Your Strategy at Flight Levels Day 2024
Flow Your Strategy at Flight Levels Day 2024Flow Your Strategy at Flight Levels Day 2024
Flow Your Strategy at Flight Levels Day 2024
 
Enjoy ➥8448380779▻ Call Girls In Sector 18 Noida Escorts Delhi NCR
Enjoy ➥8448380779▻ Call Girls In Sector 18 Noida Escorts Delhi NCREnjoy ➥8448380779▻ Call Girls In Sector 18 Noida Escorts Delhi NCR
Enjoy ➥8448380779▻ Call Girls In Sector 18 Noida Escorts Delhi NCR
 
Ms Motilal Padampat Sugar Mills vs. State of Uttar Pradesh & Ors. - A Milesto...
Ms Motilal Padampat Sugar Mills vs. State of Uttar Pradesh & Ors. - A Milesto...Ms Motilal Padampat Sugar Mills vs. State of Uttar Pradesh & Ors. - A Milesto...
Ms Motilal Padampat Sugar Mills vs. State of Uttar Pradesh & Ors. - A Milesto...
 
8447779800, Low rate Call girls in Kotla Mubarakpur Delhi NCR
8447779800, Low rate Call girls in Kotla Mubarakpur Delhi NCR8447779800, Low rate Call girls in Kotla Mubarakpur Delhi NCR
8447779800, Low rate Call girls in Kotla Mubarakpur Delhi NCR
 
Future Of Sample Report 2024 | Redacted Version
Future Of Sample Report 2024 | Redacted VersionFuture Of Sample Report 2024 | Redacted Version
Future Of Sample Report 2024 | Redacted Version
 
International Business Environments and Operations 16th Global Edition test b...
International Business Environments and Operations 16th Global Edition test b...International Business Environments and Operations 16th Global Edition test b...
International Business Environments and Operations 16th Global Edition test b...
 
APRIL2024_UKRAINE_xml_0000000000000 .pdf
APRIL2024_UKRAINE_xml_0000000000000 .pdfAPRIL2024_UKRAINE_xml_0000000000000 .pdf
APRIL2024_UKRAINE_xml_0000000000000 .pdf
 

Understand the long-term cost of being out of the market

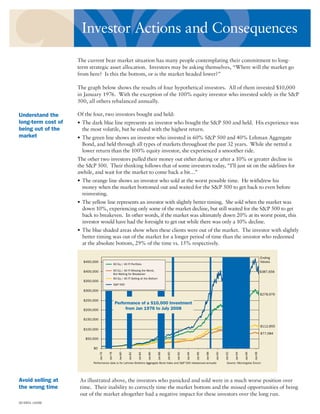
  • 1. Investor Actions and Consequences The current bear market situation has many people contemplating their commitment to long- term strategic asset allocation. Investors may be asking themselves, “Where will the market go from here? Is this the bottom, or is the market headed lower?” The graph below shows the results of four hypothetical investors. All of them invested $10,000 in January 1976. With the exception of the 100% equity investor who invested solely in the S&P 500, all others rebalanced annually. Of the four, two investors bought and held: Understand the long-term cost of • The dark blue line represents an investor who bought the S&P 500 and held. His experience was being out of the the most volatile, but he ended with the highest return. market • The green line shows an investor who invested in 60% S&P 500 and 40% Lehman Aggregate Bond, and held through all types of markets throughout the past 32 years. While she netted a lower return than the 100% equity investor, she experienced a smoother ride. The other two investors pulled their money out either during or after a 10% or greater decline in the S&P 500. Their thinking follows that of some investors today, “I’ll just sit on the sidelines for awhile, and wait for the market to come back a bit…” • The orange line shows an investor who sold at the worst possible time. He withdrew his money when the market bottomed out and waited for the S&P 500 to get back to even before reinvesting. • The yellow line represents an investor with slightly better timing. She sold when the market was down 10%, experiencing only some of the market decline, but still waited for the S&P 500 to get back to breakeven. In other words, if the market was ultimately down 20% at its worst point, this investor would have had the foresight to get out while there was only a 10% decline. • The blue shaded areas show when these clients were out of the market. The investor with slightly better timing was out of the market for a longer period of time than the investor who redeemed at the absolute bottom, 29% of the time vs. 15% respectively. Ending Values $450,000 60 Eq / 40 Fl Portfolio 60 Eq / 40 Fl Missing the Worst, $400,000 $387,656 But Waiting for Breakeven 60 Eq / 40 Fl Selling at the Bottom $350,000 S&P 500 $300,000 $278,976 $250,000 Performance of a $10,000 Investment from Jan 1976 to July 2008 $200,000 $150,000 $112,855 $100,000 $77,084 $50,000 $0 Jan-76 Jan-78 Jan-80 Jan-82 Jan-84 Jan-86 Jan-88 Jan-90 Jan-92 Jan-94 Jan-96 Jan-98 Jan-00 Jan-02 Jan-04 Jan-06 Jan-08 Performance data is for Lehman Brothers Aggregate Bond Index and S&P 500 rebalanced annually Source: Morningstar Encorr Avoid selling at As illustrated above, the investors who panicked and sold were in a much worse position over the wrong time time. Their inability to correctly time the market bottom and the missed opportunities of being out of the market altogether had a negative impact for these investors over the long run. 92-0601 (1008)
  • 2. Outcomes for 60% Equity / 40% Fixed Income Investors % Shortfall vs. Stay the Investor Ending Balance Dollar Shortfall Course Investor Staying the Course $278,976 --- --- Losing Only 10% $112,855 - 59.5% - $166,121 Getting Out at the Worst Time $77,084 - 72.4% - $201,892 Below is a chart that illustrates the length and severity of S&P 500 declines of 10% or greater. You’ll notice that although some of the declines have been severe, the market and the economy have come back to reach new highs. S&P 500 Declines of 10% or Greater Peak Date Trough Date Recovery Date Decline (%) Decline Duration Recovery Duration Aug-29 Jun-32 Jan-45 - 83.41 34 151 May-46 Nov-46 Oct-49 - 21.76 6 35 Jul-56 Feb-57 Jul-57 - 10.24 7 5 Jul-57 Dec-57 Jul-58 - 14.95 5 7 Dec-61 Jun-62 Apr-63 - 22.28 6 10 Jan-66 Sep-66 Mar-67 - 15.64 8 6 Nov-68 Jun-70 Mar-71 - 29.25 19 9 Dec-72 Sep-74 Jun-76 - 42.63 21 21 Dec-76 Feb-78 Jul-78 - 14.13 14 5 Nov-80 Jul-82 Oct-82 - 16.91 20 3 Aug-87 Nov-87 May-89 - 29.53 3 18 May-90 Oct-90 Feb-91 - 14.7 5 4 Jun-98 Aug-98 Nov-98 - 15.37 2 3 Aug-00 Sep-02 Oct-06 - 44.73 25 49 Oct-07 ??? ??? - 16.89 9 ??? Let logic prevail The result of this analysis is clear. Investors who attempt to avoid losses, or otherwise “time” the market, did more harm to themselves than good when compared to the investor who “stayed the over fear course.” Investors who sold out after significant drops experienced the worst returns by far. Attempting to pick market tops or bottoms can result in increased transaction costs, lost opportunities, and the potential for investing or withdrawing at the worst time. Some investors who attempt to time the market may think, “Well I won’t wait for the market to break even before reinvesting.” That may sound logical, but when is the right time to reinvest? What if you invest the money too soon and the market heads lower and continues to acheive new lows? Do you sell again? What if the market has several good days and you miss your planned entry point? Although it may be painful or seem like the wrong thing to do, staying invested in a well diversified, strategically allocated portfolio helps investors fare better in both good and bad markets. The Northwestern Mutual Past performance is no guarantee of future results. This is for illustrative purposes only and not indicative of any investment. An investment cannot be made directly in an Life Insurance Company • Milwaukee, WI index. Returns and principal invested in stocks are not guaranteed. Holding a portfolio www.nmfn.com of securities for the long-term does not insure a profitable outcome and investing in securities always involves risk of loss. 92-0601 (1008) Source: Stocks are represented by the Standard & Poor’s 500®, which is an unmanaged group of securities and considered to be representative of the stock market in general. The Northwestern Mutual Financial Network is a marketing name for the sales and distribution arm of The Northwestern Mutual Life Insurance Company, its affiliates and subsidiaries. Securities offered through Northwestern Mutual Investment Services, LLC (NMIS), member FINRA and SIPC. 1-866-664-7737. NMIS is a wholly owned company of Northwestern Mutual. Northwestern Mutual is not a broker-dealer.