SlideShare una empresa de Scribd logo
1 de 16
Descargar para leer sin conexión
April 2014 Monthly Snapshot
One-Year Change in One-Year Change in
Median Sales Price
Single Family
Median Sales Price
Condo/TIC/Coop
2
3
4
5
6
7
8
9
10
11
12
13
14
15
16
Monthly Indicators
+ 10.0% + 6.8% + 8.5%
One-Year Change in
The median sales price of single family homes in San Francisco soared past the
$1 million mark in April to its highest point in the last 12 months. Despite the
sounds of construction giving way to new housing units in ever-growing
pockets of the city, supply remains tight, leaving sellers to fight for the few
listings that come on the market.
New Listings were down 29.1 percent for single family homes and 23.7 percent
for Condo/TIC/Coop properties. Pending Sales decreased 14.5 percent for
single family homes and 8.7 percent for Condo/TIC/Coop properties.
The Median Sales Price was up 10.0 percent to $1,100,000 for single family
homes and 6.8 percent to $902,500 for Condo/TIC/Coop properties. Months
Supply of Inventory decreased 38.1 percent for single family units and 40.0
percent for Condo/TIC/Coop units.
Median Sales Price
All Property Types
Residential real estate activity in San Francisco County (Districts 1-10),
comprised of single-family properties, townhomes and condominiums.
Percent changes are calculated using rounded figures.
Single Family Activity Overview
Months Supply of Inventory
Current as of May 12, 2014. All data from the San Francisco MLS. Powered by 10K Research and Marketing.
Condo/TIC/Coop Activity Overview
Inventory of Active Listings
% of Properties Sold Over List Price
% of List Price Received
Housing Affordability Ratio
All Properties Activity Overview
New Listings
Pending Sales
Sold Listings
Median Sales Price
Average Sales Price
Days on Market Until Sale
Activity by District
Single Family Activity Overview
Key metrics by report month and for year-to-date (YTD) starting from the first of the year.
Key Metrics Historical Sparkbars 4-2013 4-2014 Percent Change YTD 2013 YTD 2014 Percent Change
Current as of May 12, 2014. All data from the San Francisco MLS. Powered by 10K Research and Marketing. | Click for Cover Page | 2
Months Supply 2.1 1.3 - 38.1% -- -- --
Affordability Ratio 50 40 - 20.0%
% of List Price Received 111.7% 115.1% + 3.0% 109.3%
58
77.1% + 4.9%
+ 2.2%
44 - 24.1%
111.7%
% of Properties Sold Over List Price 79.7% 85.5% + 7.3% 73.5%
Active Listings 444 285 - 35.8% --
Average Sales Price $1,362,627 $1,500,863 + 10.1% $1,226,933
Days on Market 35 35 0.0% 40 36 - 10.0%
$1,424,726
-- --
Median Sales Price $1,000,000 $1,100,000 + 10.0% $865,000
Sold Listings 222 207 - 6.8% 719
New Listings 302 214 - 29.1% 971
Pending Sales 242 207 - 14.5% - 3.6%756 729
- 13.1%844
669 - 7.0%
$1,010,000 + 16.8%
+ 16.1%
4-2011 4-2012 4-2013 4-2014
4-2011 4-2012 4-2013 4-2014
4-2011 4-2012 4-2013 4-2014
4-2011 4-2012 4-2013 4-2014
4-2011 4-2012 4-2013 4-2014
4-2011 4-2012 4-2013 4-2014
4-2011 4-2012 4-2013 4-2014
4-2011 4-2012 4-2013 4-2014
4-2011 4-2012 4-2013 4-2014
4-2011 4-2012 4-2013 4-2014
4-2011 4-2012 4-2013 4-2014
Condo/TIC/Coop Activity Overview
Key metrics by report month and for year-to-date (YTD) starting from the first of the year.
Key Metrics Historical Sparkbars 4-2013 4-2014 Percent Change YTD 2013 YTD 2014 Percent Change
Current as of May 12, 2014. All data from the San Francisco MLS. Powered by 10K Research and Marketing. | Click for Cover Page | 3
Months Supply 2.5 1.5 - 40.0% -- -- --
Affordability Ratio 68 56 - 17.6%
% of List Price Received 105.7% 108.8% + 2.9% 104.3%
71
66.5% + 12.9%
+ 2.6%
54 - 23.9%
107.0%
% of Properties Sold Over List Price 67.3% 72.5% + 7.7% 58.9%
Active Listings 661 428 - 35.2% --
Average Sales Price $975,623 $1,121,688 + 15.0% $924,186
Days on Market 41 32 - 22.0% 47
$935,000 + 16.1%
+ 16.5%
38 - 19.1%
$1,076,944
-- --
Sold Listings 303 306 + 1.0% 936 970 + 3.6%
Median Sales Price $845,250 $902,500 + 6.8% $805,000
- 11.9%
Pending Sales 309 282 - 8.7% 1,002 1,007 + 0.5%
New Listings 396 302 - 23.7% 1,392 1,226
4-2011 4-2012 4-2013 4-2014
4-2011 4-2012 4-2013 4-2014
4-2011 4-2012 4-2013 4-2014
4-2011 4-2012 4-2013 4-2014
4-2011 4-2012 4-2013 4-2014
4-2011 4-2012 4-2013 4-2014
4-2011 4-2012 4-2013 4-2014
4-2011 4-2012 4-2013 4-2014
4-2011 4-2012 4-2013 4-2014
4-2011 4-2012 4-2013 4-2014
4-2011 4-2012 4-2013 4-2014
New Listings
New Listings
Single
Family
Year-Over-Year
Change
Condo/TIC/
Coop
Year-Over-Year
Change
May-2013 339 +30.9% 384 +2.7%
Jun-2013 293 +13.1% 358 +7.2%
Jul-2013 259 +1.6% 332 +23.4%
Aug-2013 272 +7.1% 341 +8.9%
Sep-2013 296 -6.6% 448 +15.8%
Oct-2013 277 -3.5% 321 +5.2%
Nov-2013 171 -5.5% 191 -9.5%
Dec-2013 112 +9.8% 116 +1.8%
Jan-2014 207 +1.5% 336 +8.4%
Feb-2014 194 -8.1% 300 -5.1%
Mar-2014 229 -9.8% 288 -22.2%
Apr-2014 214 -29.1% 302 -23.7%
12-Month Avg 239 -0.8% 310 +0.5%
Historical New Listings by Month
Current as of May 12, 2014. All data from the San Francisco MLS. Powered by 10K Research and Marketing. | Click for Cover Page | 4
A count of the properties that have been newly listed on the market in a given month.
262
344
302
396
214
302
Single Family Condo/TIC/Coop
April
0
100
200
300
400
500
600
700
1-2005 1-2006 1-2007 1-2008 1-2009 1-2010 1-2011 1-2012 1-2013 1-2014
Single Family Condo/TIC/Coop
1,058
1,283
971
1,392
844
1,226
Single Family Condo/TIC/Coop
Year to Date
2012 2013 2014
- 23.7%+ 15.1%- 29.1%+ 15.3% + 8.5%- 13.1%- 8.2% - 11.9%
2012 2013 2014 2012 2013 2014 2012 2013 2014
- 10.3% - 11.5% - 19.8%- 19.6%
Pending Sales
Pending Sales
Single
Family
Year-Over-Year
Change
Condo/TIC/
Coop
Year-Over-Year
Change
May-2013 269 +10.2% 360 +13.9%
Jun-2013 278 +17.3% 290 -7.6%
Jul-2013 250 +10.6% 332 +16.1%
Aug-2013 230 +1.8% 302 +4.5%
Sep-2013 210 +14.8% 254 +16.5%
Oct-2013 245 -14.6% 340 +22.7%
Nov-2013 224 -10.8% 270 -0.4%
Dec-2013 171 +0.6% 201 -1.0%
Jan-2014 135 -14.6% 183 +5.2%
Feb-2014 166 +11.4% 252 +16.1%
Mar-2014 221 +6.8% 290 -4.0%
Apr-2014 207 -14.5% 282 -8.7%
12-Month Avg 217 +1.0% 280 +5.7%
Historical Pending Sales by Month
A count of the properties on which offers have been accepted in a given month.
Current as of May 12, 2014. All data from the San Francisco MLS. Powered by 10K Research and Marketing. | Click for Cover Page | 5
235
320
242
309
207
282
Single Family Condo/TIC/Coop
April
0
100
200
300
400
1-2005 1-2006 1-2007 1-2008 1-2009 1-2010 1-2011 1-2012 1-2013 1-2014
Single Family Condo/TIC/Coop
825
980
756
1,002
729
1,007
Single Family Condo/TIC/Coop
Year to Date
2012 2013 2014
- 8.7%- 3.4%- 14.5%+ 3.0% + 2.2%- 3.6%- 8.4% + 0.5%
2012 2013 2014 2012 2013 2014 2012 2013 2014
+ 22.4% + 10.6% + 15.3%+ 39.7%
Sold Listings
Sold Listings
Single
Family
Year-Over-Year
Change
Condo/TIC/
Coop
Year-Over-Year
Change
May-2013 252 +6.8% 380 +27.1%
Jun-2013 272 +1.5% 277 -18.5%
Jul-2013 278 +28.1% 341 +23.1%
Aug-2013 238 -1.7% 303 -6.2%
Sep-2013 188 +5.0% 229 +0.4%
Oct-2013 256 +0.4% 335 +21.8%
Nov-2013 240 -11.8% 283 +4.8%
Dec-2013 215 +2.9% 246 -2.0%
Jan-2014 131 -18.6% 178 +14.1%
Feb-2014 157 +21.7% 221 +13.3%
Mar-2014 174 -15.9% 265 -6.0%
Apr-2014 207 -6.8% 306 +1.0%
12-Month Avg 217 +0.4% 280 +5.2%
Historical Sold Listings by Month
A count of the actual sales that closed in a given month.
Current as of May 12, 2014. All data from the San Francisco MLS. Powered by 10K Research and Marketing. | Click for Cover Page | 6
221
295
222
303
207
306
Single Family Condo/TIC/Coop
April
0
100
200
300
400
1-2005 1-2006 1-2007 1-2008 1-2009 1-2010 1-2011 1-2012 1-2013 1-2014
Single Family Condo/TIC/Coop
756
903
719
936
669
970
Single Family Condo/TIC/Coop
Year to Date
2012 2013 2014
+ 1.0%+ 2.7%- 6.8%+ 0.5% + 3.7%- 7.0%- 4.9% + 3.6%
2012 2013 2014 2012 2013 2014 2012 2013 2014
+ 11.6% + 8.3% + 10.1%+ 21.4%
Median Sales Price
Median Sales Price
Single
Family
Year-Over-Year
Change
Condo/TIC/
Coop
Year-Over-Year
Change
May-2013 $1,017,500 +30.8% $830,000 +18.6%
Jun-2013 $939,000 +20.4% $780,000 +9.5%
Jul-2013 $872,500 +13.6% $850,000 +23.2%
Aug-2013 $934,000 +22.5% $810,000 +11.7%
Sep-2013 $929,000 +28.1% $826,000 +6.4%
Oct-2013 $905,000 +9.0% $865,000 +13.8%
Nov-2013 $957,000 +18.1% $826,000 +6.6%
Dec-2013 $945,000 +13.2% $762,500 +9.1%
Jan-2014 $925,000 +24.2% $950,000 +24.6%
Feb-2014 $1,050,000 +31.2% $939,000 +25.2%
Mar-2014 $990,000 +7.6% $970,000 +17.9%
Apr-2014 $1,100,000 +10.0% $902,500 +6.8%
12-Month Avg* $950,000 +17.3% $850,000 +12.6%
Historical Median Sales Price by Month
Point at which half of the sales sold for more and half sold for less, not accounting for seller concessions, in a given month.
* Median Sales Price for all properties from May 2013 through April 2014. This is not the average
of the individual figures above.
Current as of May 12, 2014. All data from the San Francisco MLS. Powered by 10K Research and Marketing. | Click for Cover Page | 7
$760,000
$705,000
$1,000,000
$845,250
$1,100,000
$902,500
Single Family Condo/TIC/Coop
April
$500,000
$600,000
$700,000
$800,000
$900,000
$1,000,000
$1,100,000
$1,200,000
1-2005 1-2006 1-2007 1-2008 1-2009 1-2010 1-2011 1-2012 1-2013 1-2014
Single Family Condo/TIC/Coop
$690,000
$650,000
$865,000
$805,000
$1,010,000
$935,000
Single Family Condo/TIC/Coop
Year to Date
2012 2013 2014
+ 6.8%+ 19.9%+ 10.0%+ 31.6% + 23.8%+ 16.8%+ 25.4% + 16.1%
2012 2013 2014 2012 2013 2014 2012 2013 2014
+ 8.5% + 2.2% + 3.3%+ 6.8%
Average Sales Price
Average Sales
Price
Single
Family
Year-Over-Year
Change
Condo/TIC/
Coop
Year-Over-Year
Change
May-2013 $1,489,882 +32.2% $980,113 +21.3%
Jun-2013 $1,195,239 +3.0% $930,338 +12.9%
Jul-2013 $1,281,445 +8.5% $1,018,542 +30.8%
Aug-2013 $1,301,708 +31.8% $929,734 +15.4%
Sep-2013 $1,235,064 +31.9% $941,430 +4.8%
Oct-2013 $1,347,949 +4.0% $1,009,812 +13.6%
Nov-2013 $1,323,997 +18.8% $980,320 +1.0%
Dec-2013 $1,342,251 -3.1% $1,020,083 +19.3%
Jan-2014 $1,244,233 +36.7% $1,120,141 +34.5%
Feb-2014 $1,462,472 +25.4% $996,871 +13.9%
Mar-2014 $1,435,981 +5.2% $1,063,203 +11.5%
Apr-2014 $1,500,863 +10.1% $1,121,688 +15.0%
12-Month Avg* $1,343,310 +14.6% $1,006,537 +15.5%
Historical Average Sales Price by Month
Average sales price for all closed sales, not accounting for seller concessions, in a given month.
* Average Sales Price for all properties from May 2013 through April 2014. This is not the average
of the individual figures above.
Current as of May 12, 2014. All data from the San Francisco MLS. Powered by 10K Research and Marketing. | Click for Cover Page | 8
$1,058,803
$760,266
$1,362,627
$975,623
$1,500,863
$1,121,688
Single Family Condo/TIC/Coop
April
$600,000
$800,000
$1,000,000
$1,200,000
$1,400,000
$1,600,000
1-2005 1-2006 1-2007 1-2008 1-2009 1-2010 1-2011 1-2012 1-2013 1-2014
Single Family Condo/TIC/Coop
$985,585
$741,143
$1,226,933
$924,186
$1,424,726
$1,076,944
Single Family Condo/TIC/Coop
Year to Date
2012 2013 2014
+ 15.0%+ 28.3%+ 10.1%+ 28.7% + 24.7%+ 16.1%+ 24.5% + 16.5%
2012 2013 2014 2012 2013 2014 2012 2013 2014
+ 5.0% + 5.1% + 0.9%- 3.5%
Days on Market Until Sale
Days on Market
Single
Family
Year-Over-Year
Change
Condo/TIC/
Coop
Year-Over-Year
Change
May-2013 32 -31.9% 36 -36.8%
Jun-2013 35 -40.7% 38 -33.3%
Jul-2013 33 -29.8% 39 -35.0%
Aug-2013 38 -24.0% 38 -29.6%
Sep-2013 31 -32.6% 37 -28.8%
Oct-2013 34 -24.4% 37 -32.7%
Nov-2013 34 -19.0% 41 -19.6%
Dec-2013 42 -12.5% 44 -27.9%
Jan-2014 40 -18.4% 51 -19.0%
Feb-2014 38 -7.3% 39 -20.4%
Mar-2014 32 -17.9% 33 -21.4%
Apr-2014 35 0.0% 32 -22.0%
12-Month Avg* 35 -23.6% 38 -27.7%
Historical Days on Market Until Sale by Month
Average number of days between when a property is listed and when an offer is accepted in a given month.
* Days on Market for all properties from May 2013 through April 2014. This is not the average of
the individual figures above.
Current as of May 12, 2014. All data from the San Francisco MLS. Powered by 10K Research and Marketing. | Click for Cover Page | 9
54
70
35
41
35
32
Single Family Condo/TIC/Coop
April
20
40
60
80
100
120
1-2005 1-2006 1-2007 1-2008 1-2009 1-2010 1-2011 1-2012 1-2013 1-2014
Single Family Condo/TIC/Coop
64
79
40
47
36 38
Single Family Condo/TIC/Coop
Year to Date
2012 2013 2014
- 22.0%- 41.4%0.0%- 35.2% - 40.5%- 10.0%- 37.5% - 19.1%
2012 2013 2014 2012 2013 2014 2012 2013 2014
- 19.4% - 8.6% - 2.5%- 1.4%
Inventory of Active Listings
Active Listings
Single
Family
Year-Over-Year
Change
Condo/TIC/
Coop
Year-Over-Year
Change
May-2013 484 -12.3% 641 -15.2%
Jun-2013 467 -10.7% 655 -9.3%
Jul-2013 454 -10.6% 611 -8.9%
Aug-2013 464 -7.8% 588 -6.8%
Sep-2013 500 -16.5% 717 -4.7%
Oct-2013 489 -10.4% 636 -11.2%
Nov-2013 388 -12.4% 500 -16.9%
Dec-2013 266 -16.1% 327 -20.2%
Jan-2014 311 -7.7% 452 -9.8%
Feb-2014 317 -16.6% 475 -17.5%
Mar-2014 306 -24.4% 439 -28.6%
Apr-2014 285 -35.8% 428 -35.2%
12-Month Avg* 394 -14.9% 539 -15.0%
Historical Inventory of Active Listings by Month
The number of properties available for sale in active status at the end of a given month.
* Active Listings for all properties from May 2013 through April 2014. This is not the average of
the individual figures above.
Current as of May 12, 2014. All data from the San Francisco MLS. Powered by 10K Research and Marketing. | Click for Cover Page | 10
582
744
444
661
285
428
Single Family Condo/TIC/Coop
April
200
400
600
800
1,000
1,200
1,400
1,600
1-2005 1-2006 1-2007 1-2008 1-2009 1-2010 1-2011 1-2012 1-2013 1-2014
Single Family Condo/TIC/Coop
2012 2013 2014
- 35.2%- 11.2%- 35.8%- 23.7%
2012 2013 2014
- 25.8% - 37.7%
% of Properties Sold Over List Price
% of Properties
Sold Over List Price
Single
Family
Year-Over-Year
Change
Condo/TIC/
Coop
Year-Over-Year
Change
May-2013 77.8% +33.0% 67.6% +41.4%
Jun-2013 80.1% +24.0% 71.8% +49.0%
Jul-2013 78.1% +23.8% 73.3% +72.1%
Aug-2013 75.2% +13.8% 66.0% +45.1%
Sep-2013 78.7% +14.6% 68.6% +29.2%
Oct-2013 80.8% +23.4% 67.8% +11.7%
Nov-2013 77.5% +16.5% 62.5% +14.9%
Dec-2013 65.1% +5.5% 54.1% +17.1%
Jan-2014 64.9% +1.4% 43.5% +9.6%
Feb-2014 75.8% +4.3% 69.2% +26.0%
Mar-2014 77.6% +3.6% 72.5% +14.9%
Apr-2014 85.5% +7.3% 72.5% +7.7%
12-Month Avg 76.9% +15.1% 66.7% +27.5%
Historical % of Properties Sold Over List Price by Month
Percentage found when dividing the number of properties sold by properties sold over its original list price, not accounting for seller
concessions.
* % of Properties Sold Over List Price for all properties from May 2013 through April 2014. This is
not the average of the individual figures above.
Current as of May 12, 2014. All data from the San Francisco MLS. Powered by 10K Research and Marketing. | Click for Cover Page | 11
61.5%
38.0%
79.7%
67.3%
85.5%
72.5%
Single Family Condo/TIC/Coop
April
0.0%
20.0%
40.0%
60.0%
80.0%
100.0%
1-2005 1-2006 1-2007 1-2008 1-2009 1-2010 1-2011 1-2012 1-2013 1-2014
Single Family Condo/TIC/Coop
46.9%
35.3%
73.5%
58.9%
77.1%
66.5%
Single Family Condo/TIC/Coop
Year to Date
2012 2013 2014
+ 7.7%+ 77.1%+ 7.3%+ 29.6% + 66.9%+ 4.9%+ 56.7% + 12.9%
2012 2013 2014 2012 2013 2014 2012 2013 2014
+ 43.4% + 25.4% + 59.0%+ 77.6%
% of List Price Received
% of List Price
Received
Single
Family
Year-Over-Year
Change
Condo/TIC/
Coop
Year-Over-Year
Change
May-2013 111.3% +6.1% 105.9% +3.9%
Jun-2013 112.4% +7.3% 107.0% +5.5%
Jul-2013 109.6% +3.9% 106.8% +5.1%
Aug-2013 110.1% +4.1% 105.5% +3.4%
Sep-2013 109.8% +2.7% 105.8% +3.5%
Oct-2013 110.2% +4.8% 105.5% +1.8%
Nov-2013 108.7% +2.2% 105.0% +2.4%
Dec-2013 106.9% +2.2% 103.4% +1.8%
Jan-2014 107.6% +1.4% 103.0% +1.7%
Feb-2014 110.2% +1.7% 106.2% +2.3%
Mar-2014 112.0% +1.9% 108.5% +3.4%
Apr-2014 115.1% +3.0% 108.8% +2.9%
12-Month Avg* 110.4% +3.6% 106.1% +3.2%
Historical % of List Price Received by Month
Percentage found when dividing a property’s sales price by its most recent list price, then taking the average for all properties sold in a given
month, not accounting for seller concessions.
* % of List Price Received for all properties from May 2013 through April 2014. This is not the
average of the individual figures above.
Current as of May 12, 2014. All data from the San Francisco MLS. Powered by 10K Research and Marketing. | Click for Cover Page | 12
103.6% 100.8%
111.7%
105.7%
115.1%
108.8%
Single Family Condo/TIC/Coop
April
101.6% 100.1%
109.3%
104.3%
111.7%
107.0%
Single Family Condo/TIC/Coop
Year to Date
95.0%
100.0%
105.0%
110.0%
115.0%
120.0%
1-2005 1-2006 1-2007 1-2008 1-2009 1-2010 1-2011 1-2012 1-2013 1-2014
Single Family Condo/TIC/Coop
2012 2013 2014
+ 2.9%+ 4.9%+ 3.0%+ 7.8%
2012 2013 2014
+ 3.5% + 2.4%
2012 2013 2014
+ 2.6%+ 4.2%+ 2.2%+ 7.6%
2012 2013 2014
+ 2.1% + 2.1%
Housing Affordability Ratio
Affordability Ratio
Single
Family
Year-Over-Year
Change
Condo/TIC/
Coop
Year-Over-Year
Change
May-2013 47 -25.4% 67 -15.2%
Jun-2013 48 -23.8% 66 -16.5%
Jul-2013 52 -20.0% 61 -25.6%
Aug-2013 48 -26.2% 63 -19.2%
Sep-2013 49 -30.0% 63 -16.0%
Oct-2013 51 -15.0% 61 -19.7%
Nov-2013 51 -17.7% 67 -10.7%
Dec-2013 49 -19.7% 69 -16.9%
Jan-2014 47 -29.9% 53 -30.3%
Feb-2014 42 -31.1% 54 -28.0%
Mar-2014 45 -15.1% 53 -23.2%
Apr-2014 40 -20.0% 56 -17.6%
12-Month Avg* 48 -35.2% 62 -26.4%
Historical Housing Affordability Ratio by Month
This index measures housing affordability for the region. An index of 120 means the median household income is 120% of what is necessary to
qualify for the median-priced home under prevailing interest rates. A higher number means greater affordability.
* Affordability Ratio for all properties from May 2013 through April 2014. This is not the average of
the individual figures above.
Current as of May 12, 2014. All data from the San Francisco MLS. Powered by 10K Research and Marketing. | Click for Cover Page | 13
63
78
50
68
40
56
Single Family Condo/TIC/Coop
April
30
40
50
60
70
80
90
100
1-2005 1-2006 1-2007 1-2008 1-2009 1-2010 1-2011 1-2012 1-2013 1-2014
Single Family Condo/TIC/Coop
2012 2013 2014
- 17.6%- 12.8%- 20.0%- 20.6%
2012 2013 2014
0.0% + 5.4%
70
84
58
71
44
54
Single Family Condo/TIC/Coop
Year to Date
2012 2013 2014
- 23.9%- 15.5%- 24.1%- 17.1%
2012 2013 2014
+ 7.7% + 7.7%
Months Supply of Inventory
Months Supply
Single
Family
Year-Over-Year
Change
Condo/TIC/
Coop
Year-Over-Year
Change
May-2013 2.2 -15.4% 2.4 -27.3%
Jun-2013 2.1 -16.0% 2.5 -19.4%
Jul-2013 2.0 -16.7% 2.3 -17.9%
Aug-2013 2.1 -8.7% 2.2 -15.4%
Sep-2013 2.2 -21.4% 2.6 -13.3%
Oct-2013 2.2 -12.0% 2.3 -17.9%
Nov-2013 1.8 -10.0% 1.8 -21.7%
Dec-2013 1.2 -14.3% 1.2 -25.0%
Jan-2014 1.4 -6.7% 1.6 -15.8%
Feb-2014 1.4 -22.2% 1.7 -22.7%
Mar-2014 1.4 -26.3% 1.6 -30.4%
Apr-2014 1.3 -38.1% 1.5 -40.0%
12-Month Avg* 1.8 -16.7% 2.0 -22.3%
Historical Months Supply of Inventory by Month
The inventory of homes for sale at the end of a given month, divided by the average monthly pending sales from the last 12 months.
* Months Supply for all properties from May 2013 through April 2014. This is not the average of
the individual figures above.
Current as of May 12, 2014. All data from the San Francisco MLS. Powered by 10K Research and Marketing. | Click for Cover Page | 14
2.7
3.3
2.1
2.5
1.3
1.5
Single Family Condo/TIC/Coop
April
0.0
2.0
4.0
6.0
8.0
10.0
1-2005 1-2006 1-2007 1-2008 1-2009 1-2010 1-2011 1-2012 1-2013 1-2014
Single Family Condo/TIC/Coop
2012 2013 2014
- 40.0%- 24.2%- 38.1%- 22.2%
2012 2013 2014
- 32.5% - 44.1%
All Properties Activity Overview
Key metrics by report month and for year-to-date (YTD) starting from the first of the year.
Key Metrics Historical Sparkbars 4-2013 4-2014 Percent Change YTD 2013 YTD 2014 Percent Change
Current as of May 12, 2014. All data from the San Francisco MLS. Powered by 10K Research and Marketing. | Click for Cover Page | 15
Months Supply 2.3 1.4 - 39.1% -- -- --
Affordability Ratio 51 40 - 21.4%
% of List Price Received 108.2% 111.3% + 2.9% 106.5%
55
70.8% + 8.6%
+ 2.3%
42 - 23.7%
108.9%
% of Properties Sold Over List Price 72.6% 77.8% + 7.2% 65.2%
Active Listings 1,105 713 - 35.5% --
Average Sales Price $1,139,271 $1,274,688 + 11.9% $1,055,608
Days on Market 38 33 - 13.2% 44
$963,750 + 16.5%
+ 15.5%
37 - 15.9%
$1,218,987
-- --
Sold Listings 525 513 - 2.3% 1,655 1,639 - 1.0%
Median Sales Price $899,000 $975,000 + 8.5% $827,000
- 12.4%
Pending Sales 551 489 - 11.3% 1,758 1,736 - 1.3%
New Listings 698 516 - 26.1% 2,363 2,070
4-2011 4-2012 4-2013 4-2014
4-2011 4-2012 4-2013 4-2014
4-2011 4-2012 4-2013 4-2014
4-2011 4-2012 4-2013 4-2014
4-2011 4-2012 4-2013 4-2014
4-2011 4-2012 4-2013 4-2014
4-2011 4-2012 4-2013 4-2014
4-2011 4-2012 4-2013 4-2014
4-2011 4-2012 4-2013 4-2014
4-2011 4-2012 4-2013 4-2014
4-2011 4-2012 4-2013 4-2014
Activity by District
SF District 1: Northwest (Sea Cliff, Lake, Jordan Park / Laurel Heights, Outer Richmond, Central Richmond, Inner Richmond, Lone Mountain)
SF District 2: Central West (Outer Sunset, Central Sunset, Inner Sunset, Outer Parkside, Parkside, Inner Parkside, Golden Gate Heights)
SF District 3: Southwest (Pine Lake Park, Lake Shore, Merced Manor, Stonestown, Lakeside, Merced Heights, Ingleside, Ingleside Heights, Oceanview)
SF District 4: Twin Peaks W (Forest Hill (& Ext), W Portal, St Francis Wd, Balboa Terr, Mt Dav Manor, Ingleside Terr, Monterey Hts, Wstwd Pk & H'lnds, Shrwd Fst, Miraloma Pk, Dmnd Hts, Mdtwn Terr)
SF District 5: Central (Haight Ashbury, Cole Vly / Prnssus Hts, Clarndn Hts, Corona Hts, Twin Pks, Glen Pk, Noe Vly, Eureka Vly / Dolores Hts, Mission Dolores, Duboce Trngl, Buena Vista / Ashbury Hts)
SF District 6: Central North (Lower Pacific Heights, Anza Vista, Western Addition, North Panhandle, Alamo Square, Hayes Valley)
SF District 7: North (Marina, Cow Hollow, Presidio Heights, Pacific Heights)
SF District 8: Northeast (North Waterfront, North Beach, Russian Hill, Telegraph Hill, Nob Hill, Financial District / Barbary Coast, Downtown, Van Ness / Civic Center, Tenderloin)
SF District 9: Central East (Yerba Buena, South Beach, South of Market, Mission Bay, Inner Mission, Potrero Hill, Central Waterfront / Dogpatch, Bernal Heights)
SF District 10: Southeast (Outer Mission, Mission Terr, Excelsior, Portola, Bayview, Silver Terr, Hunters Pt, Candlestick Pt, Bayview Hts, Little Hollywood, Visitation Vly, Crocker Amazon)
4-2013 4-2014 + / – 4-2013 4-2014 + / – 4-2013 4-2014 + / – 4-2013 4-2014 + / – 4-2013 4-2014 + / –
Single Family
1 SF District 1 41 24 -41.5% 22 20 -9.1% $1,521,500 $1,588,000 +4.4% 31 22 -29.1% 2.3 1.3 -43.6%
2 SF District 2 78 42 -46.2% 34 38 +11.8% $853,000 $1,060,000 +24.3% 22 42 +90.0% 2.4 1.0 -56.7%
3 SF District 3 36 27 -25.0% 19 14 -26.3% $668,000 $923,500 +38.2% 32 25 -23.4% 2.5 1.6 -36.1%
4 SF District 4 45 32 -28.9% 23 18 -21.7% $1,135,000 $1,312,500 +15.6% 52 26 -50.3% 1.6 1.2 -23.3%
5 SF District 5 50 33 -34.0% 34 32 -5.9% $1,605,000 $1,898,500 +18.3% 36 23 -35.3% 1.6 1.1 -31.3%
6 SF District 6 8 5 -37.5% 5 4 -20.0% $1,100,000 $1,958,000 +78.0% 48 14 -70.4% 1.8 1.3 -30.4%
7 SF District 7 32 23 -28.1% 13 8 -38.5% $2,950,000 $4,367,500 +48.1% 39 132 +234.8% 3.0 2.1 -29.8%
8 SF District 8 10 7 -30.0% 2 3 +50.0% $7,562,500 $2,750,000 -63.6% 46 62 +35.5% 3.5 3.2 -9.0%
9 SF District 9 42 15 -64.3% 31 25 -19.4% $1,010,000 $1,010,000 0.0% 30 35 +16.5% 2.0 0.7 -67.0%
10 SF District 10 102 77 -24.5% 39 45 +15.4% $545,000 $680,000 +24.8% 39 33 -15.9% 2.0 1.8 -12.2%
Condo/TIC/Coop
1 SF District 1 33 21 -36.4% 12 17 +41.7% $810,500 $752,500 -7.2% 30 55 +82.5% 2.5 1.8 -29.6%
2 SF District 2 16 10 -37.5% 3 5 +66.7% $425,000 $775,888 +82.6% 14 30 +122.4% 3.2 2.2 -31.3%
3 SF District 3 3 4 +33.3% 4 3 -25.0% $415,000 $525,000 +26.5% 78 24 -68.6% 1.0 1.6 +61.5%
4 SF District 4 9 10 +11.1% 6 8 +33.3% $374,000 $546,500 +46.1% 123 21 -82.9% 2.0 1.8 -7.4%
5 SF District 5 79 59 -25.3% 45 45 0.0% $925,000 $959,000 +3.7% 31 26 -17.0% 2.0 1.4 -29.3%
6 SF District 6 60 35 -41.7% 33 25 -24.2% $841,000 $913,500 +8.6% 55 44 -19.1% 2.2 1.2 -46.7%
7 SF District 7 63 30 -52.4% 42 44 +4.8% $1,192,500 $1,385,000 +16.1% 30 32 +5.5% 2.1 1.0 -51.0%
8 SF District 8 134 87 -35.1% 54 41 -24.1% $923,000 $970,000 +5.1% 39 37 -3.5% 3.0 1.8 -38.4%
9 SF District 9 224 161 -28.1% 99 114 +15.2% $761,000 $875,000 +15.0% 35 29 -17.9% 2.5 1.6 -36.3%
10 SF District 10 40 11 -72.5% 5 4 -20.0% $310,000 $546,250 +76.2% 200 29 -85.4% 6.2 2.1 -66.9%
Key metrics by report month for the districts of San Fransisco.
Current as of May 12, 2014. All data from the San Francisco MLS. Powered by 10K Research and Marketing. | Click for Cover Page | 16
Active Listings Sold Listings Median Sales Price Days on Market Months Supply

Más contenido relacionado

La actualidad más candente

La actualidad más candente (20)

San Francisco Market Focus June 2013
San Francisco Market Focus June 2013San Francisco Market Focus June 2013
San Francisco Market Focus June 2013
 
San Francisco Market Focus April 2016
San Francisco Market Focus April 2016San Francisco Market Focus April 2016
San Francisco Market Focus April 2016
 
San Francisco Market Focus Sept 2017
San Francisco Market Focus Sept 2017San Francisco Market Focus Sept 2017
San Francisco Market Focus Sept 2017
 
San Francisco Real Estate Housing Market December 2016
San Francisco Real Estate Housing Market December 2016San Francisco Real Estate Housing Market December 2016
San Francisco Real Estate Housing Market December 2016
 
San Francisco Market Focus June 2016
San Francisco Market Focus June 2016San Francisco Market Focus June 2016
San Francisco Market Focus June 2016
 
San Francisco Market Focus May 2016
San Francisco Market Focus May 2016San Francisco Market Focus May 2016
San Francisco Market Focus May 2016
 
San Francisco Market Focus December 2013
San Francisco Market Focus December 2013San Francisco Market Focus December 2013
San Francisco Market Focus December 2013
 
San Francisco Market Focus March 2015
San Francisco Market Focus March 2015San Francisco Market Focus March 2015
San Francisco Market Focus March 2015
 
2013 Annual Historical Data
2013 Annual Historical Data2013 Annual Historical Data
2013 Annual Historical Data
 
San Francisco Market Focus April 2017
San Francisco Market Focus April 2017San Francisco Market Focus April 2017
San Francisco Market Focus April 2017
 
San Francisco Market Focus June 2017
San Francisco Market Focus June 2017San Francisco Market Focus June 2017
San Francisco Market Focus June 2017
 
San Francisco Market Focus May 2017
San Francisco Market Focus May 2017San Francisco Market Focus May 2017
San Francisco Market Focus May 2017
 
San Francisco Market Focus June 2015
San Francisco Market Focus June 2015San Francisco Market Focus June 2015
San Francisco Market Focus June 2015
 
San Francisco Market Focus Report Nov 2020
San Francisco Market Focus Report Nov 2020San Francisco Market Focus Report Nov 2020
San Francisco Market Focus Report Nov 2020
 
February 2015 Greater Boston Real Estate Market Trends Report
February 2015 Greater Boston Real Estate Market Trends ReportFebruary 2015 Greater Boston Real Estate Market Trends Report
February 2015 Greater Boston Real Estate Market Trends Report
 
San Francisco Market Data December 2014
San Francisco Market Data December 2014San Francisco Market Data December 2014
San Francisco Market Data December 2014
 
San Francisco Market Data October 2020
San Francisco Market Data October 2020San Francisco Market Data October 2020
San Francisco Market Data October 2020
 
San Francisco Market Focus Jan 2014
San Francisco Market Focus Jan 2014 San Francisco Market Focus Jan 2014
San Francisco Market Focus Jan 2014
 
San Francisco Market Focus September 2016
San Francisco Market Focus September 2016San Francisco Market Focus September 2016
San Francisco Market Focus September 2016
 
San Francisco Market Focus August 2016
San Francisco Market Focus August 2016San Francisco Market Focus August 2016
San Francisco Market Focus August 2016
 

Destacado (8)

San francisco residential dec 2010 dec 2012
San francisco residential dec 2010   dec 2012San francisco residential dec 2010   dec 2012
San francisco residential dec 2010 dec 2012
 
AJSA Orissa Brochure
AJSA Orissa Brochure AJSA Orissa Brochure
AJSA Orissa Brochure
 
Marwa Gamal.Cv
Marwa Gamal.CvMarwa Gamal.Cv
Marwa Gamal.Cv
 
San francisco demographics report
San francisco demographics reportSan francisco demographics report
San francisco demographics report
 
San Francisco Market Focus July 2013
San Francisco Market Focus July 2013San Francisco Market Focus July 2013
San Francisco Market Focus July 2013
 
Through the looking [Google] Glass
Through the looking [Google] GlassThrough the looking [Google] Glass
Through the looking [Google] Glass
 
Seminar topik bagaimana sewa atau beli rumah di amerika
Seminar  topik bagaimana sewa atau beli rumah di amerikaSeminar  topik bagaimana sewa atau beli rumah di amerika
Seminar topik bagaimana sewa atau beli rumah di amerika
 
5 alasan untuk beli rumah di Amerika
5 alasan untuk beli rumah di Amerika5 alasan untuk beli rumah di Amerika
5 alasan untuk beli rumah di Amerika
 

Similar a San Francisco Market Focus April 2014

San Francisco Real Estate Market Report August 2014
San Francisco Real Estate Market Report August 2014San Francisco Real Estate Market Report August 2014
San Francisco Real Estate Market Report August 2014
Ronny Budiutama
 

Similar a San Francisco Market Focus April 2014 (16)

San Francisco Market Focus March 2014
San Francisco Market Focus March 2014San Francisco Market Focus March 2014
San Francisco Market Focus March 2014
 
San Francisco Market Focus May 2015
San Francisco Market Focus May 2015San Francisco Market Focus May 2015
San Francisco Market Focus May 2015
 
San Francisco Market Focus October 2015
San Francisco Market Focus October 2015San Francisco Market Focus October 2015
San Francisco Market Focus October 2015
 
San Francisco Market Focus July 2015
San Francisco Market Focus July 2015San Francisco Market Focus July 2015
San Francisco Market Focus July 2015
 
San Francisco Market Focus September 2015
San Francisco Market Focus September 2015San Francisco Market Focus September 2015
San Francisco Market Focus September 2015
 
San Francisco Market Focus December 2015
San Francisco Market Focus December 2015San Francisco Market Focus December 2015
San Francisco Market Focus December 2015
 
San Francisco Real Estate Market Report August 2014
San Francisco Real Estate Market Report August 2014San Francisco Real Estate Market Report August 2014
San Francisco Real Estate Market Report August 2014
 
San Francisco Market Focus February 2015
San Francisco Market Focus February 2015San Francisco Market Focus February 2015
San Francisco Market Focus February 2015
 
San Francisco Market Report March 2021
San Francisco Market Report March 2021San Francisco Market Report March 2021
San Francisco Market Report March 2021
 
San Francisco Market Focus July 2016
San Francisco Market Focus July 2016San Francisco Market Focus July 2016
San Francisco Market Focus July 2016
 
San Francisco market report September 2020
San Francisco market report September 2020San Francisco market report September 2020
San Francisco market report September 2020
 
San Francisco Market Focus September 2014
San Francisco Market Focus September 2014San Francisco Market Focus September 2014
San Francisco Market Focus September 2014
 
San Francisco Market Focus February 2016
San Francisco Market Focus February 2016San Francisco Market Focus February 2016
San Francisco Market Focus February 2016
 
San Francisco Market Focus March 2018
San Francisco Market Focus March 2018San Francisco Market Focus March 2018
San Francisco Market Focus March 2018
 
San Francisco Market Report September 2021
San Francisco Market Report September 2021San Francisco Market Report September 2021
San Francisco Market Report September 2021
 
San Francisco Market Report January 2021
San Francisco Market Report January 2021San Francisco Market Report January 2021
San Francisco Market Report January 2021
 

Más de Ronny Budiutama

Más de Ronny Budiutama (20)

San Francisco January 2024 Market Report
San Francisco January 2024 Market ReportSan Francisco January 2024 Market Report
San Francisco January 2024 Market Report
 
San Francisco December 2023 Market Report
San Francisco December 2023 Market ReportSan Francisco December 2023 Market Report
San Francisco December 2023 Market Report
 
San Francisco November 2023 Market Report
San Francisco November 2023 Market ReportSan Francisco November 2023 Market Report
San Francisco November 2023 Market Report
 
2023 Annual San Francisco Housing Market
2023 Annual San Francisco Housing Market2023 Annual San Francisco Housing Market
2023 Annual San Francisco Housing Market
 
October 2023 Report: San Francisco Real Estate Market Insights
October 2023 Report: San Francisco Real Estate Market InsightsOctober 2023 Report: San Francisco Real Estate Market Insights
October 2023 Report: San Francisco Real Estate Market Insights
 
CA Weekly MLS Market Data Report - August 2023
CA Weekly MLS Market Data Report - August 2023CA Weekly MLS Market Data Report - August 2023
CA Weekly MLS Market Data Report - August 2023
 
San Francisco Market Report July 2023.pdf
San Francisco Market Report July 2023.pdfSan Francisco Market Report July 2023.pdf
San Francisco Market Report July 2023.pdf
 
San Francisco May 2023 Market Report.pdf
San Francisco May 2023 Market Report.pdfSan Francisco May 2023 Market Report.pdf
San Francisco May 2023 Market Report.pdf
 
San Francisco June 2023 Market Report.pdf
San Francisco June 2023 Market Report.pdfSan Francisco June 2023 Market Report.pdf
San Francisco June 2023 Market Report.pdf
 
San Francisco Market Report March 2023.pdf
San Francisco Market Report March 2023.pdfSan Francisco Market Report March 2023.pdf
San Francisco Market Report March 2023.pdf
 
San Francisco Market Report February 2023
San Francisco Market Report February 2023San Francisco Market Report February 2023
San Francisco Market Report February 2023
 
San Francisco Market Report January 2023.pdf
San Francisco Market Report January 2023.pdfSan Francisco Market Report January 2023.pdf
San Francisco Market Report January 2023.pdf
 
Annual Report on the San Francisco County Housing Market.pdf
Annual Report on the San Francisco County Housing Market.pdfAnnual Report on the San Francisco County Housing Market.pdf
Annual Report on the San Francisco County Housing Market.pdf
 
San Francisco Market Report December 2022.pdf
San Francisco Market Report December 2022.pdfSan Francisco Market Report December 2022.pdf
San Francisco Market Report December 2022.pdf
 
San Francisco Market Report November 2022.pdf
San Francisco Market Report November 2022.pdfSan Francisco Market Report November 2022.pdf
San Francisco Market Report November 2022.pdf
 
San Francisco Market Report October 2022.pdf
San Francisco Market Report October 2022.pdfSan Francisco Market Report October 2022.pdf
San Francisco Market Report October 2022.pdf
 
San Francisco Market Report September 2022.pdf
San Francisco Market Report September 2022.pdfSan Francisco Market Report September 2022.pdf
San Francisco Market Report September 2022.pdf
 
San Francisco Market Report August 2022.pdf
San Francisco Market Report August 2022.pdfSan Francisco Market Report August 2022.pdf
San Francisco Market Report August 2022.pdf
 
San Francisco Market Report July 2022.pdf
San Francisco Market Report July 2022.pdfSan Francisco Market Report July 2022.pdf
San Francisco Market Report July 2022.pdf
 
San Francisco Market Report June 2022.pdf
San Francisco Market Report June 2022.pdfSan Francisco Market Report June 2022.pdf
San Francisco Market Report June 2022.pdf
 

Último

9990771857 Call Girls in Dwarka Sector 2 Delhi (Call Girls) Delhi
9990771857 Call Girls in Dwarka Sector 2 Delhi (Call Girls) Delhi9990771857 Call Girls in Dwarka Sector 2 Delhi (Call Girls) Delhi
9990771857 Call Girls in Dwarka Sector 2 Delhi (Call Girls) Delhi
delhimodel235
 
9990771857 Call Girls in Dwarka Sector 3 Delhi (Call Girls) Delhi
9990771857 Call Girls in Dwarka Sector 3 Delhi (Call Girls) Delhi9990771857 Call Girls in Dwarka Sector 3 Delhi (Call Girls) Delhi
9990771857 Call Girls in Dwarka Sector 3 Delhi (Call Girls) Delhi
delhimodel235
 
Best Deal Virtual Space in Satya The Hive Tata Zudio 750 Sqft 1.89 Cr All inc...
Best Deal Virtual Space in Satya The Hive Tata Zudio 750 Sqft 1.89 Cr All inc...Best Deal Virtual Space in Satya The Hive Tata Zudio 750 Sqft 1.89 Cr All inc...
Best Deal Virtual Space in Satya The Hive Tata Zudio 750 Sqft 1.89 Cr All inc...
ApartmentWala1
 
9990771857 Call Girls in Dwarka Sector 6 Delhi (Call Girls) Delhi
9990771857 Call Girls in Dwarka Sector 6 Delhi (Call Girls) Delhi9990771857 Call Girls in Dwarka Sector 6 Delhi (Call Girls) Delhi
9990771857 Call Girls in Dwarka Sector 6 Delhi (Call Girls) Delhi
delhimodel235
 
Call Girls In Laxmi Nagar Delhi +91-8447779280! !Best Woman Seeking Man Escor...
Call Girls In Laxmi Nagar Delhi +91-8447779280! !Best Woman Seeking Man Escor...Call Girls In Laxmi Nagar Delhi +91-8447779280! !Best Woman Seeking Man Escor...
Call Girls In Laxmi Nagar Delhi +91-8447779280! !Best Woman Seeking Man Escor...
asmaqueen5
 
Call girls in new Ashok NagarDelhi꧁ 8447779280꧂ Escort Service Women Seeking ...
Call girls in new Ashok NagarDelhi꧁ 8447779280꧂ Escort Service Women Seeking ...Call girls in new Ashok NagarDelhi꧁ 8447779280꧂ Escort Service Women Seeking ...
Call girls in new Ashok NagarDelhi꧁ 8447779280꧂ Escort Service Women Seeking ...
asmaqueen5
 
9990771857 Call Girls in Dwarka Sector 1 Delhi (Call Girls) Delhi
9990771857 Call Girls in Dwarka Sector 1 Delhi (Call Girls) Delhi9990771857 Call Girls in Dwarka Sector 1 Delhi (Call Girls) Delhi
9990771857 Call Girls in Dwarka Sector 1 Delhi (Call Girls) Delhi
delhimodel235
 
Call Girls In Mayur Vihar Delhi ☆↫8447779280 ❤Escorts Service In Delhi
Call Girls In Mayur Vihar Delhi ☆↫8447779280 ❤Escorts Service In DelhiCall Girls In Mayur Vihar Delhi ☆↫8447779280 ❤Escorts Service In Delhi
Call Girls In Mayur Vihar Delhi ☆↫8447779280 ❤Escorts Service In Delhi
asmaqueen5
 
Low Rate ↬Call Girls in Trilokpuri Delhi ↫8447779280}Escorts Service In Delhi
Low Rate ↬Call Girls in Trilokpuri Delhi ↫8447779280}Escorts Service In DelhiLow Rate ↬Call Girls in Trilokpuri Delhi ↫8447779280}Escorts Service In Delhi
Low Rate ↬Call Girls in Trilokpuri Delhi ↫8447779280}Escorts Service In Delhi
asmaqueen5
 
9990771857 Call Girls Dwarka Sector 9 Delhi (Call Girls ) Delhi
9990771857 Call Girls Dwarka Sector 9 Delhi (Call Girls ) Delhi9990771857 Call Girls Dwarka Sector 9 Delhi (Call Girls ) Delhi
9990771857 Call Girls Dwarka Sector 9 Delhi (Call Girls ) Delhi
delhimodel235
 
Call Girls In Vasant Vihar Delhi 💯Call Us 🔝8264348440🔝
Call Girls In Vasant Vihar Delhi 💯Call Us 🔝8264348440🔝Call Girls In Vasant Vihar Delhi 💯Call Us 🔝8264348440🔝
Call Girls In Vasant Vihar Delhi 💯Call Us 🔝8264348440🔝
soniya singh
 
Call Girls in Karkardooma Delhi +91 84487779280}Woman Seeking Man in Delhi NCR
Call Girls in Karkardooma Delhi +91 84487779280}Woman Seeking Man in Delhi NCRCall Girls in Karkardooma Delhi +91 84487779280}Woman Seeking Man in Delhi NCR
Call Girls in Karkardooma Delhi +91 84487779280}Woman Seeking Man in Delhi NCR
asmaqueen5
 

Último (20)

9990771857 Call Girls in Dwarka Sector 2 Delhi (Call Girls) Delhi
9990771857 Call Girls in Dwarka Sector 2 Delhi (Call Girls) Delhi9990771857 Call Girls in Dwarka Sector 2 Delhi (Call Girls) Delhi
9990771857 Call Girls in Dwarka Sector 2 Delhi (Call Girls) Delhi
 
M3M The Line Brochure - Premium Investment Opportunity for Commercial Ventures
M3M The Line Brochure - Premium Investment Opportunity for Commercial VenturesM3M The Line Brochure - Premium Investment Opportunity for Commercial Ventures
M3M The Line Brochure - Premium Investment Opportunity for Commercial Ventures
 
9990771857 Call Girls in Dwarka Sector 3 Delhi (Call Girls) Delhi
9990771857 Call Girls in Dwarka Sector 3 Delhi (Call Girls) Delhi9990771857 Call Girls in Dwarka Sector 3 Delhi (Call Girls) Delhi
9990771857 Call Girls in Dwarka Sector 3 Delhi (Call Girls) Delhi
 
M3M 129 E Brochure Noida Expressway, Sector 129, Noida
M3M 129 E Brochure Noida Expressway, Sector 129, NoidaM3M 129 E Brochure Noida Expressway, Sector 129, Noida
M3M 129 E Brochure Noida Expressway, Sector 129, Noida
 
Best Deal Virtual Space in Satya The Hive Tata Zudio 750 Sqft 1.89 Cr All inc...
Best Deal Virtual Space in Satya The Hive Tata Zudio 750 Sqft 1.89 Cr All inc...Best Deal Virtual Space in Satya The Hive Tata Zudio 750 Sqft 1.89 Cr All inc...
Best Deal Virtual Space in Satya The Hive Tata Zudio 750 Sqft 1.89 Cr All inc...
 
9990771857 Call Girls in Dwarka Sector 6 Delhi (Call Girls) Delhi
9990771857 Call Girls in Dwarka Sector 6 Delhi (Call Girls) Delhi9990771857 Call Girls in Dwarka Sector 6 Delhi (Call Girls) Delhi
9990771857 Call Girls in Dwarka Sector 6 Delhi (Call Girls) Delhi
 
Call Girls In Laxmi Nagar Delhi +91-8447779280! !Best Woman Seeking Man Escor...
Call Girls In Laxmi Nagar Delhi +91-8447779280! !Best Woman Seeking Man Escor...Call Girls In Laxmi Nagar Delhi +91-8447779280! !Best Woman Seeking Man Escor...
Call Girls In Laxmi Nagar Delhi +91-8447779280! !Best Woman Seeking Man Escor...
 
Call girls in new Ashok NagarDelhi꧁ 8447779280꧂ Escort Service Women Seeking ...
Call girls in new Ashok NagarDelhi꧁ 8447779280꧂ Escort Service Women Seeking ...Call girls in new Ashok NagarDelhi꧁ 8447779280꧂ Escort Service Women Seeking ...
Call girls in new Ashok NagarDelhi꧁ 8447779280꧂ Escort Service Women Seeking ...
 
Premium Villa Projects in Sarjapur Road Bengaluru
Premium Villa Projects in Sarjapur Road BengaluruPremium Villa Projects in Sarjapur Road Bengaluru
Premium Villa Projects in Sarjapur Road Bengaluru
 
9990771857 Call Girls in Dwarka Sector 1 Delhi (Call Girls) Delhi
9990771857 Call Girls in Dwarka Sector 1 Delhi (Call Girls) Delhi9990771857 Call Girls in Dwarka Sector 1 Delhi (Call Girls) Delhi
9990771857 Call Girls in Dwarka Sector 1 Delhi (Call Girls) Delhi
 
Magarpatta Nova Elegance Mundhwa Pune E-Brochure.pdf
Magarpatta Nova Elegance Mundhwa Pune  E-Brochure.pdfMagarpatta Nova Elegance Mundhwa Pune  E-Brochure.pdf
Magarpatta Nova Elegance Mundhwa Pune E-Brochure.pdf
 
BDSM⚡Call Girls in Sector 57 Noida Escorts >༒8448380779 Escort Service
BDSM⚡Call Girls in Sector 57 Noida Escorts >༒8448380779 Escort ServiceBDSM⚡Call Girls in Sector 57 Noida Escorts >༒8448380779 Escort Service
BDSM⚡Call Girls in Sector 57 Noida Escorts >༒8448380779 Escort Service
 
Call Girls In Mayur Vihar Delhi ☆↫8447779280 ❤Escorts Service In Delhi
Call Girls In Mayur Vihar Delhi ☆↫8447779280 ❤Escorts Service In DelhiCall Girls In Mayur Vihar Delhi ☆↫8447779280 ❤Escorts Service In Delhi
Call Girls In Mayur Vihar Delhi ☆↫8447779280 ❤Escorts Service In Delhi
 
2k Shot Call girls Karol Bagh Delhi 9205541914
2k Shot Call girls Karol Bagh Delhi 92055419142k Shot Call girls Karol Bagh Delhi 9205541914
2k Shot Call girls Karol Bagh Delhi 9205541914
 
Low Rate ↬Call Girls in Trilokpuri Delhi ↫8447779280}Escorts Service In Delhi
Low Rate ↬Call Girls in Trilokpuri Delhi ↫8447779280}Escorts Service In DelhiLow Rate ↬Call Girls in Trilokpuri Delhi ↫8447779280}Escorts Service In Delhi
Low Rate ↬Call Girls in Trilokpuri Delhi ↫8447779280}Escorts Service In Delhi
 
Greater Vancouver Realtors Statistics Package April 2024
Greater Vancouver Realtors Statistics Package April 2024Greater Vancouver Realtors Statistics Package April 2024
Greater Vancouver Realtors Statistics Package April 2024
 
9990771857 Call Girls Dwarka Sector 9 Delhi (Call Girls ) Delhi
9990771857 Call Girls Dwarka Sector 9 Delhi (Call Girls ) Delhi9990771857 Call Girls Dwarka Sector 9 Delhi (Call Girls ) Delhi
9990771857 Call Girls Dwarka Sector 9 Delhi (Call Girls ) Delhi
 
Kolte Patil Kharadi Pune E Brochure.pdf
Kolte Patil Kharadi Pune E  Brochure.pdfKolte Patil Kharadi Pune E  Brochure.pdf
Kolte Patil Kharadi Pune E Brochure.pdf
 
Call Girls In Vasant Vihar Delhi 💯Call Us 🔝8264348440🔝
Call Girls In Vasant Vihar Delhi 💯Call Us 🔝8264348440🔝Call Girls In Vasant Vihar Delhi 💯Call Us 🔝8264348440🔝
Call Girls In Vasant Vihar Delhi 💯Call Us 🔝8264348440🔝
 
Call Girls in Karkardooma Delhi +91 84487779280}Woman Seeking Man in Delhi NCR
Call Girls in Karkardooma Delhi +91 84487779280}Woman Seeking Man in Delhi NCRCall Girls in Karkardooma Delhi +91 84487779280}Woman Seeking Man in Delhi NCR
Call Girls in Karkardooma Delhi +91 84487779280}Woman Seeking Man in Delhi NCR
 

San Francisco Market Focus April 2014

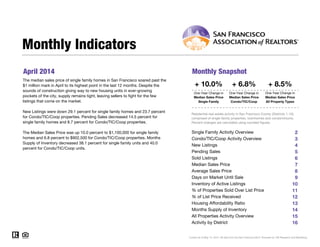
  • 1. April 2014 Monthly Snapshot One-Year Change in One-Year Change in Median Sales Price Single Family Median Sales Price Condo/TIC/Coop 2 3 4 5 6 7 8 9 10 11 12 13 14 15 16 Monthly Indicators + 10.0% + 6.8% + 8.5% One-Year Change in The median sales price of single family homes in San Francisco soared past the $1 million mark in April to its highest point in the last 12 months. Despite the sounds of construction giving way to new housing units in ever-growing pockets of the city, supply remains tight, leaving sellers to fight for the few listings that come on the market. New Listings were down 29.1 percent for single family homes and 23.7 percent for Condo/TIC/Coop properties. Pending Sales decreased 14.5 percent for single family homes and 8.7 percent for Condo/TIC/Coop properties. The Median Sales Price was up 10.0 percent to $1,100,000 for single family homes and 6.8 percent to $902,500 for Condo/TIC/Coop properties. Months Supply of Inventory decreased 38.1 percent for single family units and 40.0 percent for Condo/TIC/Coop units. Median Sales Price All Property Types Residential real estate activity in San Francisco County (Districts 1-10), comprised of single-family properties, townhomes and condominiums. Percent changes are calculated using rounded figures. Single Family Activity Overview Months Supply of Inventory Current as of May 12, 2014. All data from the San Francisco MLS. Powered by 10K Research and Marketing. Condo/TIC/Coop Activity Overview Inventory of Active Listings % of Properties Sold Over List Price % of List Price Received Housing Affordability Ratio All Properties Activity Overview New Listings Pending Sales Sold Listings Median Sales Price Average Sales Price Days on Market Until Sale Activity by District
  • 2. Single Family Activity Overview Key metrics by report month and for year-to-date (YTD) starting from the first of the year. Key Metrics Historical Sparkbars 4-2013 4-2014 Percent Change YTD 2013 YTD 2014 Percent Change Current as of May 12, 2014. All data from the San Francisco MLS. Powered by 10K Research and Marketing. | Click for Cover Page | 2 Months Supply 2.1 1.3 - 38.1% -- -- -- Affordability Ratio 50 40 - 20.0% % of List Price Received 111.7% 115.1% + 3.0% 109.3% 58 77.1% + 4.9% + 2.2% 44 - 24.1% 111.7% % of Properties Sold Over List Price 79.7% 85.5% + 7.3% 73.5% Active Listings 444 285 - 35.8% -- Average Sales Price $1,362,627 $1,500,863 + 10.1% $1,226,933 Days on Market 35 35 0.0% 40 36 - 10.0% $1,424,726 -- -- Median Sales Price $1,000,000 $1,100,000 + 10.0% $865,000 Sold Listings 222 207 - 6.8% 719 New Listings 302 214 - 29.1% 971 Pending Sales 242 207 - 14.5% - 3.6%756 729 - 13.1%844 669 - 7.0% $1,010,000 + 16.8% + 16.1% 4-2011 4-2012 4-2013 4-2014 4-2011 4-2012 4-2013 4-2014 4-2011 4-2012 4-2013 4-2014 4-2011 4-2012 4-2013 4-2014 4-2011 4-2012 4-2013 4-2014 4-2011 4-2012 4-2013 4-2014 4-2011 4-2012 4-2013 4-2014 4-2011 4-2012 4-2013 4-2014 4-2011 4-2012 4-2013 4-2014 4-2011 4-2012 4-2013 4-2014 4-2011 4-2012 4-2013 4-2014
  • 3. Condo/TIC/Coop Activity Overview Key metrics by report month and for year-to-date (YTD) starting from the first of the year. Key Metrics Historical Sparkbars 4-2013 4-2014 Percent Change YTD 2013 YTD 2014 Percent Change Current as of May 12, 2014. All data from the San Francisco MLS. Powered by 10K Research and Marketing. | Click for Cover Page | 3 Months Supply 2.5 1.5 - 40.0% -- -- -- Affordability Ratio 68 56 - 17.6% % of List Price Received 105.7% 108.8% + 2.9% 104.3% 71 66.5% + 12.9% + 2.6% 54 - 23.9% 107.0% % of Properties Sold Over List Price 67.3% 72.5% + 7.7% 58.9% Active Listings 661 428 - 35.2% -- Average Sales Price $975,623 $1,121,688 + 15.0% $924,186 Days on Market 41 32 - 22.0% 47 $935,000 + 16.1% + 16.5% 38 - 19.1% $1,076,944 -- -- Sold Listings 303 306 + 1.0% 936 970 + 3.6% Median Sales Price $845,250 $902,500 + 6.8% $805,000 - 11.9% Pending Sales 309 282 - 8.7% 1,002 1,007 + 0.5% New Listings 396 302 - 23.7% 1,392 1,226 4-2011 4-2012 4-2013 4-2014 4-2011 4-2012 4-2013 4-2014 4-2011 4-2012 4-2013 4-2014 4-2011 4-2012 4-2013 4-2014 4-2011 4-2012 4-2013 4-2014 4-2011 4-2012 4-2013 4-2014 4-2011 4-2012 4-2013 4-2014 4-2011 4-2012 4-2013 4-2014 4-2011 4-2012 4-2013 4-2014 4-2011 4-2012 4-2013 4-2014 4-2011 4-2012 4-2013 4-2014
  • 4. New Listings New Listings Single Family Year-Over-Year Change Condo/TIC/ Coop Year-Over-Year Change May-2013 339 +30.9% 384 +2.7% Jun-2013 293 +13.1% 358 +7.2% Jul-2013 259 +1.6% 332 +23.4% Aug-2013 272 +7.1% 341 +8.9% Sep-2013 296 -6.6% 448 +15.8% Oct-2013 277 -3.5% 321 +5.2% Nov-2013 171 -5.5% 191 -9.5% Dec-2013 112 +9.8% 116 +1.8% Jan-2014 207 +1.5% 336 +8.4% Feb-2014 194 -8.1% 300 -5.1% Mar-2014 229 -9.8% 288 -22.2% Apr-2014 214 -29.1% 302 -23.7% 12-Month Avg 239 -0.8% 310 +0.5% Historical New Listings by Month Current as of May 12, 2014. All data from the San Francisco MLS. Powered by 10K Research and Marketing. | Click for Cover Page | 4 A count of the properties that have been newly listed on the market in a given month. 262 344 302 396 214 302 Single Family Condo/TIC/Coop April 0 100 200 300 400 500 600 700 1-2005 1-2006 1-2007 1-2008 1-2009 1-2010 1-2011 1-2012 1-2013 1-2014 Single Family Condo/TIC/Coop 1,058 1,283 971 1,392 844 1,226 Single Family Condo/TIC/Coop Year to Date 2012 2013 2014 - 23.7%+ 15.1%- 29.1%+ 15.3% + 8.5%- 13.1%- 8.2% - 11.9% 2012 2013 2014 2012 2013 2014 2012 2013 2014 - 10.3% - 11.5% - 19.8%- 19.6%
  • 5. Pending Sales Pending Sales Single Family Year-Over-Year Change Condo/TIC/ Coop Year-Over-Year Change May-2013 269 +10.2% 360 +13.9% Jun-2013 278 +17.3% 290 -7.6% Jul-2013 250 +10.6% 332 +16.1% Aug-2013 230 +1.8% 302 +4.5% Sep-2013 210 +14.8% 254 +16.5% Oct-2013 245 -14.6% 340 +22.7% Nov-2013 224 -10.8% 270 -0.4% Dec-2013 171 +0.6% 201 -1.0% Jan-2014 135 -14.6% 183 +5.2% Feb-2014 166 +11.4% 252 +16.1% Mar-2014 221 +6.8% 290 -4.0% Apr-2014 207 -14.5% 282 -8.7% 12-Month Avg 217 +1.0% 280 +5.7% Historical Pending Sales by Month A count of the properties on which offers have been accepted in a given month. Current as of May 12, 2014. All data from the San Francisco MLS. Powered by 10K Research and Marketing. | Click for Cover Page | 5 235 320 242 309 207 282 Single Family Condo/TIC/Coop April 0 100 200 300 400 1-2005 1-2006 1-2007 1-2008 1-2009 1-2010 1-2011 1-2012 1-2013 1-2014 Single Family Condo/TIC/Coop 825 980 756 1,002 729 1,007 Single Family Condo/TIC/Coop Year to Date 2012 2013 2014 - 8.7%- 3.4%- 14.5%+ 3.0% + 2.2%- 3.6%- 8.4% + 0.5% 2012 2013 2014 2012 2013 2014 2012 2013 2014 + 22.4% + 10.6% + 15.3%+ 39.7%
  • 6. Sold Listings Sold Listings Single Family Year-Over-Year Change Condo/TIC/ Coop Year-Over-Year Change May-2013 252 +6.8% 380 +27.1% Jun-2013 272 +1.5% 277 -18.5% Jul-2013 278 +28.1% 341 +23.1% Aug-2013 238 -1.7% 303 -6.2% Sep-2013 188 +5.0% 229 +0.4% Oct-2013 256 +0.4% 335 +21.8% Nov-2013 240 -11.8% 283 +4.8% Dec-2013 215 +2.9% 246 -2.0% Jan-2014 131 -18.6% 178 +14.1% Feb-2014 157 +21.7% 221 +13.3% Mar-2014 174 -15.9% 265 -6.0% Apr-2014 207 -6.8% 306 +1.0% 12-Month Avg 217 +0.4% 280 +5.2% Historical Sold Listings by Month A count of the actual sales that closed in a given month. Current as of May 12, 2014. All data from the San Francisco MLS. Powered by 10K Research and Marketing. | Click for Cover Page | 6 221 295 222 303 207 306 Single Family Condo/TIC/Coop April 0 100 200 300 400 1-2005 1-2006 1-2007 1-2008 1-2009 1-2010 1-2011 1-2012 1-2013 1-2014 Single Family Condo/TIC/Coop 756 903 719 936 669 970 Single Family Condo/TIC/Coop Year to Date 2012 2013 2014 + 1.0%+ 2.7%- 6.8%+ 0.5% + 3.7%- 7.0%- 4.9% + 3.6% 2012 2013 2014 2012 2013 2014 2012 2013 2014 + 11.6% + 8.3% + 10.1%+ 21.4%
  • 7. Median Sales Price Median Sales Price Single Family Year-Over-Year Change Condo/TIC/ Coop Year-Over-Year Change May-2013 $1,017,500 +30.8% $830,000 +18.6% Jun-2013 $939,000 +20.4% $780,000 +9.5% Jul-2013 $872,500 +13.6% $850,000 +23.2% Aug-2013 $934,000 +22.5% $810,000 +11.7% Sep-2013 $929,000 +28.1% $826,000 +6.4% Oct-2013 $905,000 +9.0% $865,000 +13.8% Nov-2013 $957,000 +18.1% $826,000 +6.6% Dec-2013 $945,000 +13.2% $762,500 +9.1% Jan-2014 $925,000 +24.2% $950,000 +24.6% Feb-2014 $1,050,000 +31.2% $939,000 +25.2% Mar-2014 $990,000 +7.6% $970,000 +17.9% Apr-2014 $1,100,000 +10.0% $902,500 +6.8% 12-Month Avg* $950,000 +17.3% $850,000 +12.6% Historical Median Sales Price by Month Point at which half of the sales sold for more and half sold for less, not accounting for seller concessions, in a given month. * Median Sales Price for all properties from May 2013 through April 2014. This is not the average of the individual figures above. Current as of May 12, 2014. All data from the San Francisco MLS. Powered by 10K Research and Marketing. | Click for Cover Page | 7 $760,000 $705,000 $1,000,000 $845,250 $1,100,000 $902,500 Single Family Condo/TIC/Coop April $500,000 $600,000 $700,000 $800,000 $900,000 $1,000,000 $1,100,000 $1,200,000 1-2005 1-2006 1-2007 1-2008 1-2009 1-2010 1-2011 1-2012 1-2013 1-2014 Single Family Condo/TIC/Coop $690,000 $650,000 $865,000 $805,000 $1,010,000 $935,000 Single Family Condo/TIC/Coop Year to Date 2012 2013 2014 + 6.8%+ 19.9%+ 10.0%+ 31.6% + 23.8%+ 16.8%+ 25.4% + 16.1% 2012 2013 2014 2012 2013 2014 2012 2013 2014 + 8.5% + 2.2% + 3.3%+ 6.8%
  • 8. Average Sales Price Average Sales Price Single Family Year-Over-Year Change Condo/TIC/ Coop Year-Over-Year Change May-2013 $1,489,882 +32.2% $980,113 +21.3% Jun-2013 $1,195,239 +3.0% $930,338 +12.9% Jul-2013 $1,281,445 +8.5% $1,018,542 +30.8% Aug-2013 $1,301,708 +31.8% $929,734 +15.4% Sep-2013 $1,235,064 +31.9% $941,430 +4.8% Oct-2013 $1,347,949 +4.0% $1,009,812 +13.6% Nov-2013 $1,323,997 +18.8% $980,320 +1.0% Dec-2013 $1,342,251 -3.1% $1,020,083 +19.3% Jan-2014 $1,244,233 +36.7% $1,120,141 +34.5% Feb-2014 $1,462,472 +25.4% $996,871 +13.9% Mar-2014 $1,435,981 +5.2% $1,063,203 +11.5% Apr-2014 $1,500,863 +10.1% $1,121,688 +15.0% 12-Month Avg* $1,343,310 +14.6% $1,006,537 +15.5% Historical Average Sales Price by Month Average sales price for all closed sales, not accounting for seller concessions, in a given month. * Average Sales Price for all properties from May 2013 through April 2014. This is not the average of the individual figures above. Current as of May 12, 2014. All data from the San Francisco MLS. Powered by 10K Research and Marketing. | Click for Cover Page | 8 $1,058,803 $760,266 $1,362,627 $975,623 $1,500,863 $1,121,688 Single Family Condo/TIC/Coop April $600,000 $800,000 $1,000,000 $1,200,000 $1,400,000 $1,600,000 1-2005 1-2006 1-2007 1-2008 1-2009 1-2010 1-2011 1-2012 1-2013 1-2014 Single Family Condo/TIC/Coop $985,585 $741,143 $1,226,933 $924,186 $1,424,726 $1,076,944 Single Family Condo/TIC/Coop Year to Date 2012 2013 2014 + 15.0%+ 28.3%+ 10.1%+ 28.7% + 24.7%+ 16.1%+ 24.5% + 16.5% 2012 2013 2014 2012 2013 2014 2012 2013 2014 + 5.0% + 5.1% + 0.9%- 3.5%
  • 9. Days on Market Until Sale Days on Market Single Family Year-Over-Year Change Condo/TIC/ Coop Year-Over-Year Change May-2013 32 -31.9% 36 -36.8% Jun-2013 35 -40.7% 38 -33.3% Jul-2013 33 -29.8% 39 -35.0% Aug-2013 38 -24.0% 38 -29.6% Sep-2013 31 -32.6% 37 -28.8% Oct-2013 34 -24.4% 37 -32.7% Nov-2013 34 -19.0% 41 -19.6% Dec-2013 42 -12.5% 44 -27.9% Jan-2014 40 -18.4% 51 -19.0% Feb-2014 38 -7.3% 39 -20.4% Mar-2014 32 -17.9% 33 -21.4% Apr-2014 35 0.0% 32 -22.0% 12-Month Avg* 35 -23.6% 38 -27.7% Historical Days on Market Until Sale by Month Average number of days between when a property is listed and when an offer is accepted in a given month. * Days on Market for all properties from May 2013 through April 2014. This is not the average of the individual figures above. Current as of May 12, 2014. All data from the San Francisco MLS. Powered by 10K Research and Marketing. | Click for Cover Page | 9 54 70 35 41 35 32 Single Family Condo/TIC/Coop April 20 40 60 80 100 120 1-2005 1-2006 1-2007 1-2008 1-2009 1-2010 1-2011 1-2012 1-2013 1-2014 Single Family Condo/TIC/Coop 64 79 40 47 36 38 Single Family Condo/TIC/Coop Year to Date 2012 2013 2014 - 22.0%- 41.4%0.0%- 35.2% - 40.5%- 10.0%- 37.5% - 19.1% 2012 2013 2014 2012 2013 2014 2012 2013 2014 - 19.4% - 8.6% - 2.5%- 1.4%
  • 10. Inventory of Active Listings Active Listings Single Family Year-Over-Year Change Condo/TIC/ Coop Year-Over-Year Change May-2013 484 -12.3% 641 -15.2% Jun-2013 467 -10.7% 655 -9.3% Jul-2013 454 -10.6% 611 -8.9% Aug-2013 464 -7.8% 588 -6.8% Sep-2013 500 -16.5% 717 -4.7% Oct-2013 489 -10.4% 636 -11.2% Nov-2013 388 -12.4% 500 -16.9% Dec-2013 266 -16.1% 327 -20.2% Jan-2014 311 -7.7% 452 -9.8% Feb-2014 317 -16.6% 475 -17.5% Mar-2014 306 -24.4% 439 -28.6% Apr-2014 285 -35.8% 428 -35.2% 12-Month Avg* 394 -14.9% 539 -15.0% Historical Inventory of Active Listings by Month The number of properties available for sale in active status at the end of a given month. * Active Listings for all properties from May 2013 through April 2014. This is not the average of the individual figures above. Current as of May 12, 2014. All data from the San Francisco MLS. Powered by 10K Research and Marketing. | Click for Cover Page | 10 582 744 444 661 285 428 Single Family Condo/TIC/Coop April 200 400 600 800 1,000 1,200 1,400 1,600 1-2005 1-2006 1-2007 1-2008 1-2009 1-2010 1-2011 1-2012 1-2013 1-2014 Single Family Condo/TIC/Coop 2012 2013 2014 - 35.2%- 11.2%- 35.8%- 23.7% 2012 2013 2014 - 25.8% - 37.7%
  • 11. % of Properties Sold Over List Price % of Properties Sold Over List Price Single Family Year-Over-Year Change Condo/TIC/ Coop Year-Over-Year Change May-2013 77.8% +33.0% 67.6% +41.4% Jun-2013 80.1% +24.0% 71.8% +49.0% Jul-2013 78.1% +23.8% 73.3% +72.1% Aug-2013 75.2% +13.8% 66.0% +45.1% Sep-2013 78.7% +14.6% 68.6% +29.2% Oct-2013 80.8% +23.4% 67.8% +11.7% Nov-2013 77.5% +16.5% 62.5% +14.9% Dec-2013 65.1% +5.5% 54.1% +17.1% Jan-2014 64.9% +1.4% 43.5% +9.6% Feb-2014 75.8% +4.3% 69.2% +26.0% Mar-2014 77.6% +3.6% 72.5% +14.9% Apr-2014 85.5% +7.3% 72.5% +7.7% 12-Month Avg 76.9% +15.1% 66.7% +27.5% Historical % of Properties Sold Over List Price by Month Percentage found when dividing the number of properties sold by properties sold over its original list price, not accounting for seller concessions. * % of Properties Sold Over List Price for all properties from May 2013 through April 2014. This is not the average of the individual figures above. Current as of May 12, 2014. All data from the San Francisco MLS. Powered by 10K Research and Marketing. | Click for Cover Page | 11 61.5% 38.0% 79.7% 67.3% 85.5% 72.5% Single Family Condo/TIC/Coop April 0.0% 20.0% 40.0% 60.0% 80.0% 100.0% 1-2005 1-2006 1-2007 1-2008 1-2009 1-2010 1-2011 1-2012 1-2013 1-2014 Single Family Condo/TIC/Coop 46.9% 35.3% 73.5% 58.9% 77.1% 66.5% Single Family Condo/TIC/Coop Year to Date 2012 2013 2014 + 7.7%+ 77.1%+ 7.3%+ 29.6% + 66.9%+ 4.9%+ 56.7% + 12.9% 2012 2013 2014 2012 2013 2014 2012 2013 2014 + 43.4% + 25.4% + 59.0%+ 77.6%
  • 12. % of List Price Received % of List Price Received Single Family Year-Over-Year Change Condo/TIC/ Coop Year-Over-Year Change May-2013 111.3% +6.1% 105.9% +3.9% Jun-2013 112.4% +7.3% 107.0% +5.5% Jul-2013 109.6% +3.9% 106.8% +5.1% Aug-2013 110.1% +4.1% 105.5% +3.4% Sep-2013 109.8% +2.7% 105.8% +3.5% Oct-2013 110.2% +4.8% 105.5% +1.8% Nov-2013 108.7% +2.2% 105.0% +2.4% Dec-2013 106.9% +2.2% 103.4% +1.8% Jan-2014 107.6% +1.4% 103.0% +1.7% Feb-2014 110.2% +1.7% 106.2% +2.3% Mar-2014 112.0% +1.9% 108.5% +3.4% Apr-2014 115.1% +3.0% 108.8% +2.9% 12-Month Avg* 110.4% +3.6% 106.1% +3.2% Historical % of List Price Received by Month Percentage found when dividing a property’s sales price by its most recent list price, then taking the average for all properties sold in a given month, not accounting for seller concessions. * % of List Price Received for all properties from May 2013 through April 2014. This is not the average of the individual figures above. Current as of May 12, 2014. All data from the San Francisco MLS. Powered by 10K Research and Marketing. | Click for Cover Page | 12 103.6% 100.8% 111.7% 105.7% 115.1% 108.8% Single Family Condo/TIC/Coop April 101.6% 100.1% 109.3% 104.3% 111.7% 107.0% Single Family Condo/TIC/Coop Year to Date 95.0% 100.0% 105.0% 110.0% 115.0% 120.0% 1-2005 1-2006 1-2007 1-2008 1-2009 1-2010 1-2011 1-2012 1-2013 1-2014 Single Family Condo/TIC/Coop 2012 2013 2014 + 2.9%+ 4.9%+ 3.0%+ 7.8% 2012 2013 2014 + 3.5% + 2.4% 2012 2013 2014 + 2.6%+ 4.2%+ 2.2%+ 7.6% 2012 2013 2014 + 2.1% + 2.1%
  • 13. Housing Affordability Ratio Affordability Ratio Single Family Year-Over-Year Change Condo/TIC/ Coop Year-Over-Year Change May-2013 47 -25.4% 67 -15.2% Jun-2013 48 -23.8% 66 -16.5% Jul-2013 52 -20.0% 61 -25.6% Aug-2013 48 -26.2% 63 -19.2% Sep-2013 49 -30.0% 63 -16.0% Oct-2013 51 -15.0% 61 -19.7% Nov-2013 51 -17.7% 67 -10.7% Dec-2013 49 -19.7% 69 -16.9% Jan-2014 47 -29.9% 53 -30.3% Feb-2014 42 -31.1% 54 -28.0% Mar-2014 45 -15.1% 53 -23.2% Apr-2014 40 -20.0% 56 -17.6% 12-Month Avg* 48 -35.2% 62 -26.4% Historical Housing Affordability Ratio by Month This index measures housing affordability for the region. An index of 120 means the median household income is 120% of what is necessary to qualify for the median-priced home under prevailing interest rates. A higher number means greater affordability. * Affordability Ratio for all properties from May 2013 through April 2014. This is not the average of the individual figures above. Current as of May 12, 2014. All data from the San Francisco MLS. Powered by 10K Research and Marketing. | Click for Cover Page | 13 63 78 50 68 40 56 Single Family Condo/TIC/Coop April 30 40 50 60 70 80 90 100 1-2005 1-2006 1-2007 1-2008 1-2009 1-2010 1-2011 1-2012 1-2013 1-2014 Single Family Condo/TIC/Coop 2012 2013 2014 - 17.6%- 12.8%- 20.0%- 20.6% 2012 2013 2014 0.0% + 5.4% 70 84 58 71 44 54 Single Family Condo/TIC/Coop Year to Date 2012 2013 2014 - 23.9%- 15.5%- 24.1%- 17.1% 2012 2013 2014 + 7.7% + 7.7%
  • 14. Months Supply of Inventory Months Supply Single Family Year-Over-Year Change Condo/TIC/ Coop Year-Over-Year Change May-2013 2.2 -15.4% 2.4 -27.3% Jun-2013 2.1 -16.0% 2.5 -19.4% Jul-2013 2.0 -16.7% 2.3 -17.9% Aug-2013 2.1 -8.7% 2.2 -15.4% Sep-2013 2.2 -21.4% 2.6 -13.3% Oct-2013 2.2 -12.0% 2.3 -17.9% Nov-2013 1.8 -10.0% 1.8 -21.7% Dec-2013 1.2 -14.3% 1.2 -25.0% Jan-2014 1.4 -6.7% 1.6 -15.8% Feb-2014 1.4 -22.2% 1.7 -22.7% Mar-2014 1.4 -26.3% 1.6 -30.4% Apr-2014 1.3 -38.1% 1.5 -40.0% 12-Month Avg* 1.8 -16.7% 2.0 -22.3% Historical Months Supply of Inventory by Month The inventory of homes for sale at the end of a given month, divided by the average monthly pending sales from the last 12 months. * Months Supply for all properties from May 2013 through April 2014. This is not the average of the individual figures above. Current as of May 12, 2014. All data from the San Francisco MLS. Powered by 10K Research and Marketing. | Click for Cover Page | 14 2.7 3.3 2.1 2.5 1.3 1.5 Single Family Condo/TIC/Coop April 0.0 2.0 4.0 6.0 8.0 10.0 1-2005 1-2006 1-2007 1-2008 1-2009 1-2010 1-2011 1-2012 1-2013 1-2014 Single Family Condo/TIC/Coop 2012 2013 2014 - 40.0%- 24.2%- 38.1%- 22.2% 2012 2013 2014 - 32.5% - 44.1%
  • 15. All Properties Activity Overview Key metrics by report month and for year-to-date (YTD) starting from the first of the year. Key Metrics Historical Sparkbars 4-2013 4-2014 Percent Change YTD 2013 YTD 2014 Percent Change Current as of May 12, 2014. All data from the San Francisco MLS. Powered by 10K Research and Marketing. | Click for Cover Page | 15 Months Supply 2.3 1.4 - 39.1% -- -- -- Affordability Ratio 51 40 - 21.4% % of List Price Received 108.2% 111.3% + 2.9% 106.5% 55 70.8% + 8.6% + 2.3% 42 - 23.7% 108.9% % of Properties Sold Over List Price 72.6% 77.8% + 7.2% 65.2% Active Listings 1,105 713 - 35.5% -- Average Sales Price $1,139,271 $1,274,688 + 11.9% $1,055,608 Days on Market 38 33 - 13.2% 44 $963,750 + 16.5% + 15.5% 37 - 15.9% $1,218,987 -- -- Sold Listings 525 513 - 2.3% 1,655 1,639 - 1.0% Median Sales Price $899,000 $975,000 + 8.5% $827,000 - 12.4% Pending Sales 551 489 - 11.3% 1,758 1,736 - 1.3% New Listings 698 516 - 26.1% 2,363 2,070 4-2011 4-2012 4-2013 4-2014 4-2011 4-2012 4-2013 4-2014 4-2011 4-2012 4-2013 4-2014 4-2011 4-2012 4-2013 4-2014 4-2011 4-2012 4-2013 4-2014 4-2011 4-2012 4-2013 4-2014 4-2011 4-2012 4-2013 4-2014 4-2011 4-2012 4-2013 4-2014 4-2011 4-2012 4-2013 4-2014 4-2011 4-2012 4-2013 4-2014 4-2011 4-2012 4-2013 4-2014
  • 16. Activity by District SF District 1: Northwest (Sea Cliff, Lake, Jordan Park / Laurel Heights, Outer Richmond, Central Richmond, Inner Richmond, Lone Mountain) SF District 2: Central West (Outer Sunset, Central Sunset, Inner Sunset, Outer Parkside, Parkside, Inner Parkside, Golden Gate Heights) SF District 3: Southwest (Pine Lake Park, Lake Shore, Merced Manor, Stonestown, Lakeside, Merced Heights, Ingleside, Ingleside Heights, Oceanview) SF District 4: Twin Peaks W (Forest Hill (& Ext), W Portal, St Francis Wd, Balboa Terr, Mt Dav Manor, Ingleside Terr, Monterey Hts, Wstwd Pk & H'lnds, Shrwd Fst, Miraloma Pk, Dmnd Hts, Mdtwn Terr) SF District 5: Central (Haight Ashbury, Cole Vly / Prnssus Hts, Clarndn Hts, Corona Hts, Twin Pks, Glen Pk, Noe Vly, Eureka Vly / Dolores Hts, Mission Dolores, Duboce Trngl, Buena Vista / Ashbury Hts) SF District 6: Central North (Lower Pacific Heights, Anza Vista, Western Addition, North Panhandle, Alamo Square, Hayes Valley) SF District 7: North (Marina, Cow Hollow, Presidio Heights, Pacific Heights) SF District 8: Northeast (North Waterfront, North Beach, Russian Hill, Telegraph Hill, Nob Hill, Financial District / Barbary Coast, Downtown, Van Ness / Civic Center, Tenderloin) SF District 9: Central East (Yerba Buena, South Beach, South of Market, Mission Bay, Inner Mission, Potrero Hill, Central Waterfront / Dogpatch, Bernal Heights) SF District 10: Southeast (Outer Mission, Mission Terr, Excelsior, Portola, Bayview, Silver Terr, Hunters Pt, Candlestick Pt, Bayview Hts, Little Hollywood, Visitation Vly, Crocker Amazon) 4-2013 4-2014 + / – 4-2013 4-2014 + / – 4-2013 4-2014 + / – 4-2013 4-2014 + / – 4-2013 4-2014 + / – Single Family 1 SF District 1 41 24 -41.5% 22 20 -9.1% $1,521,500 $1,588,000 +4.4% 31 22 -29.1% 2.3 1.3 -43.6% 2 SF District 2 78 42 -46.2% 34 38 +11.8% $853,000 $1,060,000 +24.3% 22 42 +90.0% 2.4 1.0 -56.7% 3 SF District 3 36 27 -25.0% 19 14 -26.3% $668,000 $923,500 +38.2% 32 25 -23.4% 2.5 1.6 -36.1% 4 SF District 4 45 32 -28.9% 23 18 -21.7% $1,135,000 $1,312,500 +15.6% 52 26 -50.3% 1.6 1.2 -23.3% 5 SF District 5 50 33 -34.0% 34 32 -5.9% $1,605,000 $1,898,500 +18.3% 36 23 -35.3% 1.6 1.1 -31.3% 6 SF District 6 8 5 -37.5% 5 4 -20.0% $1,100,000 $1,958,000 +78.0% 48 14 -70.4% 1.8 1.3 -30.4% 7 SF District 7 32 23 -28.1% 13 8 -38.5% $2,950,000 $4,367,500 +48.1% 39 132 +234.8% 3.0 2.1 -29.8% 8 SF District 8 10 7 -30.0% 2 3 +50.0% $7,562,500 $2,750,000 -63.6% 46 62 +35.5% 3.5 3.2 -9.0% 9 SF District 9 42 15 -64.3% 31 25 -19.4% $1,010,000 $1,010,000 0.0% 30 35 +16.5% 2.0 0.7 -67.0% 10 SF District 10 102 77 -24.5% 39 45 +15.4% $545,000 $680,000 +24.8% 39 33 -15.9% 2.0 1.8 -12.2% Condo/TIC/Coop 1 SF District 1 33 21 -36.4% 12 17 +41.7% $810,500 $752,500 -7.2% 30 55 +82.5% 2.5 1.8 -29.6% 2 SF District 2 16 10 -37.5% 3 5 +66.7% $425,000 $775,888 +82.6% 14 30 +122.4% 3.2 2.2 -31.3% 3 SF District 3 3 4 +33.3% 4 3 -25.0% $415,000 $525,000 +26.5% 78 24 -68.6% 1.0 1.6 +61.5% 4 SF District 4 9 10 +11.1% 6 8 +33.3% $374,000 $546,500 +46.1% 123 21 -82.9% 2.0 1.8 -7.4% 5 SF District 5 79 59 -25.3% 45 45 0.0% $925,000 $959,000 +3.7% 31 26 -17.0% 2.0 1.4 -29.3% 6 SF District 6 60 35 -41.7% 33 25 -24.2% $841,000 $913,500 +8.6% 55 44 -19.1% 2.2 1.2 -46.7% 7 SF District 7 63 30 -52.4% 42 44 +4.8% $1,192,500 $1,385,000 +16.1% 30 32 +5.5% 2.1 1.0 -51.0% 8 SF District 8 134 87 -35.1% 54 41 -24.1% $923,000 $970,000 +5.1% 39 37 -3.5% 3.0 1.8 -38.4% 9 SF District 9 224 161 -28.1% 99 114 +15.2% $761,000 $875,000 +15.0% 35 29 -17.9% 2.5 1.6 -36.3% 10 SF District 10 40 11 -72.5% 5 4 -20.0% $310,000 $546,250 +76.2% 200 29 -85.4% 6.2 2.1 -66.9% Key metrics by report month for the districts of San Fransisco. Current as of May 12, 2014. All data from the San Francisco MLS. Powered by 10K Research and Marketing. | Click for Cover Page | 16 Active Listings Sold Listings Median Sales Price Days on Market Months Supply