SlideShare una empresa de Scribd logo
1 de 119
Descargar para leer sin conexión
Mineral Information
and Statistics for the
     BRIC countries
             1999–2008
British Geological Survey


Mineral Information and Statistics
for the BRIC countries
1999–2008

Authors: P E J Pitfield, T J Brown and N E Idoine

With the assistance of: L Noakes, I A Longhurst and A Hill
Additional statistics compiled by: T Bide and L Hetherington


Keyworth, Nottingham   British Geological Survey   2010
© NERC 2010 all rights reserved
First Published 2010


British Geological Survey

Keyworth, Nottingham NG12 5GG
0115 936 3100

Murchison House, West Mains Road, Edinburgh EH9 3LA
0131 667 1000

BGS London, Natural History Museum, Cromwell Road, London SW7 5BD
☎  020 7589 4090	                   Fax  020 7584 8270
☎  020 7942 5344/45	                e-mail:  bgslondon@bgs.ac.uk


The full range of Survey publications is available from the BGS Sales Desks at Nottingham, Edinburgh and London;
see contact details above or shop online at www.geologyshop.com

The London Information Office also maintains a reference collection of BGS publications, including maps, for consultation.

The Survey publishes an annual catalogue of its maps and other publications; this catalogue is available from any of the
BGS Sales Desks.

The British Geological Survey carries out the geological survey of Great Britain and Northern Ireland (the latter as an agency service for
the government of Northern Ireland), and of the surrounding continental shelf, as well as its basic research projects. It also undertakes
programmes of British technical aid in geology in developing countries as arranged by the Department for International Development.

The British Geological Survey is a component body of the Natural Environment Research Council.

All communications regarding the content of this publication should be addressed to the Head of Science, Minerals and Waste, British
Geological Survey, Keyworth, Nottingham NG12 5GG ☎ 0115 936 3495 Fax 0115 936 3446  E-mail minerals@bgs.ac.uk

The compilations presented in this book are copyright and may not be reproduced in any form without the permission of the Director, British
Geological Survey.


Front cover images

Brazil: Statue of Christ the Redeemer above Rio de Janeiro, taken by Mariordo, February 2006. Permission to use is given by a creative
commons licence (accessed June 2010 at http://en.wikipedia.org/wiki/File:Rio_de_Janeiro_Helicoptero_47_Feb_2006.jpg)

Russia: St Basil’s Cathedral, Red Square, Moscow, taken by Dror Feitelson, March 2010. Permission to use is given by a creative commons
licence (accessed June 2010 at http://en.wikipedia.org/wiki/File:Saint_Basil_Moscow_crop.jpg)

India: Taj Mahal, Agra, taken by Sandeep Dhirad, March 2004. Permission to use is given by a creative commons licence
(accessed June 2010 at http://en.wikipedia.org/wiki/File:Taj_Mahal_in_March_2004.jpg)

China: The Great Wall of China at Mutianyu, taken by Ahazan. The author has granted anyone permission to use this work for any purpose
(accessed June 2010 at http://en.wikipedia.org/wiki/File:Great_wall_of_china-mutianyu_4.jpg)

Copyright of cover images remains with the authors shown above.


                                                                       ii
Foreword
The term ‘BRIC’, used to refer to the four countries of Brazil, Russia, India and China (Figure 1), has become almost
synonymous with the rise of emerging economies in the global market. It originated with Mr Jim O’Neil, Chief Economist
of Goldman Sachs, in 2001 when he was looking to convey the increasing importance of globalisation and to express
the belief that the non-western world would become increasingly important to the global economy compared to the
‘established order’ dominated by the USA, Europe and Japan. At the time he predicted that the economies of the BRIC
countries would overtake the six largest western economies by 2041. This prediction has since been revised, first to
2039 and then to 2032. Although many critics still consider it to be no more than ‘marketing hype’, the ‘BRIC’ tag has
subsequently been widely used in relation to the rapid growth of emerging economies.


                                      Figure 1  The location of the BRIC countries.


In recent years the four BRIC countries have begun to appreciate the potential value of working together in their areas of
common interest in order to gain greater influence in the world. The four heads of state met in Russia in 2009 and have
recently met again in Brazil to discuss ways in which they could collaborate for their mutual benefit.

The economic growth of these four countries has been remarkable for the past decade, contributing 50 per cent of the
total global growth between 2000 and 2008. They have also coped better with the global economic crisis than many
more developed economies. China and India saw the growth in their gross domestic product (GDP) slow only slightly,
while Brazil’s economy stagnated but did not shrink. Only Russia amongst the four countries experienced a ‘recession’,
but even here growth is expected to return more strongly than for most western nations.


                                                             iii
A significant proportion of the growth in the BRIC economies has been driven by trade, which has created some concern
around the world relating to the increasingly large trade imbalances between them and more developed nations. This
trade includes large quantities of minerals and mineral-based products. Exports of minerals and mineral-based products
in 2008 amounted to 79 per cent, by value, of all exports from Russia (chiefly oil and gas), 41 per cent from India,
30 per cent from Brazil and 10 per cent from China. The latter probably hides the fact that many minerals are processed
or manufactured into other products within China and it is the finished goods that are exported.

The European Union (EU) is an important market for exports from the BRIC countries, particularly for Russia where the
EU’s 27 member states take 57 per cent of all Russia’s exports, by value. The EU is also important for Brazil (23 per cent
of exports), India (22 per cent of exports) and China (21 per cent of exports). By comparison the USA received only three
per cent of Russia’s exports, 14 per cent of Brazil’s, 12 per cent of India’s and 18 per cent of China’s exports, by value.

From a European perspective, the BRIC countries are equally important, being the source of origin for 31 per cent, by
value, of all imports to the EU. Of this 16 per cent were from China, 11 per cent from Russia and two per cent each from
Brazil and India. If the trade in minerals or minerals-based products are specifically considered, the BRIC countries are
the source of origin for 28 per cent of imports of these materials to the EU of which 23 per cent is from Russia, with one
per cent from India and two per cent each from Brazil and China.

Given that the EU is import-dependent for a major proportion of its supplies of many mineral commodities, the
importance of these imports should not be under-estimated. Within the EU there is no mine production, for example,
of antimony, cobalt, iodine, molybdenum or zirconium and consequently the EU is 100 per cent import-dependent for
supplies of these commodities. Furthermore, the EU produces less than 25 per cent of its requirement for several other
minerals and metals including bauxite, graphite, iron ore, tin and phosphate rock. The BRIC countries make essential
contributions to the EU supply of many of these materials. For example, Brazil provides 54 per cent of the EU’s imports of
iron ore and Russia provides 36 per cent of its imports of mined cobalt. China provides 63 per cent of the EU’s imports of
graphite and 28 per cent of its imports of antimony ores and concentrates.

In light of the current and likely increasing future importance of the BRIC economies, this report aims to present
production and trade data for each of the four countries between 1999 and 2008 relating to the majority of economically
important mineral commodities. It also provides some analysis of the 10 year trends and includes a synopsis of the main
physiographic, geological and demographic features of each country. In addition, the extent and locations of the major
reserves, producing districts and deposits are described, together with some indications of where expansions to these
are expected in the near future.

The statistical data presented are derived from the BGS World Mineral Statistics Database which contains data on more
than 70 mineral commodities, derived from numerous sources throughout the world and updated annually. The BGS holds
a historical dataset that dates back to 1913 for many mineral commodities, enabling trends to be analysed over long
time periods. The other information presented has been gathered from published reports, news articles and publically
available websites (as indicated under ‘Key information sources’ for each country).

Further information relating to the BGS World Mineral Statistics work can be found on the website:
www.mineralsUK.com


                                                              iv
Contents
Brazil				                           1

Russia				                           23

India				                            49

China				                            77


Explanatory Notes
The statistics in this publication are from the British Geological Survey’s World Mineral Statistics database.


Coverage
The World Mineral Statistics database covers the majority of economically important mineral commodities. For each
commodity constant efforts are made to ensure that as many producing countries as possible are reported. For some
commodities, where statistics on production are not publicly available, estimates are made. Users of this compilation
are advised that more statistical information than can be included in a publication of this nature is held in the British
Geological Survey files and is available for consultation. Historical data (from 1913 for many commodities) can be
obtained from the publication World Mineral Production and its pre-decessors entitled World Mineral Statistics and the
Statistical Summary of the Mineral Industry many editions of which are available to download from the BGS website:
www.mineralsUK.com.


Metals
Mine production of many metals is expressed in terms of metal content. This is clearly indicated in the tables, adjacent
to the unit used. For aluminium, cobalt, copper, iron, lead, nickel, tin and zinc, mine production and metal production are
shown in separate rows. Unless otherwise specified, metal production statistics relate to metal recovered from both
domestic and imported materials, whether primary or secondary, but exclude remelted material.


                                                              v
Exclusion of Warranty
Use by recipients of information provided by the BGS, is at the recipients’ own risk. BGS has taken care to ensure that
information provided is as free from error as is reasonably practical. In view of the disparate sources of information at
BGS’s disposal, including such material donated to BGS, that BGS accepts in good faith as being accurate, the Natural
Environment Research Council (NERC) gives no warranty, expressed or implied, as to the quality, accuracy, performance,
and merchantability of the information supplied, or to the information’s suitability for any use whether made known
to BGS or otherwise. NERC/BGS accepts no liability whatever in respect of loss, damage, injury or other occurrence
however caused.


Acknowledgements
Compilation of this volume of mineral statistics has been possible only by obtaining information from a very large
number of organisations throughout the world, chiefly home and overseas government departments and specialist
national or international authorities concerned with particular sectors of the minerals or metals industries. To all these
bodies the British Geological Survey expresses its grateful acknowledgement for the information made available,
whether in published form or provided by direct correspondence.

Particular acknowledgement is made to the Mines Departments and other government agencies of many countries
whose regular statements, yearbooks and other reports are worthy of direct consultations by readers in search of detail.

Specialist commodity organisations which have kindly allowed information to be reproduced include the International
Copper Study Group, the International Lead and Zinc Study Group, the International Nickel Study Group and the
International Fertilizer Industry Association Ltd. In a few instances, information on specific commodities has been
obtained directly from company sources. The co-operation of other members of the International Consultative Group on
Non-Ferrous Metal Statistics is also gratefully acknowledged.

Supplementary information is also obtained from publications dealing with a wider range of commodities such as
Société de l’Industrie Minérale, Annuaire Statistique Mondial des Minerais et Métaux; Mining Journal, Mining Annual
Review; World Bureau of Metal Statistics, World Metal Statistics and, Metallstatistik; publications of the Interstate
Statistical Committee of the CIS, the United States Geological Survey, and UN agencies.

In addition, information may have been obtained from the websites of the following organisations, statistical offices
and government departments: United Nations; International Iron and Steel Institute; Kimberley Process; World Nuclear
Association; Organisation of the Petroleum Exporting Countries; South East Asia Iron and Steel Institute; Instituto
Latinoamericano del Fierro y el Acero; Departamento Nacional De Producao Mineral, Brazil; Grupo Paranapanema, Brazil;
Agencia Nacional do Petroleo, Brazil; Brazilian Aluminium Association, China Mining Association; Energy Information
Administration, United States of America.


                                                             vi
Units
The Statistics shown in this volume are expressed in metric units. The following factors are given for converting to
non-metric units:

tonnes × 0.9842 = long tons
tonnes × 1.1023 = short tons
kilograms × 2.2046 = pounds
kilograms × 32.1507 = troy ounces
cubic metres × 35.3147 = cubic feet
1 tonne of crude petroleum equals on average 7 barrels of crude petroleum.
1 flask mercury = 34.5 kilograms
1 metric ton unit = 10 kilograms


Symbols
...	     figures not available
0	       quantity less than half unit shown
—	       nil
*	       estimated
BGS	     British Geological Survey


                                                            vii
Brazil
               Key facts
                       •	 Fifth largest country in the world, with a land area of 8.5 million square
                           kilometres.
                       •	 Dominated by the Amazon River basin containing nearly 20 per cent of
                           the world’s fresh water and about 30 per cent of its tropical forest.
                       •	 Fifth largest population in the world, totalling nearly 199 million.
                       •	 One of the fastest developing economies in the world, currently the ninth
                           largest on a GDP (PPP) basis.
                       •	 The world’s largest producer of niobium minerals and the second largest
                           producer of iron ore and bauxite.
                       •	 Iron ore production has increased by 90 per cent between 1999 and 2008
                           and exports of iron ore make the largest contribution to Brazil’s trade
                           surplus.
                       •	 The world’s largest reserves of niobium minerals, amounting to 93 per
                           cent of the total. Production of these minerals has increased by 500 per
                           cent in 10 years.
                       •	 Production of copper has increased by 600 per cent between 1999 and
                           2008, although it still produces less than two per cent of the world’s
                           total.
                       •	 Bauxite production has increased by 122 per cent in 10 years and in 2008
                           amounted to 28 million tonnes.
                       •	 One of the world’s fastest growing oil producers following the discovery
                           of significant offshore resources in 2007/08.


Brazil is the largest country in Latin America and is ranked fifth in the world by population (198 739 000: July 2009
estimate) and fifth by area (8 514 877 square kilometres). It occupies nearly half of South America and borders every
other South American country except Chile and Ecuador. It comprises four physiographic regions but is dominated by the
Amazon basin (about four million square kilometres) which holds nearly 20 per cent of the world’s fresh water and about
30 per cent of the world’s tropical forest (Figure 2).


                                                               1
VENEZUELA


                                                                                             SU
                                                                                                                                                                                                                      N


                                                                           GU


                                                                                               RI


                                                                                                              GU
                                                GUIANA


                                                                                                  NA
                                                                             YA


                                                                                                                 YA
                                              HIGHLANDS                                                                                                                     NORTH


                                                                                 NA


                                                                                                   ME
       COLOMBIA


                                                                                                                    NE
                                                                                                                                                                           ATLANTIC
                                                       Boa Vista                                                                                                            OCEAN
                                                                                                                          4
                                                                 2
                                                                                                                                       Macapá
 0º                                                                                                                                                                                                              Equator


                                                                                                                                                Belém
                                                                     Manaus                                                                                         São Luis
                                     a zo n
                                Am

                                                                                                                                                                                                     Fortaleza
                                              A M A Z O N
                                                                                                       3                                                           Teresina
                                                        B A S I N                                                                                                                                7
                                                                                                                                                                                                           8
                            1                                                                                                                                                                                         Natal
                                                                                                                                                               5
                                                                                                                                                                                                       9              João
                                                                                                                                                                       6
                                                                                                                                                                                                                      Possoa
         27                                       Porto Velho                                                                                                                                                         Recife
                                                                                                                                                                                                           10
                                                                           o Juruena


                                                                                                                                                                                                                Maceió
                                                                                                            Rio Xing u
 10º              Rio Branco                                                                                                           Palmas
                                                                                                                                                     20                                                          11
                                                 22                                                                                                                                    Aracaju             12
                                                                                             21
                                                                       Ri


       PERU                                                                                                                                                                             13


                                                                                                                                                                         N
                                BOLIVIA                                                                                                                                                              Salvador


                                                                                                                                                                         S
                                                                                                                                                                       A
                                                                                                                                                                       D
                                                                                                                                                                   L I

                                                                                                                                                                    N
 Topography                                                                                                                                     18
                    Coastline


                                                                                                                                                               L A
                    River                                                                   Chapada                             19


                                                                                                                                                              Z I
                    International Boundary                                                                                     Goiânia          BRASILIA                        14
                    State Boundary

                                                                                                                                                                   H
                                                                                                                                                          A
                                                                                                                                                                I G
                    Relief >500m
                                                                                                                                                          R

                                                                                                  23
                                                                                                                                                                                       15
                                                                                                                                                          B


                    Relief 0 - 500m
                                                                                                                                                              H


                                                                                               Campo Grande
 State capitals and population                                       20º                                                                                      Belo Horizonte
                                                                                                                                                                                       Vitoria
                    < 1 million                                                            PA N TA N A L
                    1 - 2 million                                                                                                          17
                    2 - 5 million                                                                                                                                          16
                                                                      PA R A G U AY                                                        São Paulo
                    > 5 million                                                                                                                                    Rio de Janeiro
                                                                                                                         24
 Brazilian States
                                   15 Espirito Santo
                                                                     ARG


  1    Amazonas                                                                                                               Curitiba
  2    Roraima                     16 Rio De Janeiro
                                                                      ENT


  3    Pará                        17 São Paulo                                                                                       25
                                                         ana


       Amapá                       18 Distrito Federal                                                                                                                                SOUTH
                                                                       INA


  4
                                                       Rio Par


       Maranháo                    19 Goiás                                                                                                                                          ATLANTIC
                                                                                  Ri o P


  5
                                   20 Tocantins                                                        26
  6    Piaui                                                                                                                                                                          OCEAN
                                                                                a r an a


  7    Ceará                       21 Matto Grosso                                                     Porto Algre
  8    Rio Grande Do Norte         22 Rondônia
                                                                     30º
  9    Paraiba                     23 Matto Grosso Do Sul

  10 Pernambuco                    24 Paraná
  11 Alagoas                       25 Santa Catarina
                                   26 Rio Grande Do Sul
                                                                                           U R U G U AY
  12   Sergipe                                                                                                                                                                               0              400km
  13   Bahia                       27 Acre
  14   Minas Gerais          70º                                       60º                                                      50º                                         40º                                         30º W


                                                                              Figure 2  Brazil geography.


Brazil has transformed its economic performance over the last 15 years into one of the fastest developing economies in
the world. Gross domestic production (GDP) in 2008 was US$1990 billion with a growth rate of 5.1 per cent in 2008. This
growth slowed considerably in 2009, as a result of the global recession, but was estimated to be 0.1 per cent for the
year as a whole. On the basis of GDP purchasing power parity (PPP) Brazil is currently the ninth largest economy in the


                                                                                                             2
world. Brazilian mineral production, excluding hydrocarbons, reached US$23.2 billion in 2008, an increase of 17 per cent
on 2007. Mineral ores accounted for 11 per cent and metallurgical products 12 per cent of total exports.

Brazil is the world’s largest producer of niobium and the second largest producer of iron ore, bauxite and tantalum. Other
top 10 world rankings are shown in Table 1, together with the proportion of the world’s total of each mineral that is
produced in Brazil.


 Commodity                World rank       Percent of total Commodity                 World rank       Percent of total
                                           world production                                            world production
 Niobium                  1                95                    Aluminium            6                4
                                                                 (primary)
 Tantalum                 2                19                    Phosphate rock       6                4
 Iron ore                 2                17                    Pig iron             6                4
 Bauxite                  2                13                    Magnesium metal      6                1
                                                                 (primary)
 Rare earth minerals 2                     1                     Talc                 7                5
 Asbestos                 3                13                    Chromium ores &      7                3
                                                                 concentrates
 Alumina                  3                10                    Tin (smelter)        7                3
 Graphite                 3                4                     Zirconium minerals   7                2
 Kaolin                   4                10                    Salt                 8                3
 Cobalt (mine)            4                7                     Lithium minerals     8                2
 Manganese ore            5                8                     Magnesite            8                2
 Tin (mine)               5                5                     Bentonite            9                3
 Vermiculite              5                4                     Steel (crude)        9                3
 Beryl                    5                0.1                   Nickel (mine)        10               4
 Sillimanite              5                0.1                   Tungsten (mine)      10               1
 minerals


               Table 1  Brazil’s top 10 world rankings by commodity, with proportion of world total produced.


The location of selected major mines and important deposits are shown in Figure 3. Many mines and deposits are
clustered together in the Carajás, Corumbá and Quadrilátero Ferrifero districts and are not necessarily shown individually
for reasons of clarity.


                                                             3
VENEZUELA                                                                                                                                                   N


                                                                         GU
                                                                           YA
                                                                               NA


                                                                                        SU
                                                                                         RI

                                                                                                    GU
                                                                                                                                                                NORTH


                                                                                          NA


                                                                                                     YA
                                                           N O RT H A M A Z ON
                                                                                                                                                               ATLANTIC


                                                                                               ME
      COLOMBIA                                                  C R ATON


                                                                                                        NE
                                                                                                                        Amaparl
                                                                                                                          Au                                    OCEAN

                                                                                               Amapa
                                                                                                Fe                                Vila Nova
                                                                                                                                      Cr
0º                                                                                                                                                                                   Equator
                                                                                    Trombetas-                                       Paragominaes
                                                                      Pitinga        Oriximiná                                            Al
                                                                     Sn-Ta-Nb            Al
                                              Seis Lagos
                                              Nb±REE±Ti
                                                                                                 Juruti
                                                                                                   Al
                                                                                                             Sossego
                                                                                                              Cu-Au         Buritirama
                                                                                                                               Mn
                       A    M        A    Z    O       N   A S
                                                                                                                                     Serra Pelada
                                                                                      Vale-Northern system                            Au-Pd-Pt
                                 B       A S       I   N                                         Carajás Fe
                                                                                                                                       Azul                        Barra Verde
                                                                                      Pallio                                           Mn                              W                 Guaju
                             Santa Barbara                                                                                                                                                Ti
                                  Sn                                                  Cu-Au      Onça        Vermelho
                                                                                                 Puma           Ni                                              Contezeiro
                                                                       S O U T H E R N            Ni                                                               Cr
                                                                                                                                                                          Caraiba
                                                                         A M A Z O N                                                                   Jacobina             Cu
                                                                         C R A T O N                                                                      Au

10º                                                                                                                                                                 Iqueira
                                                                                                                                                                      Cr

                                                                                                                                                                              Fazenda Brasileiro
                                                                                                              Codemin       São Desiderio       Pedra Preta                          Au
      PERU                                                                                                       Ni              Mn                 Mn      S Ã O
                            BOLIVIA                                                   Campos Verdes                                              F R A N C I S C O        C R A T O N
                                                                                                               Chapada
                                                                                        Emerald                 Cu-Au                                                       Santa Rita
                                                   São Francisco                                                                    Niquelândia                                Ni
                                                        Au                                          Crixas Au                          Ni-Fe
                                                                                                                                                             Pedra Preta
                           70º                                                        Chapada                                                                    Cr
                                                                                             Barro Alto BRASILIA        Paracatu
                                                                                                 Ni                        Au        Itamarati de       Caetité
                                                                                                                                       Minas Al             U
                                                                                                      Morro Agudo
 Topography                                                                                               Zn/Pb                     Duas Barras
                                                              Monte Cristo
               Coastline                                      Cu-Zn-Au-Ag                        Vazanite                Turmalina                    E S P I R I T                            U
                                                                                                     Zn                     Au
               River                                                             Corumbá
                                                                                                              Catalão Nb
                                                                                                                                      Vale-Southern      S A N T O
               International Boundary                                            system
                                                                                                             Araxá Nb
                                                                                                                                      system               B A S I N
                                                                   Mine 63                                                            Quadrilátero
               State Boundary                                         Fe                                                              Ferrifero
                                                               20º                                  Fortaleza de Minas                Fe
                                                                   Urucum                                   Ni
  Major capitals and population                                     Fe-Mn                                                                        C A M P O S
                                                                                                               Pocos de            Mirai
               < 5 million                                                              P A R A N A           Caldas Al    Mibra    Al             B A S I N
                                                                                                                            Ta
               > 5 million                                                               B A S I N             MMN Mn-Fe
                                                                      PA R A G U AY                           Morra da Mina
                                                                                                                   Mn                           Capao do Lana
  Geology                                                                                                                                          (Topaz)

               Phanerozoic                                                                                                                 S A N T O S
                                                              ARGENTINA                                                                     B A S I N
               Orogenic Belt                                                                                                               (Tupi, Lara, Jupiter
                                                                                                                                           & Guara oil fields)
               Craton
                                                                                                                                  Cantao
                                                                                                          Trevo
                                                                                                                                                                   SOUTH
               Oil basin                                                                                                          Esperanca
                                                                                                                                  Fontanella                      ATLANTIC
  Mineral                                                                                        Recreio                      Verdinho                             OCEAN
                                                               30º
               Base Metal                                                                           Candiota
               Precious Metal
               Uranium
                                                                                     U R U G U AY                                                                     0             400km
               Diamond
               Gemstone
               Coal
                                                                         60º                                      50º                                    40º                             30º W


                                     Figure 3  Selected major mines and important mineral deposits in Brazil.

                   Notes: Certain mines and/or deposits mentioned in the text have been omitted for clarity.
       Fe = iron ore, Au = gold, Sn = tin, Ta = tantalum, Nb = niobium, REE = rare earth elements, Ti = titanium, Cu = copper,	
             Ni = nickel, Mn = manganese, Pd = palladium, Pt = platinum, Al = aluminium, W = tungsten,Cr = chromium, 	
                                             U = uranium, Zn = zinc, Pb = lead, Ag = silver


                                                                                                    4
Iron ore
Brazil has around 6.7 per cent of the world’s iron ore resources and 10 per cent of the world’s reserves. Production rose
from 354.7 million tonnes in 2007 to 368.8 million tonnes in 2008; an increase of four per cent and a continuation of
a longer term trend (Figure 4). Iron ore exports rose to 282 million tonnes in 2008 (Figure 4), worth US$16.5 billion, an
increase of 4.5 per cent by volume and 57 per cent by value compared to 2007. This is more than the growth in value
of Brazil’s total exports which grew by 23 per cent. Iron ore exports made up 90 per cent of the total value of mineral
exports in 2008 and now represent 8.4 per cent of the total value of Brazilian exports. Iron ore continues to be the
product that makes the largest contribution to Brazil’s trade surplus. Exports went to 39 countries with China taking
almost 30 per cent by value.


                          400

                          350

                          300

                          250
         Million tonnes


                          200

                          150

                          100

                           50

                            0
                             1999      2000     2001       2002       2003       2004     2005       2006   2007   2008

                                                       Iron ore production              Iron ore exports


                                    Figure 4  Brazil’s production and exports of iron ore from 1999 to 2008.


Three companies account for more than 90 per cent of Brazilian production: Vale (293 million tonnes), Cia Siderúrgica
Nacional (about 29 million tonnes) and Samarco Mineração SA (17 million tonnes).

Vale (previously known as CVRD) is expanding production at Carajás to 110 million tonnes per year for the second half of
2009 and to 140 million tonnes per year in the first half of 2011. The Carajás District has known reserves of about
18 billion tonnes at 65.4 per cent iron. Rio Tinto is to sell its Corumbá operation to Vale. A feasibility study to expand
mine production from two million tonnes per year to ten million tonnes per year is nearing completion.

Samarco (Vale 50 per cent and BHP Billiton 50 per cent) increased production by 20 per cent in 2008 to 18.5 million
tonnes of pellets. With the start of operations at a third pellet plant Samarco’s capacity grew to 21.7 million tonnes per
year in 2009.


                                                                             5
Cia Siderúrgica Nacional (CSN) owns the Casa de Piedra and Pedreira da Bocaina iron mines. Casa de Piedra produced
17 million tonnes in 2008 and should reach 19 million tonnes in 2009. Namisa mine (CSN 60 per cent, six Japanese steel
makers 40 per cent) is currently under development. By the end of 2013 Namisa, Casa de Piedra and neighbouring mines
should provide 13 million tonnes, 20 million tonnes and about six million tonnes respectively to bring the total output to
39 million tonnes.

MMX Mineração & Metálicos SA (EBX Group) sold Amapa and Minas-Rio to Anglo American in late March 2008; the
new subsidiary is renamed IronX. Minas-Rio will begin production in the first half of 2010 with a capacity of
26.5 million tonnes per year. MMX Corumba (6.3 million tonnes per year) and MMX Sudeste, represent a total installed
capacity of 10.8 million tonnes per year of iron ore which can be expanded to 40 million tonnes per year. The MMX
Sudeste system comprises Serra Azul and the greenfield site of Bom Sucesso in Minas Gerais State. Iron ore production
from Serra Azul in 2008 was 4.3 million tonnes and is expected to rise to 16.7 million tonnes per year in 2012. Bom
Sucesso start-up is planned for 2012 with an output of 17.4 million tonnes per year.

Bahia Mineração Ltda. intends to construct a mine and plant at Pedra de Ferro near Caetité on Bahia State. Production is
planned to start in the fourth quarter of 2011 at 15 million tonnes per year, expanding to 25 million tonnes per year.


Manganese
Brazil has about 7.6 per cent of the world’s reserves and 1.1 per cent of the total world resources of manganese ore.
Brazil’s production for 2008 stood at 3.21 million tonnes of manganese ore and 387 900 tonnes of manganese ferroalloys.

Vale (CVRD) is one of the world’s largest manganese ore producers and a leading player in the global manganese and
ferroalloy market. It owns and operates four manganese mines within Brazil (Azul, Urucum, Morro da Mina and MMN)
and seven ferroalloy plants (including four under RDM, Urucum Mineracao, RDME in France and RDMN in Norway).
Production at the Azul Mine in the Carajás Complex, Para State, Vale’s largest manganese mine, was just over two
million tonnes in 2008 but this decreased by 31 per cent in 2009.


Nickel
Brazil is estimated to have 6.3 per cent of the world’s nickel reserves (ranked sixth in the world) and 5.5 per cent of the
overall nickel resources (ranked seventh). Mined nickel production for 2008 at 58 500 tonnes was virtually the same
as for 2007, but 29 per cent lower than the peak in 2006 (Figure 5). However, with the commissioning of several new
mines, output is set to increase substantially. Smelter/refinery production of nickel amounted to 36 000 tonnes in 2008,
a small increase on 2007 (Figure 5). Exports of nickel matte increased to 14 970 tonnes, worth US$106 million. Exports of
electrolytic nickel decreased to 10 292 tonnes, worth US$203.5 million.


                                                              6
90

                          80

                          70

                          60
        Thousand tonnes


                          50

                          40

                          30

                          20

                          10

                           0
                           1999   2000     2001       2002     2003    2004      2005        2006       2007       2008

                                   Mine production of nickel               Smelter/refinery production of nickel


                                   Figure 5  Brazil’s production of nickel between 1999 and 2008.


The Vale-owned, Vermelho lateritic nickel mine project in the Carajás region of Pará State started production in
September 2008 with a capacity of 45 000 tonnes per year nickel and 2800 tonnes per year cobalt. Vale has postponed
completion of its 58 000 tonnes per year Onça Puma nickel laterite project till January 2010.

Mirabela Nickel Ltd. commenced mining the Santa Rita nickel sulphide deposit in Bahia State at the beginning of
August 2009. The plant is expected to produce 18 500 tonnes per year of nickel in concentrate increasing to
26 000 tonnes per year by September 2010.

Votorantim Group, which owns the Niquelândia Mine in Goiás State with a current production of 17 000 tonnes per
year, has begun a new ferro-nickel production unit in Niquelândia with completion expected in the first half of 2010.
With this new plant, production will reach 40 000 tonnes per year of electrolytic nickel and nickel in ferro-nickel.

First production at Anglo American’s 36 000 tonnes per year Barro Alto nickel project (117 million tonnes at
1.5 per cent nickel) in Goiás State is expected in the second quarter of 2011.


Tin, tantalum and niobium
Brazil has the world’s fourth largest reserves of tin (9.64 per cent) and between 16–22 per cent of the global resources
of tin. It has by far the largest known global reserves of niobium and tantalum accounting for up to 93 and 68 per cent
respectively.

Brazil produced 13 000 tonnes of mined tin in 2008, a small increase compared to recent years. Smelter production of tin
also increased from just under 10 000 tonnes in 2007 to 11 000 tonnes in 2008. Brazil’s output of pyrochlore (containing


                                                                  7
niobium) increased by 16 per cent in 2008 compared to 2007, continuing an upward trend that has amounted to nearly
500 per cent over ten years (Figure 6).


                            300


                            250


                            200
          Thousand tonnes


                            150


                            100


                             50


                              0
                                  1999   2000     2001     2002      2003      2004      2005     2006     2007       2008

                                                                    Production of pyrochlore


                            Figure 6  Brazil’s production of pyrochlore (containing niobium) between 1999 and 2008.


Pitinga mine produced 6257 tonnes of tin in concentrate in 2008 as well as niobium/tantalum ferroalloy
(200 000 pounds of contained Ta2O5). Peru’s Minsur, who acquired the mine at the end of 2008, is currently looking into
exploiting the substantial heavy rare earth (HRE) resources at Pitinga. Mibra owned by the Metallurg Group produces
100 000 pounds per year of Ta2O5.

Companhia Brasileira de Metalurgia e Mineração (CBMM), the world leader in niobium production, accounted
for 78.3 per cent of the Brazilian production of niobium concentrate and Mineração Catalão de Goiás Ltda
(a subsidiary of Anglo American PLC) supplied the remainder. CBMM-owned Araxá niobium-tantalum mine in Minas
Gerais State, is the world’s largest known niobium deposit with total resources of 11.5 million tonnes of Nb2O5, and has
the capacity to produce 84 000 tonnes per year of niobium in concentrate.

Copper and gold
Brazil, with three per cent of world copper reserves, contributed 1.4 per cent to the world’s total mined copper production
in 2008, and in 2007 changed from being a net importer to a net exporter of copper ores and concentrates. Brazil
produced 216 000 tonnes of mined copper in 2008, an increase of five per cent on 2007 but an increase of nearly 600 per
cent compared to 1999 (Figure 7).

Brazil has estimated reserves of gold amounting to 2 000 000 kilograms and produced 54 000 kilograms in 2008; an
increase of nine per cent compared to the previous year. Mining companies produced 39 800 kilograms with Garimpeiro


                                                                      8
(small-scale artisanal prospector and/or miner) operations accounting for the remainder. Gold exports rose by 3.2 per
cent to 37 000 kilograms worth US$1.03 billion.


                          250


                          200
        Thousand tonnes


                          150


                          100


                           50


                            0
                                1999   2000        2001     2002        2003   2004   2005       2006      2007   2008

                                              Mined copper production                 Refined copper production


                                        Figure 7  Brazil’s copper production between 1999 and 2008.


Sossego mine, located in an iron–oxide–copper–gold (IOCG) Mineral Province in Pará State, is owned by Vale and
is Brazil’s largest copper producer at 140 000 tonnes per year of copper and 3500 kilograms per year of gold. The
Paranapanema Group produced 25 000 tonnes of copper and the Chapada copper–gold mine in Goiás State, owned by
the Yamana Gold Inc., produced 48 000 tonnes of copper in 2007.

Vale is developing other IOCG deposits. The Salobo copper–gold project commissioning was postponed until the
beginning of 2010. Initial production capacity will be about 37 000 tonnes per year copper; which will be ramped up to
100 000 tonnes per year. Others include the Cristalino copper–gold deposit, Alemão copper–gold–rare earths–uranium
deposit and Igarapé Bahia copper–gold–rare earths–uranium deposit. Cristalino could produce 150 000 tonnes per year
of copper whilst Alemão and Igarapé would have a projected combined production of 186 000 tonnes per year of copper.
Total Vale production is expected to reach 368 000 tonnes of copper in 2010.

Brazil also has new gold mines and expansions which are expected to come on stream between 2009 and 2013.
AngloGold-Ashanti’s Cuiaba, Corrego do Sitio and Queiroz mines in Minas Gerais State together produced
9953 kilograms in 2008. Most of this output came from the Cuiaba deposit which has proven reserves of more than
200 000 kilograms of gold. The Corrego do Sitio project will produce 43 500 kilograms of gold over 14 years. Mining
started in mid 2007 with full production of 2800 kilograms per year to begin in 2012. The Serra Grande mine complex in
Goiás State, a 50:50 joint venture between AngloGold-Ashanti and the Kinross Gold Corporation, produced
2706 kilograms of gold in 2008.


                                                                          9
AngloGold-Ashanti acquired the São Bento Mine from the Eldorado Gold Corp. in December 2008. The Lamego mine
was commissioned in mid 2009 and is expected to produce 10 730 kilograms over nine years. Raposos mine, which
was mothballed in 1998, is to undergo development during 2009–2010 and production is expected to begin in 2011.
Kinross concluded an expansion project at the Paracutu mine in Minas Gerais State in November 2008 to start producing
13 000–18 000 kilograms per year of gold, up to three times its previous capacity of 5400 kilograms. It was expected to
produce approximately 11 000 kilograms in 2009.

The Canadian Yamana Gold Corp. produced gold from the Fazaenda Brasileiro and Jacobina mines in Bahia State, the
São Francisco mine in the Guapore Gold Belt and Chapada Gold and mine development at São Vincente providing total
production of 12 293 kilograms for 2008. Commercial production started at São Vincente in mid 2009. The production
target for Jacobina gold mine in 2009 is 3888 kilograms and, with expansion of plant capacity, this will increase to
4666 kilograms per year by 2011. The Santa Luz and Ernesto/Pau-a-Pique mines are expected to begin production in
2012 whilst a decision on the Pilar mine construction will be made in 2010.

The Canadian company Jaguar Mining Inc. is currently producing gold at its Sabara, Turmalina and Paciência mines.
In 2008 combined production totalled 3587 kilograms of gold. Turmalina is expected to produce between 2332 and
2448 kilograms in 2009 rising to 5754 kilograms in 2013. Paciência is expected to produce 2800 kilograms per year in
the years 2009–2011. Commissioning of the Caeté mine is expected to take place during the third quarter of 2010.


Bauxite, alumina and aluminium
Brazil has bauxite resources estimated at 4.3 billion tonnes and reserves estimated at 1.9 billion tonnes. Marketable
output of bauxite in 2008 grew by an estimated 10 per cent to 28 million tonnes. Between 1999 and 2008 Brazil’s
production of bauxite increased by 122 per cent (Figure 8). Exports in 2008 increased by 7.6 per cent by volume compared
to 2007 to 6.2 million tonnes. Alumina production has also increased significantly in Brazil, by 11 per cent in 2008
compared to 2007 and by 123 per cent between 1999 and 2008 (Figure 8).


                                                            10
30


                           25


                           20
          Million tonnes


                           15


                           10


                            5


                            0
                                1999   2000   2001       2002   2003      2004    2005       2006      2007       2008

                                               Bauxite          Alumina          Aluminium (primary)

                Figure 8  Brazil’s production of bauxite, alumina and primary aluminium between 1999 and 2008.


Mineração Rio Do Norte (MRN) produced 12.3 million tonnes of bauxite for the domestic market and six million tonnes for
export in 2008. The main deposits are Trombetas-Oriximiná and Paragominas mainly in Para State. Paragominas expanded
production to 9.9 million tonnes per year in April 2008 and refinery output is to be increased to 6.3 million tonnes per year
of alumina. Mirai mine, which is wholly owned by Companhia Brasileria de Aluminio (CBA), has an annual capacity of three
million tonnes per year bauxite and 470 000 tonnes per year of primary aluminium.

Alcoa commissioned the Juruti bauxite mine in September 2009. Initial output will be 2.6 million tonnes per year. The
expected mine life is 40–60 years. The bauxite will be shipped to the Alumar alumina refinery at São Luis, Maranhão
State which is being expanded from 2.1 million tonnes per year to 3.5 million tonnes per year capacity.


Vanadium
Canada’s Largo Resources Ltd is currently developing the Maracas Vanadium–PGM deposit in Bahia State with
155 million pounds of potential ferro-vanadium resources. Target production is set for the first quarter of 2011 with
a minimum annual production of 4500 tonnes of ferro-vanadium, equivalent to about six per cent of projected world
production. In May 2009 Largo purchased the Campo Alegre de Lourdes, the largest and richest known vanadium deposit
outside China.


Crude petroleum and natural gas
Brazil is one of the fastest growing oil producers with the discovery in 2007/08 of vast offshore resources. Production in
2008 increased by four per cent compared to the previous year continuing an upward trend amounting to a 69 per cent
increase in output between 1999 and 2008 (Figure 9).


                                                                  11
120


                           100


                            80
          Million tonnes


                            60


                            40


                            20


                             0
                             1999      2000     2001      2002     2003      2004       2005    2006      2007   2008

                                                                      Crude Petroleum

                                    Figure 9  Brazil’s production of crude petroleum between 1999 and 2008.


Estimates for the Tupi and Lara fields equate to 12.2 billion barrels. The Jupiter natural gas and condensate field in the
Santos Basin may equal the Tupi field in size. Current production of oil (two million barrels per day) and gas (52 million
cubic metres per day) is mostly derived from two major oil fields in the Campos Basin with confirmed reserves of 7.2 billion
barrels of oil and condensate and 101.5 cubic kilometres of natural gas. In November 2009 Petrobas announced additional
reserves of up to 25 million barrels from where extraction is expected to commence by August 2010.


Key information sources
Ferraz, CP. 2009. Booming Brazil. Mining Journal. 3 July 2009, p.15–18.
World Factbook – Brazil. https://www.cia.gov/library/publications/the–world-factbook/geos/br.html
USGS. Country and Commodity reports. http://minerals.usgs.gov/minerals/pubs/
www.alcoa.com/brazil/en/news/
www.anglogoldashanti.com/subwebs/                                            www.mbendi.com/facility/
www.bnamericas.com/news/mining/                                              www.mineweb.com/minerals/view/
www.commodityonline.com/news/                                                www.miningweekly.com/article/
www.dnpm.gov.br/assets/galeriaDocuments/                                     www.mirabela.com.au/
www.highbeam.com/                                                            www.reuters.com/article/
www.infomine.com/commodities/                                                www.vale.com/vale_us/cgi/
www.infomine.com/index/properties/                                           www.yamana.com/Operations/
www.im-mining.com/2009/                                                      www2.petrobas.com.br/Petrobas/
www.jaguarmining.com/
www.kinross.com/news-articles/2009/
www.largoresources.com/


                                                                      12
13
     Table 2  Mineral production in Brazil from 1999 to 2008 (continued).
14
     Table 2  Mineral production in Brazil from 1999 to 2008 (continued).
Table 2  Mineral production in Brazil from 1999 to 2008.


15
16
     Table 3  Mineral exports from Brazil between 1999 and 2008 (continued).
17
     Table 3  Mineral exports from Brazil between 1999 and 2008 (continued).
Table 3  Mineral exports from Brazil between 1999 and 2008.


18
19
     Table 4  Mineral imports to Brazil between 1999 and 2008 (continued).
20
     Table 4  Mineral imports to Brazil between 1999 and 2008 (continued).
21
     Table 4  Mineral imports to Brazil between 1999 and 2008.
22
Russia
              Key facts
                   •	 The world’s largest country, with a land area of more than 17 million square
                       kilometres or more than one eighth of the total land surface.
                   •	 The ninth most populous nation in the world, totalling 140 million.
                   •	 The world’s seventh largest economy on a GDP (PPP) basis.
                   •	 The Russian economy fell by nearly eight per cent in 2009 as a result of the global
                       recession, but previously had averaged a growth rate of seven per cent for a
                       decade.
                   •	 The world’s largest producer of nickel, natural gas and vanadium; also the world’s
                       second largest producer of crude petroleum, platinum group metals and primary
                       aluminium.
                   •	 The world’s fifth largest iron ore producer, with production increasing by 22 per
                       cent between 1999 and 2008.
                   •	 Production of bauxite and primary aluminium have both increased by 33 per cent in
                       10 years, with Russia now the eighth largest bauxite producer in the world.
                   •	 Nickel output has fallen slightly in recent years, and has risen by less than 10 per
                       cent since 1999, but Russia still produces nearly 20 per cent of the world’s total.
                   •	 The world’s third largest reserves of gold, with production increasing by 37 per
                       cent in 10 years.
                   •	 Supplies 70 per cent of the world’s palladium, despite output falling by 49 per cent
                       over 10 years; also 20 per cent of the world’s platinum, with an increase of 79 per
                       cent in the same period.
                   •	 The world’s largest producer of diamonds if measured by volume and second
                       largest if measured by value.
                   •	 Production of crude petroleum has increased by 60 per cent between 1999 and
                       2008, with natural gas output increasing by 18 per cent and coal by 31 per cent
                       over the same period.


The Russian Federation comprises the northern part of the Eurasian landmass and is the largest country in the world
with a total area of 17 098 000 square kilometres covering more than one eighth of the Earth’s land area. The country
comprises two vast plains: the eastern European plain and west Siberian plain, separated by the Ural Mountains. The
land rises to the Caucasus Mountains in the south-west and Sayan Mountains along the Mongolian border. It is the
largest of 12 republics that make up the Commonwealth of Independent States (CIS) (Figure 10).


                                                             23
Topography                                                                                             Relief                                         Cities and population                                                                                                               Chuckhi
                                                                                                                                                                                          80°N                                                                                                                                                                            N
                                                                         River                                                                                    > 1500m                                     > 4 Million
                                                                                                                                                                                                                                                                                                                                 Peninsula
                                                                          International Boundary
                                                                                                                                                                  500-1500m                                   1-4 Million                                                          ARCTIC OCEAN
                                                                         Federal District Boundary
                                                                         State/Republic Boundary                                                                  <500m                                       < 1 Million

                                                                                                                                                                                                                                                                             New                                                               84
                                                                                                                                                                                                                                                                           Siberian
                                             N O R W AY                                                                                                                                                                                                                    Islands
                                                                                                                                                                                                                                                                                                                                          ts
                                                                                                                                                                                         Novaya                                                                                                                                         aM              83
                                                                          DEN                                                                           BARENTS                                                                                              Taymyr                                                                                               BERING
                                                          E                                                                                                                              Zemlya
                                                       SW                                                                                                                                                                                                   Peninsula
                                                                                                                                                                                                                                                                                                                                     lym
                                                                                                                                                          SEA                                                                                                                                                                                                      SEA
                                                                                                                           D                    Murmansk
                                                                                                                                                                                                                                                                                                                                   Ko

                                                                                                                      N
                                                 ESTONIA
                                                                                                                 LA                       51
                                                                                                             N
                                    LITHUANIA                                                           FI                                                                                                                                            a Mts
                                                                                                                                                                                                                                                    ng                                                                                                                   160°E
                                                                                                                                                                                                                                              By rra                                                              CHERSKIY 76
                                    20°E
                                                                                                                 50                                                                                                                                                                                                RANGE Magadan
                                        85                                                                                                                                                                                               74
                                                      L AT V I A                          St Petersburg                                   48                                                                                                                                                                                                                        82
                                                                                              46                                                                                  52
                                                                      44                                           EUROPEAN                                                                                                                                                                             Far Eastern                                  Kamchatka
                                                                                    45
                                    BELARUS                                                              47          PLAIN                                                                                                        Noril’sk        CENTRAL SIBERIAN                                                                                   Peninsula
                                                                                    26
                                                                                                                    Northwestern                                                                                                                      P L AT E A U                              R. L
                                    Central                         25                   27                                                                                                                                                                                                              ena
                                                                                                    28
                                                                                                                                                        49
                                                                                    24


24
                                                                                                                                                                                                                                                                                               Yakutsk
                                                           17
                                                           23             23              MOSCOW 30                                                            ts       53                     58                                                 ircle                                  75
                                                                    20         21          29   Nizhniy Novgorod                                              M                                                                          Arctic C                                                                                                        Sakhalin
                                                                                                                                                                                                         Urals
                                                                                         22                                                        43                                                                                       Siberian
                                                                                                                                                                                                                                                                                                                         ts


                                                               15                                        31                                                                                                                                                                                                                                               Island
                                                                                                                                           Perm
                                                                                                                                                                                                                                                                                                                        M


                                                                           19


                                                                                                                                                                                                                                  R. Y
                                                                                                              Kazan


                                                                                                                                                         U ral
                                                                                                                                     42    41                                      R. O
                                                                                                                                                                                                                                                       73
                                                                                                        32                                         40         Yekaterinburg             b’                                                                                                                                                                   81
                                                                                                                                                                                                                                                                                                                    or


                                                               14                   18
                                                                                               33                          38        Vo l g a                                                                                                                                                                           v


                                                                                                                                                                                                                                      enin
                                                                         16
                                                                         13                                   34                                                                WEST                                                                                 72                                             o
                                    UKRAINE                                                                                                                                   SIBERIAN
                                                                                                                                                                                                                                                                                                               Stan
                                                                                                                                                                  56


                                                                                                                                                                                                                                      sey
                                                                                                                      35


     Figure 10  Russia geography.
                                                                    Rostov    lga                                                          Ufa                                                                                                                                                                                                  78
                                                                           Vo                                                              39
                                                                                                                                                                                PLAIN                                                                                                                                   77
                                                                                                                                                                             57
                                                        13
                                                                         R. 12                     36                 Samara                                                                             60                                      66                            s
                                                                                                                                37                      Chelyabinsk                                                                                                                      71
                                         7       Volgograd                                                                                                                                                                                                                                                                             Khabarovsk
                                                                                                                                                                       55                59
                                                                                                                                                   54
                                                  8                                                                                                                                                 61                                                                                                                                  79
                                                                                                                                                                                                                         Krasnoyarsk                                                                    70


                                        Ca
                                                                                               11                                                                                 Omsk
                                                                      9


                                          uc
                                                                                                                                                                                                                                                                      a y a n Mt


                                                      10                                                                                                                                      Novosibirsk                63                                Irkutsk                                                                                                 SEA


                                             as
                                    6                                                                                                                                                                                                                                  S                                                                                80
                                                                                                   Southern


                                               us
                                    40°E                                                                                                                                                                                              65                                  68                                                                                        OF


                                                  M
                                                                                                                                                                                                                                                                                               69


                                                   ts
                                         5                 2                                                                                                                                                       62                                                                                                                        Vladivostok          JAPAN
                                             4                 1                                                                                                                                                                              a-ola M ts


                                                                          EA
                                                 3
                                                                                                                                                                                                                                    nn


                                                                                                                                                                                                                                                      67                                                            CHINA
                                                                                                                                          K A Z A K H S TA N                                                                        Ta
                                            GEORGIA                                                                                                                                                                          64


                                                                     NS
                                        AZERBAIJAN
                                                                                                                                                                                                                                                                     Lake Baikal


                                                                   PIA
                                                                                                                                                                                                                                                                                                                                                              NORTH
                                                                                                                                                                                                                                                              MONGOLIA                                                                                        KOREA


                                                               CAS
                                    IRAN                                                                                                                                                                 80°E
                                                                                                                                                                                                                  CHINA                                                                             0                   1000km      120°E

                                     Republics, regions, districts & territories of the Russian Federation
                                        Southern Federal District
                                         1       Republic of Dagestan                                                                                        18    Tambovskaya oblast                                   35    Samarskaya oblast                                     52Nenetsky AO                                 67    Republic of Tyva
                                         2       Republic of Chechnya                                                                                        19    Lipetskaya oblast                                    36    Saratovskaya oblast                                   85 Kaliningradskaya oblast                    68    Ust-Ordynsky AO
                                         3       Republic of Ingushetia                                                                                      20    Orlovskaya oblast                                    37    Orenburgskaya oblast                                 Urals Federal District                         69    Aginsky Buryotsky AO
                                         4       Republic of North Osetia                                                                                    21    Tulskaya oblast                                      38    Republic of Tatarstan                                 53    Khanty-Mansiysky AO                     70    Chitinskaya oblast
                                         5       Republic of Kabardino-Balkaria                                                                              22    Ryazanskaya oblast                                   39    Republic of Bashkortostan                             54    Chelyabinskaya oblast                   71    Republic of Buryatia
                                         6       Republic of Karachaevo-Cherkessia                                                                           23    Kaluzhskaya oblast                                   40    Permskaya oblast                                      55    Kurganskaya oblast                      72    Irkutskaya oblast
Bric report
Bric report
Bric report
Bric report
Bric report
Bric report
Bric report
Bric report
Bric report
Bric report
Bric report
Bric report
Bric report
Bric report
Bric report
Bric report
Bric report
Bric report
Bric report
Bric report
Bric report
Bric report
Bric report
Bric report
Bric report
Bric report
Bric report
Bric report
Bric report
Bric report
Bric report
Bric report
Bric report
Bric report
Bric report
Bric report
Bric report
Bric report
Bric report
Bric report
Bric report
Bric report
Bric report
Bric report
Bric report
Bric report
Bric report
Bric report
Bric report
Bric report
Bric report
Bric report
Bric report
Bric report
Bric report
Bric report
Bric report
Bric report
Bric report
Bric report
Bric report
Bric report
Bric report
Bric report
Bric report
Bric report
Bric report
Bric report
Bric report
Bric report
Bric report
Bric report
Bric report
Bric report
Bric report
Bric report
Bric report
Bric report
Bric report
Bric report
Bric report
Bric report
Bric report
Bric report
Bric report

Más contenido relacionado

Similar a Bric report

Inb_304_Assignment_01_L.docx.pdf
Inb_304_Assignment_01_L.docx.pdfInb_304_Assignment_01_L.docx.pdf
Inb_304_Assignment_01_L.docx.pdfgajababa2
 
IS&amp;C CP 2012-2013
IS&amp;C CP 2012-2013IS&amp;C CP 2012-2013
IS&amp;C CP 2012-2013nicktiepolo
 
Cours Public 6: L’ANTHROPOCÈNE SERAIT-IL UN URBANOCÈNE? OU COMMENT L’URBANISA...
Cours Public 6: L’ANTHROPOCÈNE SERAIT-IL UN URBANOCÈNE? OU COMMENT L’URBANISA...Cours Public 6: L’ANTHROPOCÈNE SERAIT-IL UN URBANOCÈNE? OU COMMENT L’URBANISA...
Cours Public 6: L’ANTHROPOCÈNE SERAIT-IL UN URBANOCÈNE? OU COMMENT L’URBANISA...EcoleUrbaineLyon
 
Strat Managemnt Mcdonalds,Russia
Strat Managemnt Mcdonalds,RussiaStrat Managemnt Mcdonalds,Russia
Strat Managemnt Mcdonalds,Russiarinujust4u
 
REPORT ON CRITICAL RAW MATERIALS FOR THE EU
REPORT ON CRITICAL RAW MATERIALS FOR THE EUREPORT ON CRITICAL RAW MATERIALS FOR THE EU
REPORT ON CRITICAL RAW MATERIALS FOR THE EUecogisements_org
 
Impact of european union crisis on brazil
Impact of european union crisis on  brazilImpact of european union crisis on  brazil
Impact of european union crisis on brazilWasim Akram
 
Russia background info
Russia background info Russia background info
Russia background info jdmcd
 
Trends in the Mining and Metals Industry
Trends in the Mining and Metals IndustryTrends in the Mining and Metals Industry
Trends in the Mining and Metals IndustryDr Lendy Spires
 
Economy of Russia
Economy of RussiaEconomy of Russia
Economy of RussiaRishabh M
 
Atlantic basin iniciative presentación
Atlantic basin iniciative presentaciónAtlantic basin iniciative presentación
Atlantic basin iniciative presentaciónAlvaro Uribe V.
 
International business environment europe
International business environment europeInternational business environment europe
International business environment europeAnshul Aggarwal
 
Running Head Russian Economy Past, Present & Future Russian Ec.docx
Running Head Russian Economy Past, Present & Future Russian Ec.docxRunning Head Russian Economy Past, Present & Future Russian Ec.docx
Running Head Russian Economy Past, Present & Future Russian Ec.docxtodd521
 

Similar a Bric report (20)

Inb_304_Assignment_01_L.docx.pdf
Inb_304_Assignment_01_L.docx.pdfInb_304_Assignment_01_L.docx.pdf
Inb_304_Assignment_01_L.docx.pdf
 
IS&amp;C CP 2012-2013
IS&amp;C CP 2012-2013IS&amp;C CP 2012-2013
IS&amp;C CP 2012-2013
 
Brexit
BrexitBrexit
Brexit
 
Cours Public 6: L’ANTHROPOCÈNE SERAIT-IL UN URBANOCÈNE? OU COMMENT L’URBANISA...
Cours Public 6: L’ANTHROPOCÈNE SERAIT-IL UN URBANOCÈNE? OU COMMENT L’URBANISA...Cours Public 6: L’ANTHROPOCÈNE SERAIT-IL UN URBANOCÈNE? OU COMMENT L’URBANISA...
Cours Public 6: L’ANTHROPOCÈNE SERAIT-IL UN URBANOCÈNE? OU COMMENT L’URBANISA...
 
Strat Managemnt Mcdonalds,Russia
Strat Managemnt Mcdonalds,RussiaStrat Managemnt Mcdonalds,Russia
Strat Managemnt Mcdonalds,Russia
 
REPORT ON CRITICAL RAW MATERIALS FOR THE EU
REPORT ON CRITICAL RAW MATERIALS FOR THE EUREPORT ON CRITICAL RAW MATERIALS FOR THE EU
REPORT ON CRITICAL RAW MATERIALS FOR THE EU
 
Impact of european union crisis on brazil
Impact of european union crisis on  brazilImpact of european union crisis on  brazil
Impact of european union crisis on brazil
 
Russia background info
Russia background info Russia background info
Russia background info
 
Trends in the Mining and Metals Industry
Trends in the Mining and Metals IndustryTrends in the Mining and Metals Industry
Trends in the Mining and Metals Industry
 
Ipe12
Ipe12Ipe12
Ipe12
 
Economy of Russia
Economy of RussiaEconomy of Russia
Economy of Russia
 
Ipe14
Ipe14Ipe14
Ipe14
 
Atlantic basin iniciative presentación
Atlantic basin iniciative presentaciónAtlantic basin iniciative presentación
Atlantic basin iniciative presentación
 
USA-Russia Relations, Policy Recommendations Regarding How to Deal With Russia
USA-Russia Relations, Policy Recommendations Regarding How to Deal With RussiaUSA-Russia Relations, Policy Recommendations Regarding How to Deal With Russia
USA-Russia Relations, Policy Recommendations Regarding How to Deal With Russia
 
Gradipe07
Gradipe07Gradipe07
Gradipe07
 
Exploring Russia's Potential in its Non-resource Non-energy Exports to China ...
Exploring Russia's Potential in its Non-resource Non-energy Exports to China ...Exploring Russia's Potential in its Non-resource Non-energy Exports to China ...
Exploring Russia's Potential in its Non-resource Non-energy Exports to China ...
 
The Impact of ‘Brexit’ on Japanese International Trade in EU
The Impact of ‘Brexit’ on Japanese International Trade in EUThe Impact of ‘Brexit’ on Japanese International Trade in EU
The Impact of ‘Brexit’ on Japanese International Trade in EU
 
Pulses from brazil
Pulses from brazilPulses from brazil
Pulses from brazil
 
International business environment europe
International business environment europeInternational business environment europe
International business environment europe
 
Running Head Russian Economy Past, Present & Future Russian Ec.docx
Running Head Russian Economy Past, Present & Future Russian Ec.docxRunning Head Russian Economy Past, Present & Future Russian Ec.docx
Running Head Russian Economy Past, Present & Future Russian Ec.docx
 

Bric report

  • 1. Mineral Information and Statistics for the BRIC countries 1999–2008
  • 2.
  • 3. British Geological Survey Mineral Information and Statistics for the BRIC countries 1999–2008 Authors: P E J Pitfield, T J Brown and N E Idoine With the assistance of: L Noakes, I A Longhurst and A Hill Additional statistics compiled by: T Bide and L Hetherington Keyworth, Nottingham   British Geological Survey   2010
  • 4. © NERC 2010 all rights reserved First Published 2010 British Geological Survey Keyworth, Nottingham NG12 5GG 0115 936 3100 Murchison House, West Mains Road, Edinburgh EH9 3LA 0131 667 1000 BGS London, Natural History Museum, Cromwell Road, London SW7 5BD ☎  020 7589 4090 Fax  020 7584 8270 ☎  020 7942 5344/45 e-mail:  bgslondon@bgs.ac.uk The full range of Survey publications is available from the BGS Sales Desks at Nottingham, Edinburgh and London; see contact details above or shop online at www.geologyshop.com The London Information Office also maintains a reference collection of BGS publications, including maps, for consultation. The Survey publishes an annual catalogue of its maps and other publications; this catalogue is available from any of the BGS Sales Desks. The British Geological Survey carries out the geological survey of Great Britain and Northern Ireland (the latter as an agency service for the government of Northern Ireland), and of the surrounding continental shelf, as well as its basic research projects. It also undertakes programmes of British technical aid in geology in developing countries as arranged by the Department for International Development. The British Geological Survey is a component body of the Natural Environment Research Council. All communications regarding the content of this publication should be addressed to the Head of Science, Minerals and Waste, British Geological Survey, Keyworth, Nottingham NG12 5GG ☎ 0115 936 3495 Fax 0115 936 3446  E-mail minerals@bgs.ac.uk The compilations presented in this book are copyright and may not be reproduced in any form without the permission of the Director, British Geological Survey. Front cover images Brazil: Statue of Christ the Redeemer above Rio de Janeiro, taken by Mariordo, February 2006. Permission to use is given by a creative commons licence (accessed June 2010 at http://en.wikipedia.org/wiki/File:Rio_de_Janeiro_Helicoptero_47_Feb_2006.jpg) Russia: St Basil’s Cathedral, Red Square, Moscow, taken by Dror Feitelson, March 2010. Permission to use is given by a creative commons licence (accessed June 2010 at http://en.wikipedia.org/wiki/File:Saint_Basil_Moscow_crop.jpg) India: Taj Mahal, Agra, taken by Sandeep Dhirad, March 2004. Permission to use is given by a creative commons licence (accessed June 2010 at http://en.wikipedia.org/wiki/File:Taj_Mahal_in_March_2004.jpg) China: The Great Wall of China at Mutianyu, taken by Ahazan. The author has granted anyone permission to use this work for any purpose (accessed June 2010 at http://en.wikipedia.org/wiki/File:Great_wall_of_china-mutianyu_4.jpg) Copyright of cover images remains with the authors shown above. ii
  • 5. Foreword The term ‘BRIC’, used to refer to the four countries of Brazil, Russia, India and China (Figure 1), has become almost synonymous with the rise of emerging economies in the global market. It originated with Mr Jim O’Neil, Chief Economist of Goldman Sachs, in 2001 when he was looking to convey the increasing importance of globalisation and to express the belief that the non-western world would become increasingly important to the global economy compared to the ‘established order’ dominated by the USA, Europe and Japan. At the time he predicted that the economies of the BRIC countries would overtake the six largest western economies by 2041. This prediction has since been revised, first to 2039 and then to 2032. Although many critics still consider it to be no more than ‘marketing hype’, the ‘BRIC’ tag has subsequently been widely used in relation to the rapid growth of emerging economies. Figure 1  The location of the BRIC countries. In recent years the four BRIC countries have begun to appreciate the potential value of working together in their areas of common interest in order to gain greater influence in the world. The four heads of state met in Russia in 2009 and have recently met again in Brazil to discuss ways in which they could collaborate for their mutual benefit. The economic growth of these four countries has been remarkable for the past decade, contributing 50 per cent of the total global growth between 2000 and 2008. They have also coped better with the global economic crisis than many more developed economies. China and India saw the growth in their gross domestic product (GDP) slow only slightly, while Brazil’s economy stagnated but did not shrink. Only Russia amongst the four countries experienced a ‘recession’, but even here growth is expected to return more strongly than for most western nations. iii
  • 6. A significant proportion of the growth in the BRIC economies has been driven by trade, which has created some concern around the world relating to the increasingly large trade imbalances between them and more developed nations. This trade includes large quantities of minerals and mineral-based products. Exports of minerals and mineral-based products in 2008 amounted to 79 per cent, by value, of all exports from Russia (chiefly oil and gas), 41 per cent from India, 30 per cent from Brazil and 10 per cent from China. The latter probably hides the fact that many minerals are processed or manufactured into other products within China and it is the finished goods that are exported. The European Union (EU) is an important market for exports from the BRIC countries, particularly for Russia where the EU’s 27 member states take 57 per cent of all Russia’s exports, by value. The EU is also important for Brazil (23 per cent of exports), India (22 per cent of exports) and China (21 per cent of exports). By comparison the USA received only three per cent of Russia’s exports, 14 per cent of Brazil’s, 12 per cent of India’s and 18 per cent of China’s exports, by value. From a European perspective, the BRIC countries are equally important, being the source of origin for 31 per cent, by value, of all imports to the EU. Of this 16 per cent were from China, 11 per cent from Russia and two per cent each from Brazil and India. If the trade in minerals or minerals-based products are specifically considered, the BRIC countries are the source of origin for 28 per cent of imports of these materials to the EU of which 23 per cent is from Russia, with one per cent from India and two per cent each from Brazil and China. Given that the EU is import-dependent for a major proportion of its supplies of many mineral commodities, the importance of these imports should not be under-estimated. Within the EU there is no mine production, for example, of antimony, cobalt, iodine, molybdenum or zirconium and consequently the EU is 100 per cent import-dependent for supplies of these commodities. Furthermore, the EU produces less than 25 per cent of its requirement for several other minerals and metals including bauxite, graphite, iron ore, tin and phosphate rock. The BRIC countries make essential contributions to the EU supply of many of these materials. For example, Brazil provides 54 per cent of the EU’s imports of iron ore and Russia provides 36 per cent of its imports of mined cobalt. China provides 63 per cent of the EU’s imports of graphite and 28 per cent of its imports of antimony ores and concentrates. In light of the current and likely increasing future importance of the BRIC economies, this report aims to present production and trade data for each of the four countries between 1999 and 2008 relating to the majority of economically important mineral commodities. It also provides some analysis of the 10 year trends and includes a synopsis of the main physiographic, geological and demographic features of each country. In addition, the extent and locations of the major reserves, producing districts and deposits are described, together with some indications of where expansions to these are expected in the near future. The statistical data presented are derived from the BGS World Mineral Statistics Database which contains data on more than 70 mineral commodities, derived from numerous sources throughout the world and updated annually. The BGS holds a historical dataset that dates back to 1913 for many mineral commodities, enabling trends to be analysed over long time periods. The other information presented has been gathered from published reports, news articles and publically available websites (as indicated under ‘Key information sources’ for each country). Further information relating to the BGS World Mineral Statistics work can be found on the website: www.mineralsUK.com iv
  • 7. Contents Brazil 1 Russia 23 India 49 China 77 Explanatory Notes The statistics in this publication are from the British Geological Survey’s World Mineral Statistics database. Coverage The World Mineral Statistics database covers the majority of economically important mineral commodities. For each commodity constant efforts are made to ensure that as many producing countries as possible are reported. For some commodities, where statistics on production are not publicly available, estimates are made. Users of this compilation are advised that more statistical information than can be included in a publication of this nature is held in the British Geological Survey files and is available for consultation. Historical data (from 1913 for many commodities) can be obtained from the publication World Mineral Production and its pre-decessors entitled World Mineral Statistics and the Statistical Summary of the Mineral Industry many editions of which are available to download from the BGS website: www.mineralsUK.com. Metals Mine production of many metals is expressed in terms of metal content. This is clearly indicated in the tables, adjacent to the unit used. For aluminium, cobalt, copper, iron, lead, nickel, tin and zinc, mine production and metal production are shown in separate rows. Unless otherwise specified, metal production statistics relate to metal recovered from both domestic and imported materials, whether primary or secondary, but exclude remelted material. v
  • 8. Exclusion of Warranty Use by recipients of information provided by the BGS, is at the recipients’ own risk. BGS has taken care to ensure that information provided is as free from error as is reasonably practical. In view of the disparate sources of information at BGS’s disposal, including such material donated to BGS, that BGS accepts in good faith as being accurate, the Natural Environment Research Council (NERC) gives no warranty, expressed or implied, as to the quality, accuracy, performance, and merchantability of the information supplied, or to the information’s suitability for any use whether made known to BGS or otherwise. NERC/BGS accepts no liability whatever in respect of loss, damage, injury or other occurrence however caused. Acknowledgements Compilation of this volume of mineral statistics has been possible only by obtaining information from a very large number of organisations throughout the world, chiefly home and overseas government departments and specialist national or international authorities concerned with particular sectors of the minerals or metals industries. To all these bodies the British Geological Survey expresses its grateful acknowledgement for the information made available, whether in published form or provided by direct correspondence. Particular acknowledgement is made to the Mines Departments and other government agencies of many countries whose regular statements, yearbooks and other reports are worthy of direct consultations by readers in search of detail. Specialist commodity organisations which have kindly allowed information to be reproduced include the International Copper Study Group, the International Lead and Zinc Study Group, the International Nickel Study Group and the International Fertilizer Industry Association Ltd. In a few instances, information on specific commodities has been obtained directly from company sources. The co-operation of other members of the International Consultative Group on Non-Ferrous Metal Statistics is also gratefully acknowledged. Supplementary information is also obtained from publications dealing with a wider range of commodities such as Société de l’Industrie Minérale, Annuaire Statistique Mondial des Minerais et Métaux; Mining Journal, Mining Annual Review; World Bureau of Metal Statistics, World Metal Statistics and, Metallstatistik; publications of the Interstate Statistical Committee of the CIS, the United States Geological Survey, and UN agencies. In addition, information may have been obtained from the websites of the following organisations, statistical offices and government departments: United Nations; International Iron and Steel Institute; Kimberley Process; World Nuclear Association; Organisation of the Petroleum Exporting Countries; South East Asia Iron and Steel Institute; Instituto Latinoamericano del Fierro y el Acero; Departamento Nacional De Producao Mineral, Brazil; Grupo Paranapanema, Brazil; Agencia Nacional do Petroleo, Brazil; Brazilian Aluminium Association, China Mining Association; Energy Information Administration, United States of America. vi
  • 9. Units The Statistics shown in this volume are expressed in metric units. The following factors are given for converting to non-metric units: tonnes × 0.9842 = long tons tonnes × 1.1023 = short tons kilograms × 2.2046 = pounds kilograms × 32.1507 = troy ounces cubic metres × 35.3147 = cubic feet 1 tonne of crude petroleum equals on average 7 barrels of crude petroleum. 1 flask mercury = 34.5 kilograms 1 metric ton unit = 10 kilograms Symbols ... figures not available 0 quantity less than half unit shown — nil * estimated BGS British Geological Survey vii
  • 10.
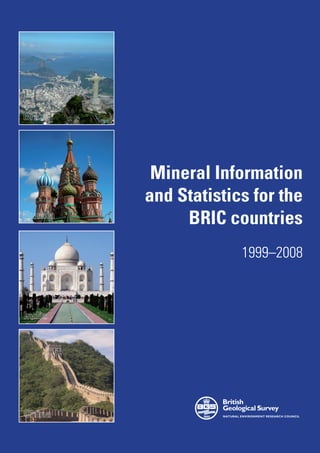
  • 11. Brazil Key facts • Fifth largest country in the world, with a land area of 8.5 million square kilometres. • Dominated by the Amazon River basin containing nearly 20 per cent of the world’s fresh water and about 30 per cent of its tropical forest. • Fifth largest population in the world, totalling nearly 199 million. • One of the fastest developing economies in the world, currently the ninth largest on a GDP (PPP) basis. • The world’s largest producer of niobium minerals and the second largest producer of iron ore and bauxite. • Iron ore production has increased by 90 per cent between 1999 and 2008 and exports of iron ore make the largest contribution to Brazil’s trade surplus. • The world’s largest reserves of niobium minerals, amounting to 93 per cent of the total. Production of these minerals has increased by 500 per cent in 10 years. • Production of copper has increased by 600 per cent between 1999 and 2008, although it still produces less than two per cent of the world’s total. • Bauxite production has increased by 122 per cent in 10 years and in 2008 amounted to 28 million tonnes. • One of the world’s fastest growing oil producers following the discovery of significant offshore resources in 2007/08. Brazil is the largest country in Latin America and is ranked fifth in the world by population (198 739 000: July 2009 estimate) and fifth by area (8 514 877 square kilometres). It occupies nearly half of South America and borders every other South American country except Chile and Ecuador. It comprises four physiographic regions but is dominated by the Amazon basin (about four million square kilometres) which holds nearly 20 per cent of the world’s fresh water and about 30 per cent of the world’s tropical forest (Figure 2). 1
  • 12. VENEZUELA SU N GU RI GU GUIANA NA YA YA HIGHLANDS NORTH NA ME COLOMBIA NE ATLANTIC Boa Vista OCEAN 4 2 Macapá 0º Equator Belém Manaus São Luis a zo n Am Fortaleza A M A Z O N 3 Teresina B A S I N 7 8 1 Natal 5 9 João 6 Possoa 27 Porto Velho Recife 10 o Juruena Maceió Rio Xing u 10º Rio Branco Palmas 20 11 22 Aracaju 12 21 Ri PERU 13 N BOLIVIA Salvador S A D L I N Topography 18 Coastline L A River Chapada 19 Z I International Boundary Goiânia BRASILIA 14 State Boundary H A I G Relief >500m R 23 15 B Relief 0 - 500m H Campo Grande State capitals and population 20º Belo Horizonte Vitoria < 1 million PA N TA N A L 1 - 2 million 17 2 - 5 million 16 PA R A G U AY São Paulo > 5 million Rio de Janeiro 24 Brazilian States 15 Espirito Santo ARG 1 Amazonas Curitiba 2 Roraima 16 Rio De Janeiro ENT 3 Pará 17 São Paulo 25 ana Amapá 18 Distrito Federal SOUTH INA 4 Rio Par Maranháo 19 Goiás ATLANTIC Ri o P 5 20 Tocantins 26 6 Piaui OCEAN a r an a 7 Ceará 21 Matto Grosso Porto Algre 8 Rio Grande Do Norte 22 Rondônia 30º 9 Paraiba 23 Matto Grosso Do Sul 10 Pernambuco 24 Paraná 11 Alagoas 25 Santa Catarina 26 Rio Grande Do Sul U R U G U AY 12 Sergipe 0 400km 13 Bahia 27 Acre 14 Minas Gerais 70º 60º 50º 40º 30º W Figure 2  Brazil geography. Brazil has transformed its economic performance over the last 15 years into one of the fastest developing economies in the world. Gross domestic production (GDP) in 2008 was US$1990 billion with a growth rate of 5.1 per cent in 2008. This growth slowed considerably in 2009, as a result of the global recession, but was estimated to be 0.1 per cent for the year as a whole. On the basis of GDP purchasing power parity (PPP) Brazil is currently the ninth largest economy in the 2
  • 13. world. Brazilian mineral production, excluding hydrocarbons, reached US$23.2 billion in 2008, an increase of 17 per cent on 2007. Mineral ores accounted for 11 per cent and metallurgical products 12 per cent of total exports. Brazil is the world’s largest producer of niobium and the second largest producer of iron ore, bauxite and tantalum. Other top 10 world rankings are shown in Table 1, together with the proportion of the world’s total of each mineral that is produced in Brazil. Commodity World rank Percent of total Commodity World rank Percent of total world production world production Niobium 1 95 Aluminium 6 4 (primary) Tantalum 2 19 Phosphate rock 6 4 Iron ore 2 17 Pig iron 6 4 Bauxite 2 13 Magnesium metal 6 1 (primary) Rare earth minerals 2 1 Talc 7 5 Asbestos 3 13 Chromium ores & 7 3 concentrates Alumina 3 10 Tin (smelter) 7 3 Graphite 3 4 Zirconium minerals 7 2 Kaolin 4 10 Salt 8 3 Cobalt (mine) 4 7 Lithium minerals 8 2 Manganese ore 5 8 Magnesite 8 2 Tin (mine) 5 5 Bentonite 9 3 Vermiculite 5 4 Steel (crude) 9 3 Beryl 5 0.1 Nickel (mine) 10 4 Sillimanite 5 0.1 Tungsten (mine) 10 1 minerals Table 1  Brazil’s top 10 world rankings by commodity, with proportion of world total produced. The location of selected major mines and important deposits are shown in Figure 3. Many mines and deposits are clustered together in the Carajás, Corumbá and Quadrilátero Ferrifero districts and are not necessarily shown individually for reasons of clarity. 3
  • 14. VENEZUELA N GU YA NA SU RI GU NORTH NA YA N O RT H A M A Z ON ATLANTIC ME COLOMBIA C R ATON NE Amaparl Au OCEAN Amapa Fe Vila Nova Cr 0º Equator Trombetas- Paragominaes Pitinga Oriximiná Al Sn-Ta-Nb Al Seis Lagos Nb±REE±Ti Juruti Al Sossego Cu-Au Buritirama Mn A M A Z O N A S Serra Pelada Vale-Northern system Au-Pd-Pt B A S I N Carajás Fe Azul Barra Verde Pallio Mn W Guaju Santa Barbara Ti Sn Cu-Au Onça Vermelho Puma Ni Contezeiro S O U T H E R N Ni Cr Caraiba A M A Z O N Jacobina Cu C R A T O N Au 10º Iqueira Cr Fazenda Brasileiro Codemin São Desiderio Pedra Preta Au PERU Ni Mn Mn S Ã O BOLIVIA Campos Verdes F R A N C I S C O C R A T O N Chapada Emerald Cu-Au Santa Rita São Francisco Niquelândia Ni Au Crixas Au Ni-Fe Pedra Preta 70º Chapada Cr Barro Alto BRASILIA Paracatu Ni Au Itamarati de Caetité Minas Al U Morro Agudo Topography Zn/Pb Duas Barras Monte Cristo Coastline Cu-Zn-Au-Ag Vazanite Turmalina E S P I R I T U Zn Au River Corumbá Catalão Nb Vale-Southern S A N T O International Boundary system Araxá Nb system B A S I N Mine 63 Quadrilátero State Boundary Fe Ferrifero 20º Fortaleza de Minas Fe Urucum Ni Major capitals and population Fe-Mn C A M P O S Pocos de Mirai < 5 million P A R A N A Caldas Al Mibra Al B A S I N Ta > 5 million B A S I N MMN Mn-Fe PA R A G U AY Morra da Mina Mn Capao do Lana Geology (Topaz) Phanerozoic S A N T O S ARGENTINA B A S I N Orogenic Belt (Tupi, Lara, Jupiter & Guara oil fields) Craton Cantao Trevo SOUTH Oil basin Esperanca Fontanella ATLANTIC Mineral Recreio Verdinho OCEAN 30º Base Metal Candiota Precious Metal Uranium U R U G U AY 0 400km Diamond Gemstone Coal 60º 50º 40º 30º W Figure 3  Selected major mines and important mineral deposits in Brazil. Notes: Certain mines and/or deposits mentioned in the text have been omitted for clarity. Fe = iron ore, Au = gold, Sn = tin, Ta = tantalum, Nb = niobium, REE = rare earth elements, Ti = titanium, Cu = copper, Ni = nickel, Mn = manganese, Pd = palladium, Pt = platinum, Al = aluminium, W = tungsten,Cr = chromium, U = uranium, Zn = zinc, Pb = lead, Ag = silver 4
  • 15. Iron ore Brazil has around 6.7 per cent of the world’s iron ore resources and 10 per cent of the world’s reserves. Production rose from 354.7 million tonnes in 2007 to 368.8 million tonnes in 2008; an increase of four per cent and a continuation of a longer term trend (Figure 4). Iron ore exports rose to 282 million tonnes in 2008 (Figure 4), worth US$16.5 billion, an increase of 4.5 per cent by volume and 57 per cent by value compared to 2007. This is more than the growth in value of Brazil’s total exports which grew by 23 per cent. Iron ore exports made up 90 per cent of the total value of mineral exports in 2008 and now represent 8.4 per cent of the total value of Brazilian exports. Iron ore continues to be the product that makes the largest contribution to Brazil’s trade surplus. Exports went to 39 countries with China taking almost 30 per cent by value. 400 350 300 250 Million tonnes 200 150 100 50 0 1999 2000 2001 2002 2003 2004 2005 2006 2007 2008 Iron ore production Iron ore exports Figure 4  Brazil’s production and exports of iron ore from 1999 to 2008. Three companies account for more than 90 per cent of Brazilian production: Vale (293 million tonnes), Cia Siderúrgica Nacional (about 29 million tonnes) and Samarco Mineração SA (17 million tonnes). Vale (previously known as CVRD) is expanding production at Carajás to 110 million tonnes per year for the second half of 2009 and to 140 million tonnes per year in the first half of 2011. The Carajás District has known reserves of about 18 billion tonnes at 65.4 per cent iron. Rio Tinto is to sell its Corumbá operation to Vale. A feasibility study to expand mine production from two million tonnes per year to ten million tonnes per year is nearing completion. Samarco (Vale 50 per cent and BHP Billiton 50 per cent) increased production by 20 per cent in 2008 to 18.5 million tonnes of pellets. With the start of operations at a third pellet plant Samarco’s capacity grew to 21.7 million tonnes per year in 2009. 5
  • 16. Cia Siderúrgica Nacional (CSN) owns the Casa de Piedra and Pedreira da Bocaina iron mines. Casa de Piedra produced 17 million tonnes in 2008 and should reach 19 million tonnes in 2009. Namisa mine (CSN 60 per cent, six Japanese steel makers 40 per cent) is currently under development. By the end of 2013 Namisa, Casa de Piedra and neighbouring mines should provide 13 million tonnes, 20 million tonnes and about six million tonnes respectively to bring the total output to 39 million tonnes. MMX Mineração & Metálicos SA (EBX Group) sold Amapa and Minas-Rio to Anglo American in late March 2008; the new subsidiary is renamed IronX. Minas-Rio will begin production in the first half of 2010 with a capacity of 26.5 million tonnes per year. MMX Corumba (6.3 million tonnes per year) and MMX Sudeste, represent a total installed capacity of 10.8 million tonnes per year of iron ore which can be expanded to 40 million tonnes per year. The MMX Sudeste system comprises Serra Azul and the greenfield site of Bom Sucesso in Minas Gerais State. Iron ore production from Serra Azul in 2008 was 4.3 million tonnes and is expected to rise to 16.7 million tonnes per year in 2012. Bom Sucesso start-up is planned for 2012 with an output of 17.4 million tonnes per year. Bahia Mineração Ltda. intends to construct a mine and plant at Pedra de Ferro near Caetité on Bahia State. Production is planned to start in the fourth quarter of 2011 at 15 million tonnes per year, expanding to 25 million tonnes per year. Manganese Brazil has about 7.6 per cent of the world’s reserves and 1.1 per cent of the total world resources of manganese ore. Brazil’s production for 2008 stood at 3.21 million tonnes of manganese ore and 387 900 tonnes of manganese ferroalloys. Vale (CVRD) is one of the world’s largest manganese ore producers and a leading player in the global manganese and ferroalloy market. It owns and operates four manganese mines within Brazil (Azul, Urucum, Morro da Mina and MMN) and seven ferroalloy plants (including four under RDM, Urucum Mineracao, RDME in France and RDMN in Norway). Production at the Azul Mine in the Carajás Complex, Para State, Vale’s largest manganese mine, was just over two million tonnes in 2008 but this decreased by 31 per cent in 2009. Nickel Brazil is estimated to have 6.3 per cent of the world’s nickel reserves (ranked sixth in the world) and 5.5 per cent of the overall nickel resources (ranked seventh). Mined nickel production for 2008 at 58 500 tonnes was virtually the same as for 2007, but 29 per cent lower than the peak in 2006 (Figure 5). However, with the commissioning of several new mines, output is set to increase substantially. Smelter/refinery production of nickel amounted to 36 000 tonnes in 2008, a small increase on 2007 (Figure 5). Exports of nickel matte increased to 14 970 tonnes, worth US$106 million. Exports of electrolytic nickel decreased to 10 292 tonnes, worth US$203.5 million. 6
  • 17. 90 80 70 60 Thousand tonnes 50 40 30 20 10 0 1999 2000 2001 2002 2003 2004 2005 2006 2007 2008 Mine production of nickel Smelter/refinery production of nickel Figure 5  Brazil’s production of nickel between 1999 and 2008. The Vale-owned, Vermelho lateritic nickel mine project in the Carajás region of Pará State started production in September 2008 with a capacity of 45 000 tonnes per year nickel and 2800 tonnes per year cobalt. Vale has postponed completion of its 58 000 tonnes per year Onça Puma nickel laterite project till January 2010. Mirabela Nickel Ltd. commenced mining the Santa Rita nickel sulphide deposit in Bahia State at the beginning of August 2009. The plant is expected to produce 18 500 tonnes per year of nickel in concentrate increasing to 26 000 tonnes per year by September 2010. Votorantim Group, which owns the Niquelândia Mine in Goiás State with a current production of 17 000 tonnes per year, has begun a new ferro-nickel production unit in Niquelândia with completion expected in the first half of 2010. With this new plant, production will reach 40 000 tonnes per year of electrolytic nickel and nickel in ferro-nickel. First production at Anglo American’s 36 000 tonnes per year Barro Alto nickel project (117 million tonnes at 1.5 per cent nickel) in Goiás State is expected in the second quarter of 2011. Tin, tantalum and niobium Brazil has the world’s fourth largest reserves of tin (9.64 per cent) and between 16–22 per cent of the global resources of tin. It has by far the largest known global reserves of niobium and tantalum accounting for up to 93 and 68 per cent respectively. Brazil produced 13 000 tonnes of mined tin in 2008, a small increase compared to recent years. Smelter production of tin also increased from just under 10 000 tonnes in 2007 to 11 000 tonnes in 2008. Brazil’s output of pyrochlore (containing 7
  • 18. niobium) increased by 16 per cent in 2008 compared to 2007, continuing an upward trend that has amounted to nearly 500 per cent over ten years (Figure 6). 300 250 200 Thousand tonnes 150 100 50 0 1999 2000 2001 2002 2003 2004 2005 2006 2007 2008 Production of pyrochlore Figure 6  Brazil’s production of pyrochlore (containing niobium) between 1999 and 2008. Pitinga mine produced 6257 tonnes of tin in concentrate in 2008 as well as niobium/tantalum ferroalloy (200 000 pounds of contained Ta2O5). Peru’s Minsur, who acquired the mine at the end of 2008, is currently looking into exploiting the substantial heavy rare earth (HRE) resources at Pitinga. Mibra owned by the Metallurg Group produces 100 000 pounds per year of Ta2O5. Companhia Brasileira de Metalurgia e Mineração (CBMM), the world leader in niobium production, accounted for 78.3 per cent of the Brazilian production of niobium concentrate and Mineração Catalão de Goiás Ltda (a subsidiary of Anglo American PLC) supplied the remainder. CBMM-owned Araxá niobium-tantalum mine in Minas Gerais State, is the world’s largest known niobium deposit with total resources of 11.5 million tonnes of Nb2O5, and has the capacity to produce 84 000 tonnes per year of niobium in concentrate. Copper and gold Brazil, with three per cent of world copper reserves, contributed 1.4 per cent to the world’s total mined copper production in 2008, and in 2007 changed from being a net importer to a net exporter of copper ores and concentrates. Brazil produced 216 000 tonnes of mined copper in 2008, an increase of five per cent on 2007 but an increase of nearly 600 per cent compared to 1999 (Figure 7). Brazil has estimated reserves of gold amounting to 2 000 000 kilograms and produced 54 000 kilograms in 2008; an increase of nine per cent compared to the previous year. Mining companies produced 39 800 kilograms with Garimpeiro 8
  • 19. (small-scale artisanal prospector and/or miner) operations accounting for the remainder. Gold exports rose by 3.2 per cent to 37 000 kilograms worth US$1.03 billion. 250 200 Thousand tonnes 150 100 50 0 1999 2000 2001 2002 2003 2004 2005 2006 2007 2008 Mined copper production Refined copper production Figure 7  Brazil’s copper production between 1999 and 2008. Sossego mine, located in an iron–oxide–copper–gold (IOCG) Mineral Province in Pará State, is owned by Vale and is Brazil’s largest copper producer at 140 000 tonnes per year of copper and 3500 kilograms per year of gold. The Paranapanema Group produced 25 000 tonnes of copper and the Chapada copper–gold mine in Goiás State, owned by the Yamana Gold Inc., produced 48 000 tonnes of copper in 2007. Vale is developing other IOCG deposits. The Salobo copper–gold project commissioning was postponed until the beginning of 2010. Initial production capacity will be about 37 000 tonnes per year copper; which will be ramped up to 100 000 tonnes per year. Others include the Cristalino copper–gold deposit, Alemão copper–gold–rare earths–uranium deposit and Igarapé Bahia copper–gold–rare earths–uranium deposit. Cristalino could produce 150 000 tonnes per year of copper whilst Alemão and Igarapé would have a projected combined production of 186 000 tonnes per year of copper. Total Vale production is expected to reach 368 000 tonnes of copper in 2010. Brazil also has new gold mines and expansions which are expected to come on stream between 2009 and 2013. AngloGold-Ashanti’s Cuiaba, Corrego do Sitio and Queiroz mines in Minas Gerais State together produced 9953 kilograms in 2008. Most of this output came from the Cuiaba deposit which has proven reserves of more than 200 000 kilograms of gold. The Corrego do Sitio project will produce 43 500 kilograms of gold over 14 years. Mining started in mid 2007 with full production of 2800 kilograms per year to begin in 2012. The Serra Grande mine complex in Goiás State, a 50:50 joint venture between AngloGold-Ashanti and the Kinross Gold Corporation, produced 2706 kilograms of gold in 2008. 9
  • 20. AngloGold-Ashanti acquired the São Bento Mine from the Eldorado Gold Corp. in December 2008. The Lamego mine was commissioned in mid 2009 and is expected to produce 10 730 kilograms over nine years. Raposos mine, which was mothballed in 1998, is to undergo development during 2009–2010 and production is expected to begin in 2011. Kinross concluded an expansion project at the Paracutu mine in Minas Gerais State in November 2008 to start producing 13 000–18 000 kilograms per year of gold, up to three times its previous capacity of 5400 kilograms. It was expected to produce approximately 11 000 kilograms in 2009. The Canadian Yamana Gold Corp. produced gold from the Fazaenda Brasileiro and Jacobina mines in Bahia State, the São Francisco mine in the Guapore Gold Belt and Chapada Gold and mine development at São Vincente providing total production of 12 293 kilograms for 2008. Commercial production started at São Vincente in mid 2009. The production target for Jacobina gold mine in 2009 is 3888 kilograms and, with expansion of plant capacity, this will increase to 4666 kilograms per year by 2011. The Santa Luz and Ernesto/Pau-a-Pique mines are expected to begin production in 2012 whilst a decision on the Pilar mine construction will be made in 2010. The Canadian company Jaguar Mining Inc. is currently producing gold at its Sabara, Turmalina and Paciência mines. In 2008 combined production totalled 3587 kilograms of gold. Turmalina is expected to produce between 2332 and 2448 kilograms in 2009 rising to 5754 kilograms in 2013. Paciência is expected to produce 2800 kilograms per year in the years 2009–2011. Commissioning of the Caeté mine is expected to take place during the third quarter of 2010. Bauxite, alumina and aluminium Brazil has bauxite resources estimated at 4.3 billion tonnes and reserves estimated at 1.9 billion tonnes. Marketable output of bauxite in 2008 grew by an estimated 10 per cent to 28 million tonnes. Between 1999 and 2008 Brazil’s production of bauxite increased by 122 per cent (Figure 8). Exports in 2008 increased by 7.6 per cent by volume compared to 2007 to 6.2 million tonnes. Alumina production has also increased significantly in Brazil, by 11 per cent in 2008 compared to 2007 and by 123 per cent between 1999 and 2008 (Figure 8). 10
  • 21. 30 25 20 Million tonnes 15 10 5 0 1999 2000 2001 2002 2003 2004 2005 2006 2007 2008 Bauxite Alumina Aluminium (primary) Figure 8  Brazil’s production of bauxite, alumina and primary aluminium between 1999 and 2008. Mineração Rio Do Norte (MRN) produced 12.3 million tonnes of bauxite for the domestic market and six million tonnes for export in 2008. The main deposits are Trombetas-Oriximiná and Paragominas mainly in Para State. Paragominas expanded production to 9.9 million tonnes per year in April 2008 and refinery output is to be increased to 6.3 million tonnes per year of alumina. Mirai mine, which is wholly owned by Companhia Brasileria de Aluminio (CBA), has an annual capacity of three million tonnes per year bauxite and 470 000 tonnes per year of primary aluminium. Alcoa commissioned the Juruti bauxite mine in September 2009. Initial output will be 2.6 million tonnes per year. The expected mine life is 40–60 years. The bauxite will be shipped to the Alumar alumina refinery at São Luis, Maranhão State which is being expanded from 2.1 million tonnes per year to 3.5 million tonnes per year capacity. Vanadium Canada’s Largo Resources Ltd is currently developing the Maracas Vanadium–PGM deposit in Bahia State with 155 million pounds of potential ferro-vanadium resources. Target production is set for the first quarter of 2011 with a minimum annual production of 4500 tonnes of ferro-vanadium, equivalent to about six per cent of projected world production. In May 2009 Largo purchased the Campo Alegre de Lourdes, the largest and richest known vanadium deposit outside China. Crude petroleum and natural gas Brazil is one of the fastest growing oil producers with the discovery in 2007/08 of vast offshore resources. Production in 2008 increased by four per cent compared to the previous year continuing an upward trend amounting to a 69 per cent increase in output between 1999 and 2008 (Figure 9). 11
  • 22. 120 100 80 Million tonnes 60 40 20 0 1999 2000 2001 2002 2003 2004 2005 2006 2007 2008 Crude Petroleum Figure 9  Brazil’s production of crude petroleum between 1999 and 2008. Estimates for the Tupi and Lara fields equate to 12.2 billion barrels. The Jupiter natural gas and condensate field in the Santos Basin may equal the Tupi field in size. Current production of oil (two million barrels per day) and gas (52 million cubic metres per day) is mostly derived from two major oil fields in the Campos Basin with confirmed reserves of 7.2 billion barrels of oil and condensate and 101.5 cubic kilometres of natural gas. In November 2009 Petrobas announced additional reserves of up to 25 million barrels from where extraction is expected to commence by August 2010. Key information sources Ferraz, CP. 2009. Booming Brazil. Mining Journal. 3 July 2009, p.15–18. World Factbook – Brazil. https://www.cia.gov/library/publications/the–world-factbook/geos/br.html USGS. Country and Commodity reports. http://minerals.usgs.gov/minerals/pubs/ www.alcoa.com/brazil/en/news/ www.anglogoldashanti.com/subwebs/ www.mbendi.com/facility/ www.bnamericas.com/news/mining/ www.mineweb.com/minerals/view/ www.commodityonline.com/news/ www.miningweekly.com/article/ www.dnpm.gov.br/assets/galeriaDocuments/ www.mirabela.com.au/ www.highbeam.com/ www.reuters.com/article/ www.infomine.com/commodities/ www.vale.com/vale_us/cgi/ www.infomine.com/index/properties/ www.yamana.com/Operations/ www.im-mining.com/2009/ www2.petrobas.com.br/Petrobas/ www.jaguarmining.com/ www.kinross.com/news-articles/2009/ www.largoresources.com/ 12
  • 23. 13 Table 2  Mineral production in Brazil from 1999 to 2008 (continued).
  • 24. 14 Table 2  Mineral production in Brazil from 1999 to 2008 (continued).
  • 25. Table 2  Mineral production in Brazil from 1999 to 2008. 15
  • 26. 16 Table 3  Mineral exports from Brazil between 1999 and 2008 (continued).
  • 27. 17 Table 3  Mineral exports from Brazil between 1999 and 2008 (continued).
  • 28. Table 3  Mineral exports from Brazil between 1999 and 2008. 18
  • 29. 19 Table 4  Mineral imports to Brazil between 1999 and 2008 (continued).
  • 30. 20 Table 4  Mineral imports to Brazil between 1999 and 2008 (continued).
  • 31. 21 Table 4  Mineral imports to Brazil between 1999 and 2008.
  • 32. 22
  • 33. Russia Key facts • The world’s largest country, with a land area of more than 17 million square kilometres or more than one eighth of the total land surface. • The ninth most populous nation in the world, totalling 140 million. • The world’s seventh largest economy on a GDP (PPP) basis. • The Russian economy fell by nearly eight per cent in 2009 as a result of the global recession, but previously had averaged a growth rate of seven per cent for a decade. • The world’s largest producer of nickel, natural gas and vanadium; also the world’s second largest producer of crude petroleum, platinum group metals and primary aluminium. • The world’s fifth largest iron ore producer, with production increasing by 22 per cent between 1999 and 2008. • Production of bauxite and primary aluminium have both increased by 33 per cent in 10 years, with Russia now the eighth largest bauxite producer in the world. • Nickel output has fallen slightly in recent years, and has risen by less than 10 per cent since 1999, but Russia still produces nearly 20 per cent of the world’s total. • The world’s third largest reserves of gold, with production increasing by 37 per cent in 10 years. • Supplies 70 per cent of the world’s palladium, despite output falling by 49 per cent over 10 years; also 20 per cent of the world’s platinum, with an increase of 79 per cent in the same period. • The world’s largest producer of diamonds if measured by volume and second largest if measured by value. • Production of crude petroleum has increased by 60 per cent between 1999 and 2008, with natural gas output increasing by 18 per cent and coal by 31 per cent over the same period. The Russian Federation comprises the northern part of the Eurasian landmass and is the largest country in the world with a total area of 17 098 000 square kilometres covering more than one eighth of the Earth’s land area. The country comprises two vast plains: the eastern European plain and west Siberian plain, separated by the Ural Mountains. The land rises to the Caucasus Mountains in the south-west and Sayan Mountains along the Mongolian border. It is the largest of 12 republics that make up the Commonwealth of Independent States (CIS) (Figure 10). 23
  • 34. Topography Relief Cities and population Chuckhi 80°N N River > 1500m > 4 Million Peninsula International Boundary 500-1500m 1-4 Million ARCTIC OCEAN Federal District Boundary State/Republic Boundary <500m < 1 Million New 84 Siberian N O R W AY Islands ts Novaya aM 83 DEN BARENTS Taymyr BERING E Zemlya SW Peninsula lym SEA SEA D Murmansk Ko N ESTONIA LA 51 N LITHUANIA FI a Mts ng 160°E By rra CHERSKIY 76 20°E 50 RANGE Magadan 85 74 L AT V I A St Petersburg 48 82 46 52 44 EUROPEAN Far Eastern Kamchatka 45 BELARUS 47 PLAIN Noril’sk CENTRAL SIBERIAN Peninsula 26 Northwestern P L AT E A U R. L Central 25 27 ena 28 49 24 24 Yakutsk 17 23 23 MOSCOW 30 ts 53 58 ircle 75 20 21 29 Nizhniy Novgorod M Arctic C Sakhalin Urals 22 43 Siberian ts 15 31 Island Perm M 19 R. Y Kazan U ral 42 41 R. O 73 32 40 Yekaterinburg b’ 81 or 14 18 33 38 Vo l g a v enin 16 13 34 WEST 72 o UKRAINE SIBERIAN Stan 56 sey 35 Figure 10  Russia geography. Rostov lga Ufa 78 Vo 39 PLAIN 77 57 13 R. 12 36 Samara 60 66 s 37 Chelyabinsk 71 7 Volgograd Khabarovsk 55 59 54 8 61 79 Krasnoyarsk 70 Ca 11 Omsk 9 uc a y a n Mt 10 Novosibirsk 63 Irkutsk SEA as 6 S 80 Southern us 40°E 65 68 OF M 69 ts 5 2 62 Vladivostok JAPAN 4 1 a-ola M ts EA 3 nn 67 CHINA K A Z A K H S TA N Ta GEORGIA 64 NS AZERBAIJAN Lake Baikal PIA NORTH MONGOLIA KOREA CAS IRAN 80°E CHINA 0 1000km 120°E Republics, regions, districts & territories of the Russian Federation Southern Federal District 1 Republic of Dagestan 18 Tambovskaya oblast 35 Samarskaya oblast 52Nenetsky AO 67 Republic of Tyva 2 Republic of Chechnya 19 Lipetskaya oblast 36 Saratovskaya oblast 85 Kaliningradskaya oblast 68 Ust-Ordynsky AO 3 Republic of Ingushetia 20 Orlovskaya oblast 37 Orenburgskaya oblast Urals Federal District 69 Aginsky Buryotsky AO 4 Republic of North Osetia 21 Tulskaya oblast 38 Republic of Tatarstan 53 Khanty-Mansiysky AO 70 Chitinskaya oblast 5 Republic of Kabardino-Balkaria 22 Ryazanskaya oblast 39 Republic of Bashkortostan 54 Chelyabinskaya oblast 71 Republic of Buryatia 6 Republic of Karachaevo-Cherkessia 23 Kaluzhskaya oblast 40 Permskaya oblast 55 Kurganskaya oblast 72 Irkutskaya oblast