SlideShare una empresa de Scribd logo
1 de 12
Descargar para leer sin conexión
Regional Housing Market Tables
City of Toronto: West

July 2011
Toronto Real Estate Board                                                                                                                                   Regional Housing Market Tables

City of Toronto, Toronto West                                                                                                                                                                   JULY 2011
                                                1                          1                      1                     1                      2                       3                4                   5
                                         Sales             Dollar Volume          Average Price          Median Price            New Listings          Active Listings     Avg. SP/LP            Avg. DOM
All Home Types                            748               $317,215,831             $424,085               $375,500                 1,235                  2,023             99%                   27
 Detached                                 296               $163,707,857             $553,067               $475,000                  438                    617              99%                   23
 Semi-Detached                            105                $47,182,366             $449,356               $392,000                  172                    194              101%                  19
 Condominium Townhouse                     56                $17,657,311             $315,309               $316,000                  109                    180              98%                   21
 Condominium Apartment                    254                $71,081,250             $279,847               $268,500                  477                    972              98%                   33
 Link                                      0                      $0                     -                      -                      0                      1                 -                    -
 Att/Row/Townhouse                         33                $17,038,047             $516,304               $500,000                   32                     47              100%                  33
 Co-Operative Apartment                    3                  $481,000               $160,333               $164,000                   2                      5               96%                   87
 Detached Condominium                      0                      $0                     -                      -                      1                      1                 -                    -
 Co-Ownership Apartment                    1                   $68,000                $68,000                $68,000                   4                      6               85%                   79


                                                                                                                                                                                            6
City of Toronto, Toronto West                                                                                                                         YEAR-TO-DATE 2011

                                         Sales1            Dollar Volume1         Average Price1         Median Price1           New Listings2          Avg. SP/LP 4       Avg. DOM5
All Home Types                           5,319             $2,339,752,750            $439,886               $380,000                 9,401                  99%                27
 Detached                                2,243             $1,330,128,559            $593,013               $500,000                 3,712                  100%               21
 Semi-Detached                            758               $329,917,923             $435,248               $399,850                 1,160                  101%               20
 Condominium Townhouse                    430               $132,952,215             $309,191               $311,000                  747                   99%                29
 Condominium Apartment                   1,656              $444,272,029             $268,280               $259,900                 3,443                  98%                36
 Link                                      5                 $1,762,001              $352,400               $337,500                   6                    96%                31
 Att/Row/Townhouse                        193               $95,830,423              $496,531               $500,000                  287                   100%               21
 Co-Operative Apartment                    27                $3,854,100              $142,744               $142,000                   29                   96%                53
 Detached Condominium                      0                     $0                     -                       -                      1                      -                 -
 Co-Ownership Apartment                    7                 $1,035,500              $147,929                $86,500                   16                   97%                68


NOTES
1
 Sales, dollar volume, average sale prices and median sale prices are based on firm transactions entered into the TorontoMLS® system between the first
and last day of the month/period being reported.
2
 New listings entered into the TorontoMLS® system between the first and last day of the month/period being reported.
3
 Active listings at the end of the last day of the month/period being reported.
4
 Ratio of the average selling price to the average listing price for firm transactions entered into the TorontoMLS® system between the first and last day
of the month/period being reported.
5
 Average number of days on the market for firm transactions entered into the TorontoMLS® system between the first and last day of the month/period
being reported.
6
 Past monthly and year-to-date figures are revised on a monthly basis.

                                                                                                                                                        Toronto West, July 2011                                 2
Toronto Real Estate Board                                                                                                                                   Regional Housing Market Tables

City of Toronto, Toronto W01                                                                                                                                                                    JULY 2011
                                                1                          1                      1                     1                      2                       3                4                   5
                                         Sales             Dollar Volume          Average Price          Median Price            New Listings          Active Listings     Avg. SP/LP            Avg. DOM
All Home Types                             68               $32,363,752              $475,938               $384,700                   81                    123              101%                  26
 Detached                                  10                $8,367,750              $836,775               $736,500                   11                     14              99%                   25
 Semi-Detached                             12                $7,606,022              $633,835               $642,750                   10                     3               107%                  11
 Condominium Townhouse                     5                 $2,129,333              $425,867               $393,333                   5                      4               99%                   35
 Condominium Apartment                     37               $11,695,100              $316,084               $305,000                   51                    100              98%                   32
 Link                                      0                      -                     -                      -                       0                      0                 -                    -
 Att/Row/Townhouse                         4                 $2,565,547              $641,387               $668,124                   3                      1               111%                  12
 Co-Operative Apartment                    0                      -                     -                      -                       0                      0                 -                    -
 Detached Condominium                      0                      -                     -                      -                       0                      0                 -                    -
 Co-Ownership Apartment                    0                      -                     -                      -                       1                      1                 -                    -


                                                                                                                                                                                            6
City of Toronto, Toronto W01                                                                                                                          YEAR-TO-DATE 2011

                                         Sales1            Dollar Volume1         Average Price1         Median Price1           New Listings2          Avg. SP/LP 4       Avg. DOM5
All Home Types                            470               $253,214,251             $538,754               $439,900                  815                   102%               21
 Detached                                 114               $101,605,904             $891,280               $817,500                  173                   103%               17
 Semi-Detached                             85                $51,688,007             $608,094               $630,000                  100                   105%               15
 Condominium Townhouse                     44                $16,219,542             $368,626               $369,500                   60                   99%                24
 Condominium Apartment                    204                $71,723,088             $351,584               $318,500                  454                   99%                25
 Link                                      0                      -                     -                      -                       0                      -                 -
 Att/Row/Townhouse                         20                $11,364,710             $568,236               $572,500                   24                   105%               13
 Co-Operative Apartment                    2                  $413,000               $206,500               $206,500                   2                    98%                9
 Detached Condominium                      0                      -                     -                      -                       0                      -                 -
 Co-Ownership Apartment                    1                  $200,000               $200,000               $200,000                   2                    100%               7


NOTES
1
 Sales, dollar volume, average sale prices and median sale prices are based on firm transactions entered into the TorontoMLS® system between the first
and last day of the month/period being reported.
2
 New listings entered into the TorontoMLS® system between the first and last day of the month/period being reported.
3
 Active listings at the end of the last day of the month/period being reported.
4
 Ratio of the average selling price to the average listing price for firm transactions entered into the TorontoMLS® system between the first and last day
of the month/period being reported.
5
 Average number of days on the market for firm transactions entered into the TorontoMLS® system between the first and last day of the month/period
being reported.
6
 Past monthly and year-to-date figures are revised on a monthly basis.

                                                                                                                                                        Toronto West, July 2011                                 3
Toronto Real Estate Board                                                                                                                                   Regional Housing Market Tables

City of Toronto, Toronto W02                                                                                                                                                                    JULY 2011
                                                1                          1                      1                     1                      2                       3                4                   5
                                         Sales             Dollar Volume          Average Price          Median Price            New Listings          Active Listings     Avg. SP/LP            Avg. DOM
All Home Types                             67               $35,529,228              $530,287               $489,000                   96                    97               101%                  17
 Detached                                  15               $10,690,349              $712,690               $735,000                   28                    35               100%                  20
 Semi-Detached                             25               $14,227,079              $569,083               $581,000                   32                    24               104%                  10
 Condominium Townhouse                     10                $3,855,000              $385,500               $391,250                   12                    12               99%                   15
 Condominium Apartment                     12                $4,474,800              $372,900               $377,000                   17                    19               99%                   19
 Link                                      0                      -                     -                      -                       0                     0                  -                    -
 Att/Row/Townhouse                         5                 $2,282,000              $456,400               $422,000                   6                     6                98%                   35
 Co-Operative Apartment                    0                      -                     -                      -                       0                     0                  -                    -
 Detached Condominium                      0                      -                     -                      -                       0                     0                  -                    -
 Co-Ownership Apartment                    0                      -                     -                      -                       1                     1                  -                    -


                                                                                                                                                                                            6
City of Toronto, Toronto W02                                                                                                                          YEAR-TO-DATE 2011

                                         Sales1            Dollar Volume1         Average Price1         Median Price1           New Listings2          Avg. SP/LP 4       Avg. DOM5
All Home Types                            533               $285,307,057             $535,285               $476,000                  745                   102%               17
 Detached                                 173               $125,795,512             $727,142               $725,000                  243                   102%               15
 Semi-Detached                            187                $92,920,432             $496,901               $482,500                  256                   103%               15
 Condominium Townhouse                     65                $24,077,600             $370,425               $379,900                   88                   100%               20
 Condominium Apartment                     75                $27,160,613             $362,142               $345,000                  113                   99%                17
 Link                                      0                      -                     -                      -                       0                      -                 -
 Att/Row/Townhouse                         32                $14,987,900             $468,372               $436,500                   42                   104%               18
 Co-Operative Apartment                    0                      -                     -                      -                       0                      -                 -
 Detached Condominium                      0                      -                     -                      -                       0                      -                 -
 Co-Ownership Apartment                    1                  $365,000               $365,000               $365,000                   3                    99%               132


NOTES
1
 Sales, dollar volume, average sale prices and median sale prices are based on firm transactions entered into the TorontoMLS® system between the first
and last day of the month/period being reported.
2
 New listings entered into the TorontoMLS® system between the first and last day of the month/period being reported.
3
 Active listings at the end of the last day of the month/period being reported.
4
 Ratio of the average selling price to the average listing price for firm transactions entered into the TorontoMLS® system between the first and last day
of the month/period being reported.
5
 Average number of days on the market for firm transactions entered into the TorontoMLS® system between the first and last day of the month/period
being reported.
6
 Past monthly and year-to-date figures are revised on a monthly basis.

                                                                                                                                                        Toronto West, July 2011                                 4
Toronto Real Estate Board                                                                                                                                   Regional Housing Market Tables

City of Toronto, Toronto W03                                                                                                                                                                    JULY 2011
                                                1                          1                      1                     1                      2                       3                4                   5
                                         Sales             Dollar Volume          Average Price          Median Price            New Listings          Active Listings     Avg. SP/LP            Avg. DOM
All Home Types                             54               $19,447,227              $360,134               $355,750                  115                    163              99%                   28
 Detached                                  35               $13,135,750              $375,307               $355,000                   65                     93              99%                   26
 Semi-Detached                             13                $4,762,477              $366,344               $375,000                   41                     51              99%                   22
 Condominium Townhouse                     1                  $357,500               $357,500               $357,500                   2                      4               100%                  28
 Condominium Apartment                     4                  $861,500               $215,375               $194,500                   4                      10              97%                   49
 Link                                      0                      -                     -                      -                       0                      0                 -                    -
 Att/Row/Townhouse                         1                  $330,000               $330,000               $330,000                   3                      5               100%                 101
 Co-Operative Apartment                    0                      -                     -                      -                       0                      0                 -                    -
 Detached Condominium                      0                      -                     -                      -                       0                      0                 -                    -
 Co-Ownership Apartment                    0                      -                     -                      -                       0                      0                 -                    -


                                                                                                                                                                                            6
City of Toronto, Toronto W03                                                                                                                          YEAR-TO-DATE 2011

                                         Sales1            Dollar Volume1         Average Price1         Median Price1           New Listings2          Avg. SP/LP 4       Avg. DOM5
All Home Types                            440               $150,506,703             $342,061               $343,500                  788                   99%                27
 Detached                                 236                $85,218,250             $361,094               $345,000                  451                   99%                26
 Semi-Detached                            127                $46,853,353             $368,924               $365,000                  232                   100%               23
 Condominium Townhouse                     14                 $4,907,000             $350,500               $356,500                   22                   100%               15
 Condominium Apartment                     54                $10,762,200             $199,300               $196,000                   67                   97%                40
 Link                                      0                       -                    -                      -                       0                      -                 -
 Att/Row/Townhouse                         9                  $2,765,900             $307,322               $272,000                   16                   97%                47
 Co-Operative Apartment                    0                       -                    -                      -                       0                      -                 -
 Detached Condominium                      0                       -                    -                      -                       0                      -                 -
 Co-Ownership Apartment                    0                       -                    -                      -                       0                      -                 -


NOTES
1
 Sales, dollar volume, average sale prices and median sale prices are based on firm transactions entered into the TorontoMLS® system between the first
and last day of the month/period being reported.
2
 New listings entered into the TorontoMLS® system between the first and last day of the month/period being reported.
3
 Active listings at the end of the last day of the month/period being reported.
4
 Ratio of the average selling price to the average listing price for firm transactions entered into the TorontoMLS® system between the first and last day
of the month/period being reported.
5
 Average number of days on the market for firm transactions entered into the TorontoMLS® system between the first and last day of the month/period
being reported.
6
 Past monthly and year-to-date figures are revised on a monthly basis.

                                                                                                                                                        Toronto West, July 2011                                 5
Toronto Real Estate Board                                                                                                                                   Regional Housing Market Tables

City of Toronto, Toronto W04                                                                                                                                                                    JULY 2011
                                                1                          1                      1                     1                      2                       3                4                   5
                                         Sales             Dollar Volume          Average Price          Median Price            New Listings          Active Listings     Avg. SP/LP            Avg. DOM
All Home Types                             72               $25,599,000              $355,542               $342,500                  130                    222              98%                   36
 Detached                                  41               $18,444,100              $449,856               $425,000                   60                     84              98%                   30
 Semi-Detached                             4                 $1,209,000              $302,250               $318,500                   8                      15              98%                   27
 Condominium Townhouse                     3                  $776,000               $258,667               $260,000                   11                     22              96%                   22
 Condominium Apartment                     20                $3,690,500              $184,525               $188,500                   48                     96              97%                   48
 Link                                      0                      -                     -                      -                       0                      0                -                     -
 Att/Row/Townhouse                         4                 $1,479,400              $369,850               $362,450                   2                      4               99%                   60
 Co-Operative Apartment                    0                      -                     -                      -                       1                      1                -                     -
 Detached Condominium                      0                      -                     -                      -                       0                      0                -                     -
 Co-Ownership Apartment                    0                      -                     -                      -                       0                      0                -                     -


                                                                                                                                                                                            6
City of Toronto, Toronto W04                                                                                                                          YEAR-TO-DATE 2011

                                         Sales1            Dollar Volume1         Average Price1         Median Price1           New Listings2          Avg. SP/LP 4       Avg. DOM5
All Home Types                            466               $157,006,659             $336,924               $330,250                  821                    98%               32
 Detached                                 246               $107,581,138             $437,322               $418,500                  424                    98%               26
 Semi-Detached                             32                $11,409,420             $356,544               $371,500                   53                    98%               21
 Condominium Townhouse                     44                $11,411,800             $259,359               $242,750                   69                    98%               36
 Condominium Apartment                    129                $21,187,501             $164,244               $157,000                  252                    96%               43
 Link                                      0                       -                    -                      -                       0                      -                 -
 Att/Row/Townhouse                         15                 $5,416,800             $361,120               $349,000                   22                    99%               44
 Co-Operative Apartment                    0                       -                    -                      -                       1                      -                 -
 Detached Condominium                      0                       -                    -                      -                       0                      -                 -
 Co-Ownership Apartment                    0                       -                    -                      -                       0                      -                 -


NOTES
1
 Sales, dollar volume, average sale prices and median sale prices are based on firm transactions entered into the TorontoMLS® system between the first
and last day of the month/period being reported.
2
 New listings entered into the TorontoMLS® system between the first and last day of the month/period being reported.
3
 Active listings at the end of the last day of the month/period being reported.
4
 Ratio of the average selling price to the average listing price for firm transactions entered into the TorontoMLS® system between the first and last day
of the month/period being reported.
5
 Average number of days on the market for firm transactions entered into the TorontoMLS® system between the first and last day of the month/period
being reported.
6
 Past monthly and year-to-date figures are revised on a monthly basis.

                                                                                                                                                        Toronto West, July 2011                                 6
Toronto Real Estate Board                                                                                                                                   Regional Housing Market Tables

City of Toronto, Toronto W05                                                                                                                                                                    JULY 2011
                                                1                          1                      1                     1                      2                       3                4                   5
                                         Sales             Dollar Volume          Average Price          Median Price            New Listings          Active Listings     Avg. SP/LP            Avg. DOM
All Home Types                             94               $33,006,400              $351,132               $353,750                  200                    389              97%                   32
 Detached                                  26               $12,633,800              $485,915               $439,000                   46                     69              98%                   32
 Semi-Detached                             38               $14,344,400              $377,484               $360,500                   62                     84              97%                   27
 Condominium Townhouse                     9                 $2,468,700              $274,300               $230,000                   38                     75              98%                   31
 Condominium Apartment                     18                $2,744,500              $152,472               $137,500                   50                    151              95%                   38
 Link                                      0                      -                      -                      -                      0                      0                -                     -
 Att/Row/Townhouse                         2                  $747,000               $373,500               $373,500                   3                      6               98%                   60
 Co-Operative Apartment                    0                      -                      -                      -                      0                      1                -                     -
 Detached Condominium                      0                      -                      -                      -                      0                      0                -                     -
 Co-Ownership Apartment                    1                   $68,000                $68,000                $68,000                   1                      3               85%                   79


                                                                                                                                                                                            6
City of Toronto, Toronto W05                                                                                                                          YEAR-TO-DATE 2011

                                         Sales1            Dollar Volume1         Average Price1         Median Price1           New Listings2          Avg. SP/LP 4       Avg. DOM5
All Home Types                            660               $224,354,156             $339,931               $340,000                 1,348                   97%               33
 Detached                                 192                $93,193,508             $485,383               $450,000                  333                    98%               28
 Semi-Detached                            226                $84,248,768             $372,782               $350,000                  382                    98%               24
 Condominium Townhouse                     93                $21,736,100             $233,722               $228,000                  224                    97%               44
 Condominium Apartment                    126                $18,323,330             $145,423               $134,000                  368                    95%               47
 Link                                      2                   $722,000              $361,000               $361,000                   2                     95%               17
 Att/Row/Townhouse                         16                 $5,784,750             $361,547               $356,750                   28                    97%               37
 Co-Operative Apartment                    1                    $47,200               $47,200                $47,200                   2                     93%               18
 Detached Condominium                      0                       -                     -                      -                      0                      -                 -
 Co-Ownership Apartment                    4                   $298,500               $74,625                $74,750                   9                     93%               83


NOTES
1
 Sales, dollar volume, average sale prices and median sale prices are based on firm transactions entered into the TorontoMLS® system between the first
and last day of the month/period being reported.
2
 New listings entered into the TorontoMLS® system between the first and last day of the month/period being reported.
3
 Active listings at the end of the last day of the month/period being reported.
4
 Ratio of the average selling price to the average listing price for firm transactions entered into the TorontoMLS® system between the first and last day
of the month/period being reported.
5
 Average number of days on the market for firm transactions entered into the TorontoMLS® system between the first and last day of the month/period
being reported.
6
 Past monthly and year-to-date figures are revised on a monthly basis.

                                                                                                                                                        Toronto West, July 2011                                 7
Toronto Real Estate Board                                                                                                                                   Regional Housing Market Tables

City of Toronto, Toronto W06                                                                                                                                                                    JULY 2011
                                                1                          1                      1                     1                      2                       3                4                   5
                                         Sales             Dollar Volume          Average Price          Median Price            New Listings          Active Listings     Avg. SP/LP            Avg. DOM
All Home Types                             92               $39,447,000              $428,772               $408,500                  167                    287              98%                   26
 Detached                                  30               $14,221,550              $474,052               $462,000                   46                     61              100%                  16
 Semi-Detached                             2                  $985,100               $492,550               $492,550                   1                      2               99%                   23
 Condominium Townhouse                     5                 $2,263,000              $452,600               $410,000                   6                      13              99%                   20
 Condominium Apartment                     49               $18,811,350              $383,905               $346,000                  106                    201              97%                   34
 Link                                      0                      -                     -                      -                       0                      0                 -                    -
 Att/Row/Townhouse                         6                 $3,166,000              $527,667               $557,500                   8                      9               99%                   23
 Co-Operative Apartment                    0                      -                     -                      -                       0                      1                 -                    -
 Detached Condominium                      0                      -                     -                      -                       0                      0                 -                    -
 Co-Ownership Apartment                    0                      -                     -                      -                       0                      0                 -                    -


                                                                                                                                                                                            6
City of Toronto, Toronto W06                                                                                                                          YEAR-TO-DATE 2011

                                         Sales1            Dollar Volume1         Average Price1         Median Price1           New Listings2          Avg. SP/LP 4       Avg. DOM5
All Home Types                            688               $296,789,893             $431,381               $400,000                 1,358                  99%                27
 Detached                                 231               $116,521,596             $504,422               $461,500                  387                   100%               17
 Semi-Detached                             43                $20,377,701             $473,900               $452,000                   52                   102%               13
 Condominium Townhouse                     48                $22,220,720             $462,932               $396,250                   67                   98%                25
 Condominium Apartment                    315               $112,646,038             $357,606               $319,000                  779                   97%                39
 Link                                      0                      -                     -                      -                       0                      -                 -
 Att/Row/Townhouse                         44                $24,097,938             $547,680               $539,450                   66                   99%                16
 Co-Operative Apartment                    6                  $753,900               $125,650               $123,000                   6                    96%                27
 Detached Condominium                      0                      -                     -                      -                       0                      -                 -
 Co-Ownership Apartment                    1                  $172,000               $172,000               $172,000                   1                    98%                5


NOTES
1
 Sales, dollar volume, average sale prices and median sale prices are based on firm transactions entered into the TorontoMLS® system between the first
and last day of the month/period being reported.
2
 New listings entered into the TorontoMLS® system between the first and last day of the month/period being reported.
3
 Active listings at the end of the last day of the month/period being reported.
4
 Ratio of the average selling price to the average listing price for firm transactions entered into the TorontoMLS® system between the first and last day
of the month/period being reported.
5
 Average number of days on the market for firm transactions entered into the TorontoMLS® system between the first and last day of the month/period
being reported.
6
 Past monthly and year-to-date figures are revised on a monthly basis.

                                                                                                                                                        Toronto West, July 2011                                 8
Toronto Real Estate Board                                                                                                                                   Regional Housing Market Tables

City of Toronto, Toronto W07                                                                                                                                                                    JULY 2011
                                                1                          1                      1                     1                      2                       3                4                   5
                                         Sales             Dollar Volume          Average Price          Median Price            New Listings          Active Listings     Avg. SP/LP            Avg. DOM
All Home Types                             52               $26,201,002              $503,865               $463,750                   34                    48               99%                   21
 Detached                                  24               $15,623,452              $650,977               $601,000                   21                    28               100%                  18
 Semi-Detached                             0                      -                     -                      -                       0                     0                  -                    -
 Condominium Townhouse                     1                  $311,000               $311,000               $311,000                   1                     3                96%                   17
 Condominium Apartment                     22                $7,585,550              $344,798               $319,500                   9                     13               98%                   27
 Link                                      0                      -                     -                      -                       0                     0                  -                    -
 Att/Row/Townhouse                         5                 $2,681,000              $536,200               $534,000                   2                     3                98%                   14
 Co-Operative Apartment                    0                      -                     -                      -                       0                     0                  -                    -
 Detached Condominium                      0                      -                     -                      -                       0                     0                  -                    -
 Co-Ownership Apartment                    0                      -                     -                      -                       1                     1                  -                    -


                                                                                                                                                                                            6
City of Toronto, Toronto W07                                                                                                                          YEAR-TO-DATE 2011

                                         Sales1            Dollar Volume1         Average Price1         Median Price1           New Listings2          Avg. SP/LP 4       Avg. DOM5
All Home Types                            408               $221,178,600             $542,104               $530,000                  562                   100%               22
 Detached                                 210               $145,008,835             $690,518               $633,000                  289                   101%               17
 Semi-Detached                             6                  $3,137,355             $522,893               $557,778                   6                    102%               8
 Condominium Townhouse                     6                  $2,301,500             $383,583               $335,750                   10                   101%               42
 Condominium Apartment                    144                $47,681,410             $331,121               $317,000                  200                   98%                30
 Link                                      0                       -                    -                      -                       0                      -                 -
 Att/Row/Townhouse                         39                $22,595,500             $579,372               $577,500                   53                   99%                13
 Co-Operative Apartment                    3                   $454,000              $151,333               $155,000                   3                    94%                46
 Detached Condominium                      0                       -                    -                      -                       0                      -                 -
 Co-Ownership Apartment                    0                       -                    -                      -                       1                      -                 -


NOTES
1
 Sales, dollar volume, average sale prices and median sale prices are based on firm transactions entered into the TorontoMLS® system between the first
and last day of the month/period being reported.
2
 New listings entered into the TorontoMLS® system between the first and last day of the month/period being reported.
3
 Active listings at the end of the last day of the month/period being reported.
4
 Ratio of the average selling price to the average listing price for firm transactions entered into the TorontoMLS® system between the first and last day
of the month/period being reported.
5
 Average number of days on the market for firm transactions entered into the TorontoMLS® system between the first and last day of the month/period
being reported.
6
 Past monthly and year-to-date figures are revised on a monthly basis.

                                                                                                                                                        Toronto West, July 2011                                 9
Toronto Real Estate Board                                                                                                                                   Regional Housing Market Tables

City of Toronto, Toronto W08                                                                                                                                                                    JULY 2011
                                                1                          1                      1                     1                      2                       3                4                   5
                                         Sales             Dollar Volume          Average Price          Median Price            New Listings          Active Listings     Avg. SP/LP            Avg. DOM
All Home Types                             99               $58,058,551              $586,450               $480,000                  167                    272              97%                   26
 Detached                                  46               $40,186,601              $873,622               $675,000                   61                    112              97%                   21
 Semi-Detached                             1                  $445,000               $445,000               $445,000                   2                      1               99%                   16
 Condominium Townhouse                     6                 $1,854,500              $309,083               $303,250                   5                      7               97%                   20
 Condominium Apartment                     41               $12,155,450              $296,474               $271,000                   94                    140              98%                   31
 Link                                      0                      -                     -                      -                       0                      0                -                     -
 Att/Row/Townhouse                         5                 $3,417,000              $683,400               $700,000                   4                      10              98%                   32
 Co-Operative Apartment                    0                      -                     -                      -                       0                      1                -                     -
 Detached Condominium                      0                      -                     -                      -                       1                      1                -                     -
 Co-Ownership Apartment                    0                      -                     -                      -                       0                      0                -                     -


                                                                                                                                                                                            6
City of Toronto, Toronto W08                                                                                                                          YEAR-TO-DATE 2011

                                         Sales1            Dollar Volume1         Average Price1         Median Price1           New Listings2          Avg. SP/LP 4       Avg. DOM5
All Home Types                            730               $457,924,612             $627,294               $518,963                 1,261                  100%               24
 Detached                                 411               $360,718,202             $877,660               $715,000                  706                   100%               19
 Semi-Detached                             11                 $5,114,000             $464,909               $455,000                   13                   102%               19
 Condominium Townhouse                     35                $12,263,375             $350,382               $328,000                   51                   101%               21
 Condominium Apartment                    255                $72,389,610             $283,881               $256,000                  462                   98%                32
 Link                                      0                       -                    -                      -                       0                      -                 -
 Att/Row/Townhouse                         11                 $6,383,925             $580,357               $519,925                   22                   99%                18
 Co-Operative Apartment                    7                  $1,055,500             $150,786               $147,500                   6                    97%                48
 Detached Condominium                      0                       -                    -                      -                       1                      -                 -
 Co-Ownership Apartment                    0                       -                    -                      -                       0                      -                 -


NOTES
1
 Sales, dollar volume, average sale prices and median sale prices are based on firm transactions entered into the TorontoMLS® system between the first
and last day of the month/period being reported.
2
 New listings entered into the TorontoMLS® system between the first and last day of the month/period being reported.
3
 Active listings at the end of the last day of the month/period being reported.
4
 Ratio of the average selling price to the average listing price for firm transactions entered into the TorontoMLS® system between the first and last day
of the month/period being reported.
5
 Average number of days on the market for firm transactions entered into the TorontoMLS® system between the first and last day of the month/period
being reported.
6
 Past monthly and year-to-date figures are revised on a monthly basis.

                                                                                                                                                        Toronto West, July 2011                          10
Toronto Real Estate Board                                                                                                                                   Regional Housing Market Tables

City of Toronto, Toronto W09                                                                                                                                                                    JULY 2011
                                                1                          1                      1                     1                      2                       3                4                   5
                                         Sales             Dollar Volume          Average Price          Median Price            New Listings          Active Listings     Avg. SP/LP            Avg. DOM
All Home Types                             47               $17,030,400              $362,349               $390,000                   87                    150              99%                   29
 Detached                                  20               $10,793,500              $539,675               $540,000                   45                     50              99%                   22
 Semi-Detached                             4                 $1,633,900              $408,475               $401,000                   6                      4               101%                  12
 Condominium Townhouse                     3                 $1,382,000              $460,667               $535,000                   6                      5               97%                   10
 Condominium Apartment                     18                $2,904,000              $161,333               $118,000                   29                     88              97%                   36
 Link                                      0                      -                     -                      -                       0                      0                 -                    -
 Att/Row/Townhouse                         0                      -                     -                      -                       0                      2                 -                    -
 Co-Operative Apartment                    2                  $317,000               $158,500               $158,500                   1                      1               96%                  104
 Detached Condominium                      0                      -                     -                      -                       0                      0                 -                    -
 Co-Ownership Apartment                    0                      -                     -                      -                       0                      0                 -                    -


                                                                                                                                                                                            6
City of Toronto, Toronto W09                                                                                                                          YEAR-TO-DATE 2011

                                         Sales1            Dollar Volume1         Average Price1         Median Price1           New Listings2          Avg. SP/LP 4       Avg. DOM5
All Home Types                            324               $127,783,253             $394,393               $421,050                  622                   99%                35
 Detached                                 165                $91,721,103             $555,885               $547,200                  281                   100%               24
 Semi-Detached                             13                 $5,055,999             $388,923               $392,000                   18                   99%                18
 Condominium Townhouse                     18                 $7,331,700             $407,317               $347,450                   32                   98%                28
 Condominium Apartment                    120                $22,267,950             $185,566               $159,750                  279                   96%                50
 Link                                      1                   $440,001              $440,001               $440,001                   1                    98%                26
 Att/Row/Townhouse                         0                       -                    -                      -                       3                      -                 -
 Co-Operative Apartment                    7                   $966,500              $138,071               $137,000                   8                    96%               101
 Detached Condominium                      0                       -                    -                      -                       0                      -                 -
 Co-Ownership Apartment                    0                       -                    -                      -                       0                      -                 -


NOTES
1
 Sales, dollar volume, average sale prices and median sale prices are based on firm transactions entered into the TorontoMLS® system between the first
and last day of the month/period being reported.
2
 New listings entered into the TorontoMLS® system between the first and last day of the month/period being reported.
3
 Active listings at the end of the last day of the month/period being reported.
4
 Ratio of the average selling price to the average listing price for firm transactions entered into the TorontoMLS® system between the first and last day
of the month/period being reported.
5
 Average number of days on the market for firm transactions entered into the TorontoMLS® system between the first and last day of the month/period
being reported.
6
 Past monthly and year-to-date figures are revised on a monthly basis.

                                                                                                                                                        Toronto West, July 2011                          11
Toronto Real Estate Board                                                                                                                                   Regional Housing Market Tables

City of Toronto, Toronto W10                                                                                                                                                                    JULY 2011
                                                1                          1                      1                     1                      2                       3                4                   5
                                         Sales             Dollar Volume          Average Price          Median Price            New Listings          Active Listings     Avg. SP/LP            Avg. DOM
All Home Types                            103               $30,533,271              $296,440               $280,000                  158                    272              98%                   22
 Detached                                  49               $19,611,005              $400,225               $385,000                   55                     71              98%                   21
 Semi-Detached                             6                 $1,969,388              $328,231               $332,000                   10                     10              98%                   14
 Condominium Townhouse                     13                $2,260,278              $173,868               $198,000                   23                     35              99%                   18
 Condominium Apartment                     33                $6,158,500              $186,621               $167,500                   69                    154              97%                   26
 Link                                      0                      -                     -                      -                       0                      1                 -                    -
 Att/Row/Townhouse                         1                  $370,100               $370,100               $370,100                   1                      1               101%                  38
 Co-Operative Apartment                    1                  $164,000               $164,000               $164,000                   0                      0               97%                   54
 Detached Condominium                      0                      -                     -                      -                       0                      0                 -                    -
 Co-Ownership Apartment                    0                      -                     -                      -                       0                      0                 -                    -


                                                                                                                                                                                            6
City of Toronto, Toronto W10                                                                                                                          YEAR-TO-DATE 2011

                                         Sales1            Dollar Volume1         Average Price1         Median Price1           New Listings2          Avg. SP/LP 4       Avg. DOM5
All Home Types                            600               $165,687,566             $276,146               $277,950                 1,081                   97%               30
 Detached                                 265               $102,764,511             $387,791               $374,000                  425                    98%               23
 Semi-Detached                             28                 $9,112,888             $325,460               $329,000                   48                    97%               25
 Condominium Townhouse                     63                $10,482,878             $166,395               $182,000                  124                    98%               28
 Condominium Apartment                    234                $40,130,289             $171,497               $162,000                  469                    97%               40
 Link                                      2                   $600,000              $300,000               $300,000                   3                     95%               49
 Att/Row/Townhouse                         7                  $2,433,000             $347,571               $360,000                   11                    98%               25
 Co-Operative Apartment                    1                   $164,000              $164,000               $164,000                   1                     97%               54
 Detached Condominium                      0                       -                    -                      -                       0                      -                 -
 Co-Ownership Apartment                    0                       -                    -                      -                       0                      -                 -


NOTES
1
 Sales, dollar volume, average sale prices and median sale prices are based on firm transactions entered into the TorontoMLS® system between the first
and last day of the month/period being reported.
2
 New listings entered into the TorontoMLS® system between the first and last day of the month/period being reported.
3
 Active listings at the end of the last day of the month/period being reported.
4
 Ratio of the average selling price to the average listing price for firm transactions entered into the TorontoMLS® system between the first and last day
of the month/period being reported.
5
 Average number of days on the market for firm transactions entered into the TorontoMLS® system between the first and last day of the month/period
being reported.
6
 Past monthly and year-to-date figures are revised on a monthly basis.

                                                                                                                                                        Toronto West, July 2011                          12

Más contenido relacionado

La actualidad más candente

starbucks Annual_Report_2004_part2
starbucks  Annual_Report_2004_part2starbucks  Annual_Report_2004_part2
starbucks Annual_Report_2004_part2finance41
 
Google student survey p4
Google student survey p4Google student survey p4
Google student survey p4liana1995
 
Toronto real estate statistics may 2011
Toronto real estate statistics may 2011Toronto real estate statistics may 2011
Toronto real estate statistics may 2011John Helfrich
 
Cu, Sharry Mao, Roger Miljkovic, Alex Pareek, Naveena Riddle, John Charting ...
Cu, Sharry Mao, Roger  Miljkovic, Alex Pareek, Naveena Riddle, John Charting ...Cu, Sharry Mao, Roger  Miljkovic, Alex Pareek, Naveena Riddle, John Charting ...
Cu, Sharry Mao, Roger Miljkovic, Alex Pareek, Naveena Riddle, John Charting ...John Riddle
 
Snapshot: NAR Profile of Home Buyers and Sellers
Snapshot: NAR Profile of Home Buyers and SellersSnapshot: NAR Profile of Home Buyers and Sellers
Snapshot: NAR Profile of Home Buyers and SellersNar Res
 
Rers Why Buy Now 1 6 10
Rers Why Buy Now 1 6 10Rers Why Buy Now 1 6 10
Rers Why Buy Now 1 6 10guyfoxwell
 
San francisco residential q3 2008 q32011
San francisco residential q3 2008   q32011San francisco residential q3 2008   q32011
San francisco residential q3 2008 q32011Ronny Budiutama
 
The power of coalition loyalty marketing
The power of coalition loyalty marketingThe power of coalition loyalty marketing
The power of coalition loyalty marketingNORD DDB RIGA
 
MPOrtigas_samplecompFlat_ValidMarOnly
MPOrtigas_samplecompFlat_ValidMarOnlyMPOrtigas_samplecompFlat_ValidMarOnly
MPOrtigas_samplecompFlat_ValidMarOnlyBernadette Kitching
 
From Recession to Recovery to... What?
From Recession to Recovery to... What?From Recession to Recovery to... What?
From Recession to Recovery to... What?Brent Reid
 

La actualidad más candente (13)

starbucks Annual_Report_2004_part2
starbucks  Annual_Report_2004_part2starbucks  Annual_Report_2004_part2
starbucks Annual_Report_2004_part2
 
Google student survey p4
Google student survey p4Google student survey p4
Google student survey p4
 
Toronto real estate statistics may 2011
Toronto real estate statistics may 2011Toronto real estate statistics may 2011
Toronto real estate statistics may 2011
 
Cu, Sharry Mao, Roger Miljkovic, Alex Pareek, Naveena Riddle, John Charting ...
Cu, Sharry Mao, Roger  Miljkovic, Alex Pareek, Naveena Riddle, John Charting ...Cu, Sharry Mao, Roger  Miljkovic, Alex Pareek, Naveena Riddle, John Charting ...
Cu, Sharry Mao, Roger Miljkovic, Alex Pareek, Naveena Riddle, John Charting ...
 
2006Q3 google earnings
2006Q3 google earnings2006Q3 google earnings
2006Q3 google earnings
 
bn annual99
bn annual99bn annual99
bn annual99
 
Snapshot: NAR Profile of Home Buyers and Sellers
Snapshot: NAR Profile of Home Buyers and SellersSnapshot: NAR Profile of Home Buyers and Sellers
Snapshot: NAR Profile of Home Buyers and Sellers
 
1
11
1
 
Rers Why Buy Now 1 6 10
Rers Why Buy Now 1 6 10Rers Why Buy Now 1 6 10
Rers Why Buy Now 1 6 10
 
San francisco residential q3 2008 q32011
San francisco residential q3 2008   q32011San francisco residential q3 2008   q32011
San francisco residential q3 2008 q32011
 
The power of coalition loyalty marketing
The power of coalition loyalty marketingThe power of coalition loyalty marketing
The power of coalition loyalty marketing
 
MPOrtigas_samplecompFlat_ValidMarOnly
MPOrtigas_samplecompFlat_ValidMarOnlyMPOrtigas_samplecompFlat_ValidMarOnly
MPOrtigas_samplecompFlat_ValidMarOnly
 
From Recession to Recovery to... What?
From Recession to Recovery to... What?From Recession to Recovery to... What?
From Recession to Recovery to... What?
 

Destacado

I D Staffing Retail Sales Division
I D Staffing Retail Sales DivisionI D Staffing Retail Sales Division
I D Staffing Retail Sales Divisionhelenporter
 

Destacado (18)

Market Watch for January 2013
Market Watch for January 2013Market Watch for January 2013
Market Watch for January 2013
 
Kdc100
Kdc100Kdc100
Kdc100
 
Kdc200
Kdc200Kdc200
Kdc200
 
Toronto Market Watch for February 2012
Toronto Market Watch for February 2012Toronto Market Watch for February 2012
Toronto Market Watch for February 2012
 
Kdc300
Kdc300Kdc300
Kdc300
 
Jason Mercer Condo Network October 30 2009
Jason Mercer Condo Network October 30 2009Jason Mercer Condo Network October 30 2009
Jason Mercer Condo Network October 30 2009
 
What Could Be Lurking in Your House???
What Could Be Lurking in Your House???What Could Be Lurking in Your House???
What Could Be Lurking in Your House???
 
Toronto Real Estate Board: Market Charts October 2011
Toronto Real Estate Board: Market Charts October 2011Toronto Real Estate Board: Market Charts October 2011
Toronto Real Estate Board: Market Charts October 2011
 
Canadian Real Estate Association: News Release
Canadian Real Estate Association: News ReleaseCanadian Real Estate Association: News Release
Canadian Real Estate Association: News Release
 
Using social media
Using social mediaUsing social media
Using social media
 
Toronto Condo Report Q4, 2011
Toronto Condo Report Q4, 2011Toronto Condo Report Q4, 2011
Toronto Condo Report Q4, 2011
 
November 2011 Market Watch
November 2011 Market WatchNovember 2011 Market Watch
November 2011 Market Watch
 
TREB Housing Market Charts for December 2012
TREB Housing Market Charts for December 2012TREB Housing Market Charts for December 2012
TREB Housing Market Charts for December 2012
 
Toronto Condo Network Presentation by Jason Mercer
Toronto Condo Network Presentation by Jason MercerToronto Condo Network Presentation by Jason Mercer
Toronto Condo Network Presentation by Jason Mercer
 
Greater Toronto REALTORS Housing Charts
Greater Toronto REALTORS Housing ChartsGreater Toronto REALTORS Housing Charts
Greater Toronto REALTORS Housing Charts
 
New Marketing Models
New Marketing ModelsNew Marketing Models
New Marketing Models
 
I D Staffing Retail Sales Division
I D Staffing Retail Sales DivisionI D Staffing Retail Sales Division
I D Staffing Retail Sales Division
 
Цель
ЦельЦель
Цель
 

Similar a Toronto Market Watch West

Toronto central market charts 20124 q
Toronto central market charts 20124 qToronto central market charts 20124 q
Toronto central market charts 20124 qdainamedeiros
 
February 2011 Austin Real Estate Stats
February 2011 Austin Real Estate StatsFebruary 2011 Austin Real Estate Stats
February 2011 Austin Real Estate StatsKristee Leonard
 
295 davenport financial
295 davenport financial295 davenport financial
295 davenport financialHarish Maraj
 
ecolab BusinessFinancial
ecolab  BusinessFinancialecolab  BusinessFinancial
ecolab BusinessFinancialfinance37
 
January 2011 Austin Real Estate Market Stats
January 2011 Austin Real Estate Market StatsJanuary 2011 Austin Real Estate Market Stats
January 2011 Austin Real Estate Market StatsKristee Leonard
 
ecolab Ecolab_2004_Final
ecolab  Ecolab_2004_Finalecolab  Ecolab_2004_Final
ecolab Ecolab_2004_Finalfinance37
 
Houston marketreport sep12_sf
Houston marketreport sep12_sfHouston marketreport sep12_sf
Houston marketreport sep12_sfToni Moss
 
Baltimore Condos History
Baltimore Condos HistoryBaltimore Condos History
Baltimore Condos HistoryWade Sturdivant
 
P4 raymond alvarez excel
P4 raymond alvarez excelP4 raymond alvarez excel
P4 raymond alvarez excelraymond4321
 
P4 raymond alvarez excel
P4 raymond alvarez excelP4 raymond alvarez excel
P4 raymond alvarez excelraymond4321
 
Slide show survey period 4
Slide show survey period 4Slide show survey period 4
Slide show survey period 4raymond4321
 
Ecolab2005AR
Ecolab2005AREcolab2005AR
Ecolab2005ARfinance37
 
Market watch june 2010
Market watch june 2010Market watch june 2010
Market watch june 2010John Helfrich
 
ecolab 2003BusinessDescription
ecolab  2003BusinessDescriptionecolab  2003BusinessDescription
ecolab 2003BusinessDescriptionfinance37
 
T R E B Market Watch Jan2010
T R E B Market Watch Jan2010T R E B Market Watch Jan2010
T R E B Market Watch Jan2010John Helfrich
 
2010 01 Toronto Mls Market Watch
2010 01  Toronto Mls Market Watch2010 01  Toronto Mls Market Watch
2010 01 Toronto Mls Market WatchSteven Silva
 

Similar a Toronto Market Watch West (20)

Toronto central market charts 20124 q
Toronto central market charts 20124 qToronto central market charts 20124 q
Toronto central market charts 20124 q
 
February 2011 Austin Real Estate Stats
February 2011 Austin Real Estate StatsFebruary 2011 Austin Real Estate Stats
February 2011 Austin Real Estate Stats
 
3025 finch
3025 finch3025 finch
3025 finch
 
295 davenport financial
295 davenport financial295 davenport financial
295 davenport financial
 
ecolab BusinessFinancial
ecolab  BusinessFinancialecolab  BusinessFinancial
ecolab BusinessFinancial
 
January 2011 Austin Real Estate Market Stats
January 2011 Austin Real Estate Market StatsJanuary 2011 Austin Real Estate Market Stats
January 2011 Austin Real Estate Market Stats
 
Dalkeith
DalkeithDalkeith
Dalkeith
 
ecolab Ecolab_2004_Final
ecolab  Ecolab_2004_Finalecolab  Ecolab_2004_Final
ecolab Ecolab_2004_Final
 
Houston marketreport sep12_sf
Houston marketreport sep12_sfHouston marketreport sep12_sf
Houston marketreport sep12_sf
 
2006 Q3 Google Earnings Slides
2006 Q3 Google Earnings Slides2006 Q3 Google Earnings Slides
2006 Q3 Google Earnings Slides
 
Baltimore Condos History
Baltimore Condos HistoryBaltimore Condos History
Baltimore Condos History
 
TOL_2008_AR
TOL_2008_ARTOL_2008_AR
TOL_2008_AR
 
P4 raymond alvarez excel
P4 raymond alvarez excelP4 raymond alvarez excel
P4 raymond alvarez excel
 
P4 raymond alvarez excel
P4 raymond alvarez excelP4 raymond alvarez excel
P4 raymond alvarez excel
 
Slide show survey period 4
Slide show survey period 4Slide show survey period 4
Slide show survey period 4
 
Ecolab2005AR
Ecolab2005AREcolab2005AR
Ecolab2005AR
 
Market watch june 2010
Market watch june 2010Market watch june 2010
Market watch june 2010
 
ecolab 2003BusinessDescription
ecolab  2003BusinessDescriptionecolab  2003BusinessDescription
ecolab 2003BusinessDescription
 
T R E B Market Watch Jan2010
T R E B Market Watch Jan2010T R E B Market Watch Jan2010
T R E B Market Watch Jan2010
 
2010 01 Toronto Mls Market Watch
2010 01  Toronto Mls Market Watch2010 01  Toronto Mls Market Watch
2010 01 Toronto Mls Market Watch
 

Más de Richard Silver, Certified International REALTOR®

Más de Richard Silver, Certified International REALTOR® (20)

The Indian Diaspora in Canada
The Indian Diaspora in CanadaThe Indian Diaspora in Canada
The Indian Diaspora in Canada
 
Canadian Foreign Buyer Mortgage Requirements
Canadian Foreign Buyer Mortgage RequirementsCanadian Foreign Buyer Mortgage Requirements
Canadian Foreign Buyer Mortgage Requirements
 
FIABCI USA International Symposium : Gateway Cities 2017
 FIABCI USA International Symposium : Gateway Cities 2017 FIABCI USA International Symposium : Gateway Cities 2017
FIABCI USA International Symposium : Gateway Cities 2017
 
Torontoism Team at Sotheby's International Realty Canada
Torontoism Team at Sotheby's International Realty CanadaTorontoism Team at Sotheby's International Realty Canada
Torontoism Team at Sotheby's International Realty Canada
 
Emerge Presentation 2016
Emerge Presentation 2016Emerge Presentation 2016
Emerge Presentation 2016
 
Accessing the Asian Market
Accessing the Asian MarketAccessing the Asian Market
Accessing the Asian Market
 
Becoming Paperless for Real Estate:
Becoming Paperless for Real Estate: Becoming Paperless for Real Estate:
Becoming Paperless for Real Estate:
 
Becoming Paperless
Becoming PaperlessBecoming Paperless
Becoming Paperless
 
Asia Trip 2015
Asia Trip 2015 Asia Trip 2015
Asia Trip 2015
 
10 things international buyers should know
10 things international buyers should know10 things international buyers should know
10 things international buyers should know
 
Becoming paperless for Ontario REALTORS
Becoming paperless for Ontario REALTORSBecoming paperless for Ontario REALTORS
Becoming paperless for Ontario REALTORS
 
Gander 2015 Presentation
Gander 2015 PresentationGander 2015 Presentation
Gander 2015 Presentation
 
RETechTalk 2015 Apps.
RETechTalk 2015 Apps.RETechTalk 2015 Apps.
RETechTalk 2015 Apps.
 
Top Tier Trends Across Canada
Top Tier Trends Across CanadaTop Tier Trends Across Canada
Top Tier Trends Across Canada
 
Toronto Housing Market Charts for February 2013
Toronto Housing Market Charts for February 2013Toronto Housing Market Charts for February 2013
Toronto Housing Market Charts for February 2013
 
Casey House Celebrates 25 Years!!
Casey House Celebrates 25 Years!! Casey House Celebrates 25 Years!!
Casey House Celebrates 25 Years!!
 
N. Barry Lyons on the Toronto Condo Market for 2013
N. Barry Lyons on the Toronto Condo Market for 2013N. Barry Lyons on the Toronto Condo Market for 2013
N. Barry Lyons on the Toronto Condo Market for 2013
 
Yorkville Hazelton Heritage Conservation District
Yorkville Hazelton Heritage Conservation DistrictYorkville Hazelton Heritage Conservation District
Yorkville Hazelton Heritage Conservation District
 
Toronto REALTORS Rental Market Report 4th Quarter 2012. Toronto Real Estate B...
Toronto REALTORS Rental Market Report 4th Quarter 2012. Toronto Real Estate B...Toronto REALTORS Rental Market Report 4th Quarter 2012. Toronto Real Estate B...
Toronto REALTORS Rental Market Report 4th Quarter 2012. Toronto Real Estate B...
 
Greater Toronto REALTORS 4Th Quarter Condo Sales 2012. Condominium Sales in T...
Greater Toronto REALTORS 4Th Quarter Condo Sales 2012. Condominium Sales in T...Greater Toronto REALTORS 4Th Quarter Condo Sales 2012. Condominium Sales in T...
Greater Toronto REALTORS 4Th Quarter Condo Sales 2012. Condominium Sales in T...
 

Último

Omaxe Dwarka In Delhi E Brochure Pdf
Omaxe Dwarka In Delhi E Brochure     PdfOmaxe Dwarka In Delhi E Brochure     Pdf
Omaxe Dwarka In Delhi E Brochure Pdfashiyadav24
 
:/Call Girls In Saidulajab Delhi ➥9990211544 High profile Riya Escorts In 24/...
:/Call Girls In Saidulajab Delhi ➥9990211544 High profile Riya Escorts In 24/...:/Call Girls In Saidulajab Delhi ➥9990211544 High profile Riya Escorts In 24/...
:/Call Girls In Saidulajab Delhi ➥9990211544 High profile Riya Escorts In 24/...lizamodels9
 
Mahindra Happinest Tathawade Pune Brochure.pdf
Mahindra Happinest Tathawade Pune Brochure.pdfMahindra Happinest Tathawade Pune Brochure.pdf
Mahindra Happinest Tathawade Pune Brochure.pdfBabyrudram
 
Pooja Mehta 9167673311 Get Warm Welcome By Andheri Escorts For Desired Fantasies
Pooja Mehta 9167673311 Get Warm Welcome By Andheri Escorts For Desired FantasiesPooja Mehta 9167673311 Get Warm Welcome By Andheri Escorts For Desired Fantasies
Pooja Mehta 9167673311 Get Warm Welcome By Andheri Escorts For Desired FantasiesPooja Nehwal
 
BDSM⚡Call Girls in Sector 57 Noida Escorts >༒8448380779 Escort Service
BDSM⚡Call Girls in Sector 57 Noida Escorts >༒8448380779 Escort ServiceBDSM⚡Call Girls in Sector 57 Noida Escorts >༒8448380779 Escort Service
BDSM⚡Call Girls in Sector 57 Noida Escorts >༒8448380779 Escort ServiceDelhi Call girls
 
Properties for Sale in Istanbul with Schools and Parks | Antalya Development
Properties for Sale in Istanbul with Schools and Parks | Antalya DevelopmentProperties for Sale in Istanbul with Schools and Parks | Antalya Development
Properties for Sale in Istanbul with Schools and Parks | Antalya DevelopmentAntalya Development
 
Kohinoor Hinjewadi Phase 2 Pune E-Brochure.pdf
Kohinoor Hinjewadi Phase 2 Pune  E-Brochure.pdfKohinoor Hinjewadi Phase 2 Pune  E-Brochure.pdf
Kohinoor Hinjewadi Phase 2 Pune E-Brochure.pdfManishSaxena95
 
Kohinoor Flats In Hinjewadi Phase 2 | Homes Built To Suit Your Needs
Kohinoor Flats In Hinjewadi Phase 2 | Homes Built To Suit Your NeedsKohinoor Flats In Hinjewadi Phase 2 | Homes Built To Suit Your Needs
Kohinoor Flats In Hinjewadi Phase 2 | Homes Built To Suit Your Needsaidasheikh47
 
M3M 129 E Brochure Noida Expressway, Sector 129, Noida
M3M 129 E Brochure Noida Expressway, Sector 129, NoidaM3M 129 E Brochure Noida Expressway, Sector 129, Noida
M3M 129 E Brochure Noida Expressway, Sector 129, Noidasarak0han45400
 
Low Rate ↬Call Girls in Trilokpuri Delhi ↫8447779280}Escorts Service In Delhi
Low Rate ↬Call Girls in Trilokpuri Delhi ↫8447779280}Escorts Service In DelhiLow Rate ↬Call Girls in Trilokpuri Delhi ↫8447779280}Escorts Service In Delhi
Low Rate ↬Call Girls in Trilokpuri Delhi ↫8447779280}Escorts Service In Delhiasmaqueen5
 
call girls in ganesh nagar Delhi 8264348440 ✅ call girls ❤️
call girls in ganesh nagar Delhi 8264348440 ✅ call girls ❤️call girls in ganesh nagar Delhi 8264348440 ✅ call girls ❤️
call girls in ganesh nagar Delhi 8264348440 ✅ call girls ❤️soniya singh
 
Kolte Patil Kharadi Pune E Brochure.pdf
Kolte Patil Kharadi Pune E  Brochure.pdfKolte Patil Kharadi Pune E  Brochure.pdf
Kolte Patil Kharadi Pune E Brochure.pdfabbu831446
 
Raquel Thompson: Combining Creativity with Practicality in Architecture
Raquel Thompson: Combining  Creativity with Practicality in ArchitectureRaquel Thompson: Combining  Creativity with Practicality in Architecture
Raquel Thompson: Combining Creativity with Practicality in ArchitectureRaquel Thompson Barbados
 
Call Girls In Hari Nagar Dadb Block {8447779280}Hari Nagar {West Delhi Escort...
Call Girls In Hari Nagar Dadb Block {8447779280}Hari Nagar {West Delhi Escort...Call Girls In Hari Nagar Dadb Block {8447779280}Hari Nagar {West Delhi Escort...
Call Girls In Hari Nagar Dadb Block {8447779280}Hari Nagar {West Delhi Escort...asmaqueen5
 
Call Girls In Laxmi Nagar Delhi +91-8447779280! !Best Woman Seeking Man Escor...
Call Girls In Laxmi Nagar Delhi +91-8447779280! !Best Woman Seeking Man Escor...Call Girls In Laxmi Nagar Delhi +91-8447779280! !Best Woman Seeking Man Escor...
Call Girls In Laxmi Nagar Delhi +91-8447779280! !Best Woman Seeking Man Escor...asmaqueen5
 
3D Architectural Rendering Company by Panoram CGI
3D Architectural Rendering Company by Panoram CGI3D Architectural Rendering Company by Panoram CGI
3D Architectural Rendering Company by Panoram CGIPanoram CGI
 
Call Girls in shastri nagar Delhi 8264348440 ✅ call girls ❤️
Call Girls in shastri nagar Delhi 8264348440 ✅ call girls ❤️Call Girls in shastri nagar Delhi 8264348440 ✅ call girls ❤️
Call Girls in shastri nagar Delhi 8264348440 ✅ call girls ❤️soniya singh
 
Call Girls in Noida Sector 77 Noida 💯Call Us 🔝 9582086666 🔝 South Delhi Escor...
Call Girls in Noida Sector 77 Noida 💯Call Us 🔝 9582086666 🔝 South Delhi Escor...Call Girls in Noida Sector 77 Noida 💯Call Us 🔝 9582086666 🔝 South Delhi Escor...
Call Girls in Noida Sector 77 Noida 💯Call Us 🔝 9582086666 🔝 South Delhi Escor...delhimodel235
 
M3M The Line Brochure - Premium Investment Opportunity for Commercial Ventures
M3M The Line Brochure - Premium Investment Opportunity for Commercial VenturesM3M The Line Brochure - Premium Investment Opportunity for Commercial Ventures
M3M The Line Brochure - Premium Investment Opportunity for Commercial Venturessheltercareglobal
 
Call Girls In Vasant Vihar Delhi 💯Call Us 🔝8264348440🔝
Call Girls In Vasant Vihar Delhi 💯Call Us 🔝8264348440🔝Call Girls In Vasant Vihar Delhi 💯Call Us 🔝8264348440🔝
Call Girls In Vasant Vihar Delhi 💯Call Us 🔝8264348440🔝soniya singh
 

Último (20)

Omaxe Dwarka In Delhi E Brochure Pdf
Omaxe Dwarka In Delhi E Brochure     PdfOmaxe Dwarka In Delhi E Brochure     Pdf
Omaxe Dwarka In Delhi E Brochure Pdf
 
:/Call Girls In Saidulajab Delhi ➥9990211544 High profile Riya Escorts In 24/...
:/Call Girls In Saidulajab Delhi ➥9990211544 High profile Riya Escorts In 24/...:/Call Girls In Saidulajab Delhi ➥9990211544 High profile Riya Escorts In 24/...
:/Call Girls In Saidulajab Delhi ➥9990211544 High profile Riya Escorts In 24/...
 
Mahindra Happinest Tathawade Pune Brochure.pdf
Mahindra Happinest Tathawade Pune Brochure.pdfMahindra Happinest Tathawade Pune Brochure.pdf
Mahindra Happinest Tathawade Pune Brochure.pdf
 
Pooja Mehta 9167673311 Get Warm Welcome By Andheri Escorts For Desired Fantasies
Pooja Mehta 9167673311 Get Warm Welcome By Andheri Escorts For Desired FantasiesPooja Mehta 9167673311 Get Warm Welcome By Andheri Escorts For Desired Fantasies
Pooja Mehta 9167673311 Get Warm Welcome By Andheri Escorts For Desired Fantasies
 
BDSM⚡Call Girls in Sector 57 Noida Escorts >༒8448380779 Escort Service
BDSM⚡Call Girls in Sector 57 Noida Escorts >༒8448380779 Escort ServiceBDSM⚡Call Girls in Sector 57 Noida Escorts >༒8448380779 Escort Service
BDSM⚡Call Girls in Sector 57 Noida Escorts >༒8448380779 Escort Service
 
Properties for Sale in Istanbul with Schools and Parks | Antalya Development
Properties for Sale in Istanbul with Schools and Parks | Antalya DevelopmentProperties for Sale in Istanbul with Schools and Parks | Antalya Development
Properties for Sale in Istanbul with Schools and Parks | Antalya Development
 
Kohinoor Hinjewadi Phase 2 Pune E-Brochure.pdf
Kohinoor Hinjewadi Phase 2 Pune  E-Brochure.pdfKohinoor Hinjewadi Phase 2 Pune  E-Brochure.pdf
Kohinoor Hinjewadi Phase 2 Pune E-Brochure.pdf
 
Kohinoor Flats In Hinjewadi Phase 2 | Homes Built To Suit Your Needs
Kohinoor Flats In Hinjewadi Phase 2 | Homes Built To Suit Your NeedsKohinoor Flats In Hinjewadi Phase 2 | Homes Built To Suit Your Needs
Kohinoor Flats In Hinjewadi Phase 2 | Homes Built To Suit Your Needs
 
M3M 129 E Brochure Noida Expressway, Sector 129, Noida
M3M 129 E Brochure Noida Expressway, Sector 129, NoidaM3M 129 E Brochure Noida Expressway, Sector 129, Noida
M3M 129 E Brochure Noida Expressway, Sector 129, Noida
 
Low Rate ↬Call Girls in Trilokpuri Delhi ↫8447779280}Escorts Service In Delhi
Low Rate ↬Call Girls in Trilokpuri Delhi ↫8447779280}Escorts Service In DelhiLow Rate ↬Call Girls in Trilokpuri Delhi ↫8447779280}Escorts Service In Delhi
Low Rate ↬Call Girls in Trilokpuri Delhi ↫8447779280}Escorts Service In Delhi
 
call girls in ganesh nagar Delhi 8264348440 ✅ call girls ❤️
call girls in ganesh nagar Delhi 8264348440 ✅ call girls ❤️call girls in ganesh nagar Delhi 8264348440 ✅ call girls ❤️
call girls in ganesh nagar Delhi 8264348440 ✅ call girls ❤️
 
Kolte Patil Kharadi Pune E Brochure.pdf
Kolte Patil Kharadi Pune E  Brochure.pdfKolte Patil Kharadi Pune E  Brochure.pdf
Kolte Patil Kharadi Pune E Brochure.pdf
 
Raquel Thompson: Combining Creativity with Practicality in Architecture
Raquel Thompson: Combining  Creativity with Practicality in ArchitectureRaquel Thompson: Combining  Creativity with Practicality in Architecture
Raquel Thompson: Combining Creativity with Practicality in Architecture
 
Call Girls In Hari Nagar Dadb Block {8447779280}Hari Nagar {West Delhi Escort...
Call Girls In Hari Nagar Dadb Block {8447779280}Hari Nagar {West Delhi Escort...Call Girls In Hari Nagar Dadb Block {8447779280}Hari Nagar {West Delhi Escort...
Call Girls In Hari Nagar Dadb Block {8447779280}Hari Nagar {West Delhi Escort...
 
Call Girls In Laxmi Nagar Delhi +91-8447779280! !Best Woman Seeking Man Escor...
Call Girls In Laxmi Nagar Delhi +91-8447779280! !Best Woman Seeking Man Escor...Call Girls In Laxmi Nagar Delhi +91-8447779280! !Best Woman Seeking Man Escor...
Call Girls In Laxmi Nagar Delhi +91-8447779280! !Best Woman Seeking Man Escor...
 
3D Architectural Rendering Company by Panoram CGI
3D Architectural Rendering Company by Panoram CGI3D Architectural Rendering Company by Panoram CGI
3D Architectural Rendering Company by Panoram CGI
 
Call Girls in shastri nagar Delhi 8264348440 ✅ call girls ❤️
Call Girls in shastri nagar Delhi 8264348440 ✅ call girls ❤️Call Girls in shastri nagar Delhi 8264348440 ✅ call girls ❤️
Call Girls in shastri nagar Delhi 8264348440 ✅ call girls ❤️
 
Call Girls in Noida Sector 77 Noida 💯Call Us 🔝 9582086666 🔝 South Delhi Escor...
Call Girls in Noida Sector 77 Noida 💯Call Us 🔝 9582086666 🔝 South Delhi Escor...Call Girls in Noida Sector 77 Noida 💯Call Us 🔝 9582086666 🔝 South Delhi Escor...
Call Girls in Noida Sector 77 Noida 💯Call Us 🔝 9582086666 🔝 South Delhi Escor...
 
M3M The Line Brochure - Premium Investment Opportunity for Commercial Ventures
M3M The Line Brochure - Premium Investment Opportunity for Commercial VenturesM3M The Line Brochure - Premium Investment Opportunity for Commercial Ventures
M3M The Line Brochure - Premium Investment Opportunity for Commercial Ventures
 
Call Girls In Vasant Vihar Delhi 💯Call Us 🔝8264348440🔝
Call Girls In Vasant Vihar Delhi 💯Call Us 🔝8264348440🔝Call Girls In Vasant Vihar Delhi 💯Call Us 🔝8264348440🔝
Call Girls In Vasant Vihar Delhi 💯Call Us 🔝8264348440🔝
 

Toronto Market Watch West

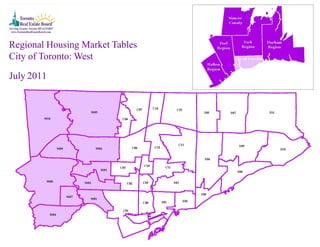
  • 1. Regional Housing Market Tables City of Toronto: West July 2011
  • 2. Toronto Real Estate Board Regional Housing Market Tables City of Toronto, Toronto West JULY 2011 1 1 1 1 2 3 4 5 Sales Dollar Volume Average Price Median Price New Listings Active Listings Avg. SP/LP Avg. DOM All Home Types 748 $317,215,831 $424,085 $375,500 1,235 2,023 99% 27 Detached 296 $163,707,857 $553,067 $475,000 438 617 99% 23 Semi-Detached 105 $47,182,366 $449,356 $392,000 172 194 101% 19 Condominium Townhouse 56 $17,657,311 $315,309 $316,000 109 180 98% 21 Condominium Apartment 254 $71,081,250 $279,847 $268,500 477 972 98% 33 Link 0 $0 - - 0 1 - - Att/Row/Townhouse 33 $17,038,047 $516,304 $500,000 32 47 100% 33 Co-Operative Apartment 3 $481,000 $160,333 $164,000 2 5 96% 87 Detached Condominium 0 $0 - - 1 1 - - Co-Ownership Apartment 1 $68,000 $68,000 $68,000 4 6 85% 79 6 City of Toronto, Toronto West YEAR-TO-DATE 2011 Sales1 Dollar Volume1 Average Price1 Median Price1 New Listings2 Avg. SP/LP 4 Avg. DOM5 All Home Types 5,319 $2,339,752,750 $439,886 $380,000 9,401 99% 27 Detached 2,243 $1,330,128,559 $593,013 $500,000 3,712 100% 21 Semi-Detached 758 $329,917,923 $435,248 $399,850 1,160 101% 20 Condominium Townhouse 430 $132,952,215 $309,191 $311,000 747 99% 29 Condominium Apartment 1,656 $444,272,029 $268,280 $259,900 3,443 98% 36 Link 5 $1,762,001 $352,400 $337,500 6 96% 31 Att/Row/Townhouse 193 $95,830,423 $496,531 $500,000 287 100% 21 Co-Operative Apartment 27 $3,854,100 $142,744 $142,000 29 96% 53 Detached Condominium 0 $0 - - 1 - - Co-Ownership Apartment 7 $1,035,500 $147,929 $86,500 16 97% 68 NOTES 1 Sales, dollar volume, average sale prices and median sale prices are based on firm transactions entered into the TorontoMLS® system between the first and last day of the month/period being reported. 2 New listings entered into the TorontoMLS® system between the first and last day of the month/period being reported. 3 Active listings at the end of the last day of the month/period being reported. 4 Ratio of the average selling price to the average listing price for firm transactions entered into the TorontoMLS® system between the first and last day of the month/period being reported. 5 Average number of days on the market for firm transactions entered into the TorontoMLS® system between the first and last day of the month/period being reported. 6 Past monthly and year-to-date figures are revised on a monthly basis. Toronto West, July 2011 2
  • 3. Toronto Real Estate Board Regional Housing Market Tables City of Toronto, Toronto W01 JULY 2011 1 1 1 1 2 3 4 5 Sales Dollar Volume Average Price Median Price New Listings Active Listings Avg. SP/LP Avg. DOM All Home Types 68 $32,363,752 $475,938 $384,700 81 123 101% 26 Detached 10 $8,367,750 $836,775 $736,500 11 14 99% 25 Semi-Detached 12 $7,606,022 $633,835 $642,750 10 3 107% 11 Condominium Townhouse 5 $2,129,333 $425,867 $393,333 5 4 99% 35 Condominium Apartment 37 $11,695,100 $316,084 $305,000 51 100 98% 32 Link 0 - - - 0 0 - - Att/Row/Townhouse 4 $2,565,547 $641,387 $668,124 3 1 111% 12 Co-Operative Apartment 0 - - - 0 0 - - Detached Condominium 0 - - - 0 0 - - Co-Ownership Apartment 0 - - - 1 1 - - 6 City of Toronto, Toronto W01 YEAR-TO-DATE 2011 Sales1 Dollar Volume1 Average Price1 Median Price1 New Listings2 Avg. SP/LP 4 Avg. DOM5 All Home Types 470 $253,214,251 $538,754 $439,900 815 102% 21 Detached 114 $101,605,904 $891,280 $817,500 173 103% 17 Semi-Detached 85 $51,688,007 $608,094 $630,000 100 105% 15 Condominium Townhouse 44 $16,219,542 $368,626 $369,500 60 99% 24 Condominium Apartment 204 $71,723,088 $351,584 $318,500 454 99% 25 Link 0 - - - 0 - - Att/Row/Townhouse 20 $11,364,710 $568,236 $572,500 24 105% 13 Co-Operative Apartment 2 $413,000 $206,500 $206,500 2 98% 9 Detached Condominium 0 - - - 0 - - Co-Ownership Apartment 1 $200,000 $200,000 $200,000 2 100% 7 NOTES 1 Sales, dollar volume, average sale prices and median sale prices are based on firm transactions entered into the TorontoMLS® system between the first and last day of the month/period being reported. 2 New listings entered into the TorontoMLS® system between the first and last day of the month/period being reported. 3 Active listings at the end of the last day of the month/period being reported. 4 Ratio of the average selling price to the average listing price for firm transactions entered into the TorontoMLS® system between the first and last day of the month/period being reported. 5 Average number of days on the market for firm transactions entered into the TorontoMLS® system between the first and last day of the month/period being reported. 6 Past monthly and year-to-date figures are revised on a monthly basis. Toronto West, July 2011 3
  • 4. Toronto Real Estate Board Regional Housing Market Tables City of Toronto, Toronto W02 JULY 2011 1 1 1 1 2 3 4 5 Sales Dollar Volume Average Price Median Price New Listings Active Listings Avg. SP/LP Avg. DOM All Home Types 67 $35,529,228 $530,287 $489,000 96 97 101% 17 Detached 15 $10,690,349 $712,690 $735,000 28 35 100% 20 Semi-Detached 25 $14,227,079 $569,083 $581,000 32 24 104% 10 Condominium Townhouse 10 $3,855,000 $385,500 $391,250 12 12 99% 15 Condominium Apartment 12 $4,474,800 $372,900 $377,000 17 19 99% 19 Link 0 - - - 0 0 - - Att/Row/Townhouse 5 $2,282,000 $456,400 $422,000 6 6 98% 35 Co-Operative Apartment 0 - - - 0 0 - - Detached Condominium 0 - - - 0 0 - - Co-Ownership Apartment 0 - - - 1 1 - - 6 City of Toronto, Toronto W02 YEAR-TO-DATE 2011 Sales1 Dollar Volume1 Average Price1 Median Price1 New Listings2 Avg. SP/LP 4 Avg. DOM5 All Home Types 533 $285,307,057 $535,285 $476,000 745 102% 17 Detached 173 $125,795,512 $727,142 $725,000 243 102% 15 Semi-Detached 187 $92,920,432 $496,901 $482,500 256 103% 15 Condominium Townhouse 65 $24,077,600 $370,425 $379,900 88 100% 20 Condominium Apartment 75 $27,160,613 $362,142 $345,000 113 99% 17 Link 0 - - - 0 - - Att/Row/Townhouse 32 $14,987,900 $468,372 $436,500 42 104% 18 Co-Operative Apartment 0 - - - 0 - - Detached Condominium 0 - - - 0 - - Co-Ownership Apartment 1 $365,000 $365,000 $365,000 3 99% 132 NOTES 1 Sales, dollar volume, average sale prices and median sale prices are based on firm transactions entered into the TorontoMLS® system between the first and last day of the month/period being reported. 2 New listings entered into the TorontoMLS® system between the first and last day of the month/period being reported. 3 Active listings at the end of the last day of the month/period being reported. 4 Ratio of the average selling price to the average listing price for firm transactions entered into the TorontoMLS® system between the first and last day of the month/period being reported. 5 Average number of days on the market for firm transactions entered into the TorontoMLS® system between the first and last day of the month/period being reported. 6 Past monthly and year-to-date figures are revised on a monthly basis. Toronto West, July 2011 4
  • 5. Toronto Real Estate Board Regional Housing Market Tables City of Toronto, Toronto W03 JULY 2011 1 1 1 1 2 3 4 5 Sales Dollar Volume Average Price Median Price New Listings Active Listings Avg. SP/LP Avg. DOM All Home Types 54 $19,447,227 $360,134 $355,750 115 163 99% 28 Detached 35 $13,135,750 $375,307 $355,000 65 93 99% 26 Semi-Detached 13 $4,762,477 $366,344 $375,000 41 51 99% 22 Condominium Townhouse 1 $357,500 $357,500 $357,500 2 4 100% 28 Condominium Apartment 4 $861,500 $215,375 $194,500 4 10 97% 49 Link 0 - - - 0 0 - - Att/Row/Townhouse 1 $330,000 $330,000 $330,000 3 5 100% 101 Co-Operative Apartment 0 - - - 0 0 - - Detached Condominium 0 - - - 0 0 - - Co-Ownership Apartment 0 - - - 0 0 - - 6 City of Toronto, Toronto W03 YEAR-TO-DATE 2011 Sales1 Dollar Volume1 Average Price1 Median Price1 New Listings2 Avg. SP/LP 4 Avg. DOM5 All Home Types 440 $150,506,703 $342,061 $343,500 788 99% 27 Detached 236 $85,218,250 $361,094 $345,000 451 99% 26 Semi-Detached 127 $46,853,353 $368,924 $365,000 232 100% 23 Condominium Townhouse 14 $4,907,000 $350,500 $356,500 22 100% 15 Condominium Apartment 54 $10,762,200 $199,300 $196,000 67 97% 40 Link 0 - - - 0 - - Att/Row/Townhouse 9 $2,765,900 $307,322 $272,000 16 97% 47 Co-Operative Apartment 0 - - - 0 - - Detached Condominium 0 - - - 0 - - Co-Ownership Apartment 0 - - - 0 - - NOTES 1 Sales, dollar volume, average sale prices and median sale prices are based on firm transactions entered into the TorontoMLS® system between the first and last day of the month/period being reported. 2 New listings entered into the TorontoMLS® system between the first and last day of the month/period being reported. 3 Active listings at the end of the last day of the month/period being reported. 4 Ratio of the average selling price to the average listing price for firm transactions entered into the TorontoMLS® system between the first and last day of the month/period being reported. 5 Average number of days on the market for firm transactions entered into the TorontoMLS® system between the first and last day of the month/period being reported. 6 Past monthly and year-to-date figures are revised on a monthly basis. Toronto West, July 2011 5
  • 6. Toronto Real Estate Board Regional Housing Market Tables City of Toronto, Toronto W04 JULY 2011 1 1 1 1 2 3 4 5 Sales Dollar Volume Average Price Median Price New Listings Active Listings Avg. SP/LP Avg. DOM All Home Types 72 $25,599,000 $355,542 $342,500 130 222 98% 36 Detached 41 $18,444,100 $449,856 $425,000 60 84 98% 30 Semi-Detached 4 $1,209,000 $302,250 $318,500 8 15 98% 27 Condominium Townhouse 3 $776,000 $258,667 $260,000 11 22 96% 22 Condominium Apartment 20 $3,690,500 $184,525 $188,500 48 96 97% 48 Link 0 - - - 0 0 - - Att/Row/Townhouse 4 $1,479,400 $369,850 $362,450 2 4 99% 60 Co-Operative Apartment 0 - - - 1 1 - - Detached Condominium 0 - - - 0 0 - - Co-Ownership Apartment 0 - - - 0 0 - - 6 City of Toronto, Toronto W04 YEAR-TO-DATE 2011 Sales1 Dollar Volume1 Average Price1 Median Price1 New Listings2 Avg. SP/LP 4 Avg. DOM5 All Home Types 466 $157,006,659 $336,924 $330,250 821 98% 32 Detached 246 $107,581,138 $437,322 $418,500 424 98% 26 Semi-Detached 32 $11,409,420 $356,544 $371,500 53 98% 21 Condominium Townhouse 44 $11,411,800 $259,359 $242,750 69 98% 36 Condominium Apartment 129 $21,187,501 $164,244 $157,000 252 96% 43 Link 0 - - - 0 - - Att/Row/Townhouse 15 $5,416,800 $361,120 $349,000 22 99% 44 Co-Operative Apartment 0 - - - 1 - - Detached Condominium 0 - - - 0 - - Co-Ownership Apartment 0 - - - 0 - - NOTES 1 Sales, dollar volume, average sale prices and median sale prices are based on firm transactions entered into the TorontoMLS® system between the first and last day of the month/period being reported. 2 New listings entered into the TorontoMLS® system between the first and last day of the month/period being reported. 3 Active listings at the end of the last day of the month/period being reported. 4 Ratio of the average selling price to the average listing price for firm transactions entered into the TorontoMLS® system between the first and last day of the month/period being reported. 5 Average number of days on the market for firm transactions entered into the TorontoMLS® system between the first and last day of the month/period being reported. 6 Past monthly and year-to-date figures are revised on a monthly basis. Toronto West, July 2011 6
  • 7. Toronto Real Estate Board Regional Housing Market Tables City of Toronto, Toronto W05 JULY 2011 1 1 1 1 2 3 4 5 Sales Dollar Volume Average Price Median Price New Listings Active Listings Avg. SP/LP Avg. DOM All Home Types 94 $33,006,400 $351,132 $353,750 200 389 97% 32 Detached 26 $12,633,800 $485,915 $439,000 46 69 98% 32 Semi-Detached 38 $14,344,400 $377,484 $360,500 62 84 97% 27 Condominium Townhouse 9 $2,468,700 $274,300 $230,000 38 75 98% 31 Condominium Apartment 18 $2,744,500 $152,472 $137,500 50 151 95% 38 Link 0 - - - 0 0 - - Att/Row/Townhouse 2 $747,000 $373,500 $373,500 3 6 98% 60 Co-Operative Apartment 0 - - - 0 1 - - Detached Condominium 0 - - - 0 0 - - Co-Ownership Apartment 1 $68,000 $68,000 $68,000 1 3 85% 79 6 City of Toronto, Toronto W05 YEAR-TO-DATE 2011 Sales1 Dollar Volume1 Average Price1 Median Price1 New Listings2 Avg. SP/LP 4 Avg. DOM5 All Home Types 660 $224,354,156 $339,931 $340,000 1,348 97% 33 Detached 192 $93,193,508 $485,383 $450,000 333 98% 28 Semi-Detached 226 $84,248,768 $372,782 $350,000 382 98% 24 Condominium Townhouse 93 $21,736,100 $233,722 $228,000 224 97% 44 Condominium Apartment 126 $18,323,330 $145,423 $134,000 368 95% 47 Link 2 $722,000 $361,000 $361,000 2 95% 17 Att/Row/Townhouse 16 $5,784,750 $361,547 $356,750 28 97% 37 Co-Operative Apartment 1 $47,200 $47,200 $47,200 2 93% 18 Detached Condominium 0 - - - 0 - - Co-Ownership Apartment 4 $298,500 $74,625 $74,750 9 93% 83 NOTES 1 Sales, dollar volume, average sale prices and median sale prices are based on firm transactions entered into the TorontoMLS® system between the first and last day of the month/period being reported. 2 New listings entered into the TorontoMLS® system between the first and last day of the month/period being reported. 3 Active listings at the end of the last day of the month/period being reported. 4 Ratio of the average selling price to the average listing price for firm transactions entered into the TorontoMLS® system between the first and last day of the month/period being reported. 5 Average number of days on the market for firm transactions entered into the TorontoMLS® system between the first and last day of the month/period being reported. 6 Past monthly and year-to-date figures are revised on a monthly basis. Toronto West, July 2011 7
  • 8. Toronto Real Estate Board Regional Housing Market Tables City of Toronto, Toronto W06 JULY 2011 1 1 1 1 2 3 4 5 Sales Dollar Volume Average Price Median Price New Listings Active Listings Avg. SP/LP Avg. DOM All Home Types 92 $39,447,000 $428,772 $408,500 167 287 98% 26 Detached 30 $14,221,550 $474,052 $462,000 46 61 100% 16 Semi-Detached 2 $985,100 $492,550 $492,550 1 2 99% 23 Condominium Townhouse 5 $2,263,000 $452,600 $410,000 6 13 99% 20 Condominium Apartment 49 $18,811,350 $383,905 $346,000 106 201 97% 34 Link 0 - - - 0 0 - - Att/Row/Townhouse 6 $3,166,000 $527,667 $557,500 8 9 99% 23 Co-Operative Apartment 0 - - - 0 1 - - Detached Condominium 0 - - - 0 0 - - Co-Ownership Apartment 0 - - - 0 0 - - 6 City of Toronto, Toronto W06 YEAR-TO-DATE 2011 Sales1 Dollar Volume1 Average Price1 Median Price1 New Listings2 Avg. SP/LP 4 Avg. DOM5 All Home Types 688 $296,789,893 $431,381 $400,000 1,358 99% 27 Detached 231 $116,521,596 $504,422 $461,500 387 100% 17 Semi-Detached 43 $20,377,701 $473,900 $452,000 52 102% 13 Condominium Townhouse 48 $22,220,720 $462,932 $396,250 67 98% 25 Condominium Apartment 315 $112,646,038 $357,606 $319,000 779 97% 39 Link 0 - - - 0 - - Att/Row/Townhouse 44 $24,097,938 $547,680 $539,450 66 99% 16 Co-Operative Apartment 6 $753,900 $125,650 $123,000 6 96% 27 Detached Condominium 0 - - - 0 - - Co-Ownership Apartment 1 $172,000 $172,000 $172,000 1 98% 5 NOTES 1 Sales, dollar volume, average sale prices and median sale prices are based on firm transactions entered into the TorontoMLS® system between the first and last day of the month/period being reported. 2 New listings entered into the TorontoMLS® system between the first and last day of the month/period being reported. 3 Active listings at the end of the last day of the month/period being reported. 4 Ratio of the average selling price to the average listing price for firm transactions entered into the TorontoMLS® system between the first and last day of the month/period being reported. 5 Average number of days on the market for firm transactions entered into the TorontoMLS® system between the first and last day of the month/period being reported. 6 Past monthly and year-to-date figures are revised on a monthly basis. Toronto West, July 2011 8
  • 9. Toronto Real Estate Board Regional Housing Market Tables City of Toronto, Toronto W07 JULY 2011 1 1 1 1 2 3 4 5 Sales Dollar Volume Average Price Median Price New Listings Active Listings Avg. SP/LP Avg. DOM All Home Types 52 $26,201,002 $503,865 $463,750 34 48 99% 21 Detached 24 $15,623,452 $650,977 $601,000 21 28 100% 18 Semi-Detached 0 - - - 0 0 - - Condominium Townhouse 1 $311,000 $311,000 $311,000 1 3 96% 17 Condominium Apartment 22 $7,585,550 $344,798 $319,500 9 13 98% 27 Link 0 - - - 0 0 - - Att/Row/Townhouse 5 $2,681,000 $536,200 $534,000 2 3 98% 14 Co-Operative Apartment 0 - - - 0 0 - - Detached Condominium 0 - - - 0 0 - - Co-Ownership Apartment 0 - - - 1 1 - - 6 City of Toronto, Toronto W07 YEAR-TO-DATE 2011 Sales1 Dollar Volume1 Average Price1 Median Price1 New Listings2 Avg. SP/LP 4 Avg. DOM5 All Home Types 408 $221,178,600 $542,104 $530,000 562 100% 22 Detached 210 $145,008,835 $690,518 $633,000 289 101% 17 Semi-Detached 6 $3,137,355 $522,893 $557,778 6 102% 8 Condominium Townhouse 6 $2,301,500 $383,583 $335,750 10 101% 42 Condominium Apartment 144 $47,681,410 $331,121 $317,000 200 98% 30 Link 0 - - - 0 - - Att/Row/Townhouse 39 $22,595,500 $579,372 $577,500 53 99% 13 Co-Operative Apartment 3 $454,000 $151,333 $155,000 3 94% 46 Detached Condominium 0 - - - 0 - - Co-Ownership Apartment 0 - - - 1 - - NOTES 1 Sales, dollar volume, average sale prices and median sale prices are based on firm transactions entered into the TorontoMLS® system between the first and last day of the month/period being reported. 2 New listings entered into the TorontoMLS® system between the first and last day of the month/period being reported. 3 Active listings at the end of the last day of the month/period being reported. 4 Ratio of the average selling price to the average listing price for firm transactions entered into the TorontoMLS® system between the first and last day of the month/period being reported. 5 Average number of days on the market for firm transactions entered into the TorontoMLS® system between the first and last day of the month/period being reported. 6 Past monthly and year-to-date figures are revised on a monthly basis. Toronto West, July 2011 9
  • 10. Toronto Real Estate Board Regional Housing Market Tables City of Toronto, Toronto W08 JULY 2011 1 1 1 1 2 3 4 5 Sales Dollar Volume Average Price Median Price New Listings Active Listings Avg. SP/LP Avg. DOM All Home Types 99 $58,058,551 $586,450 $480,000 167 272 97% 26 Detached 46 $40,186,601 $873,622 $675,000 61 112 97% 21 Semi-Detached 1 $445,000 $445,000 $445,000 2 1 99% 16 Condominium Townhouse 6 $1,854,500 $309,083 $303,250 5 7 97% 20 Condominium Apartment 41 $12,155,450 $296,474 $271,000 94 140 98% 31 Link 0 - - - 0 0 - - Att/Row/Townhouse 5 $3,417,000 $683,400 $700,000 4 10 98% 32 Co-Operative Apartment 0 - - - 0 1 - - Detached Condominium 0 - - - 1 1 - - Co-Ownership Apartment 0 - - - 0 0 - - 6 City of Toronto, Toronto W08 YEAR-TO-DATE 2011 Sales1 Dollar Volume1 Average Price1 Median Price1 New Listings2 Avg. SP/LP 4 Avg. DOM5 All Home Types 730 $457,924,612 $627,294 $518,963 1,261 100% 24 Detached 411 $360,718,202 $877,660 $715,000 706 100% 19 Semi-Detached 11 $5,114,000 $464,909 $455,000 13 102% 19 Condominium Townhouse 35 $12,263,375 $350,382 $328,000 51 101% 21 Condominium Apartment 255 $72,389,610 $283,881 $256,000 462 98% 32 Link 0 - - - 0 - - Att/Row/Townhouse 11 $6,383,925 $580,357 $519,925 22 99% 18 Co-Operative Apartment 7 $1,055,500 $150,786 $147,500 6 97% 48 Detached Condominium 0 - - - 1 - - Co-Ownership Apartment 0 - - - 0 - - NOTES 1 Sales, dollar volume, average sale prices and median sale prices are based on firm transactions entered into the TorontoMLS® system between the first and last day of the month/period being reported. 2 New listings entered into the TorontoMLS® system between the first and last day of the month/period being reported. 3 Active listings at the end of the last day of the month/period being reported. 4 Ratio of the average selling price to the average listing price for firm transactions entered into the TorontoMLS® system between the first and last day of the month/period being reported. 5 Average number of days on the market for firm transactions entered into the TorontoMLS® system between the first and last day of the month/period being reported. 6 Past monthly and year-to-date figures are revised on a monthly basis. Toronto West, July 2011 10
  • 11. Toronto Real Estate Board Regional Housing Market Tables City of Toronto, Toronto W09 JULY 2011 1 1 1 1 2 3 4 5 Sales Dollar Volume Average Price Median Price New Listings Active Listings Avg. SP/LP Avg. DOM All Home Types 47 $17,030,400 $362,349 $390,000 87 150 99% 29 Detached 20 $10,793,500 $539,675 $540,000 45 50 99% 22 Semi-Detached 4 $1,633,900 $408,475 $401,000 6 4 101% 12 Condominium Townhouse 3 $1,382,000 $460,667 $535,000 6 5 97% 10 Condominium Apartment 18 $2,904,000 $161,333 $118,000 29 88 97% 36 Link 0 - - - 0 0 - - Att/Row/Townhouse 0 - - - 0 2 - - Co-Operative Apartment 2 $317,000 $158,500 $158,500 1 1 96% 104 Detached Condominium 0 - - - 0 0 - - Co-Ownership Apartment 0 - - - 0 0 - - 6 City of Toronto, Toronto W09 YEAR-TO-DATE 2011 Sales1 Dollar Volume1 Average Price1 Median Price1 New Listings2 Avg. SP/LP 4 Avg. DOM5 All Home Types 324 $127,783,253 $394,393 $421,050 622 99% 35 Detached 165 $91,721,103 $555,885 $547,200 281 100% 24 Semi-Detached 13 $5,055,999 $388,923 $392,000 18 99% 18 Condominium Townhouse 18 $7,331,700 $407,317 $347,450 32 98% 28 Condominium Apartment 120 $22,267,950 $185,566 $159,750 279 96% 50 Link 1 $440,001 $440,001 $440,001 1 98% 26 Att/Row/Townhouse 0 - - - 3 - - Co-Operative Apartment 7 $966,500 $138,071 $137,000 8 96% 101 Detached Condominium 0 - - - 0 - - Co-Ownership Apartment 0 - - - 0 - - NOTES 1 Sales, dollar volume, average sale prices and median sale prices are based on firm transactions entered into the TorontoMLS® system between the first and last day of the month/period being reported. 2 New listings entered into the TorontoMLS® system between the first and last day of the month/period being reported. 3 Active listings at the end of the last day of the month/period being reported. 4 Ratio of the average selling price to the average listing price for firm transactions entered into the TorontoMLS® system between the first and last day of the month/period being reported. 5 Average number of days on the market for firm transactions entered into the TorontoMLS® system between the first and last day of the month/period being reported. 6 Past monthly and year-to-date figures are revised on a monthly basis. Toronto West, July 2011 11
  • 12. Toronto Real Estate Board Regional Housing Market Tables City of Toronto, Toronto W10 JULY 2011 1 1 1 1 2 3 4 5 Sales Dollar Volume Average Price Median Price New Listings Active Listings Avg. SP/LP Avg. DOM All Home Types 103 $30,533,271 $296,440 $280,000 158 272 98% 22 Detached 49 $19,611,005 $400,225 $385,000 55 71 98% 21 Semi-Detached 6 $1,969,388 $328,231 $332,000 10 10 98% 14 Condominium Townhouse 13 $2,260,278 $173,868 $198,000 23 35 99% 18 Condominium Apartment 33 $6,158,500 $186,621 $167,500 69 154 97% 26 Link 0 - - - 0 1 - - Att/Row/Townhouse 1 $370,100 $370,100 $370,100 1 1 101% 38 Co-Operative Apartment 1 $164,000 $164,000 $164,000 0 0 97% 54 Detached Condominium 0 - - - 0 0 - - Co-Ownership Apartment 0 - - - 0 0 - - 6 City of Toronto, Toronto W10 YEAR-TO-DATE 2011 Sales1 Dollar Volume1 Average Price1 Median Price1 New Listings2 Avg. SP/LP 4 Avg. DOM5 All Home Types 600 $165,687,566 $276,146 $277,950 1,081 97% 30 Detached 265 $102,764,511 $387,791 $374,000 425 98% 23 Semi-Detached 28 $9,112,888 $325,460 $329,000 48 97% 25 Condominium Townhouse 63 $10,482,878 $166,395 $182,000 124 98% 28 Condominium Apartment 234 $40,130,289 $171,497 $162,000 469 97% 40 Link 2 $600,000 $300,000 $300,000 3 95% 49 Att/Row/Townhouse 7 $2,433,000 $347,571 $360,000 11 98% 25 Co-Operative Apartment 1 $164,000 $164,000 $164,000 1 97% 54 Detached Condominium 0 - - - 0 - - Co-Ownership Apartment 0 - - - 0 - - NOTES 1 Sales, dollar volume, average sale prices and median sale prices are based on firm transactions entered into the TorontoMLS® system between the first and last day of the month/period being reported. 2 New listings entered into the TorontoMLS® system between the first and last day of the month/period being reported. 3 Active listings at the end of the last day of the month/period being reported. 4 Ratio of the average selling price to the average listing price for firm transactions entered into the TorontoMLS® system between the first and last day of the month/period being reported. 5 Average number of days on the market for firm transactions entered into the TorontoMLS® system between the first and last day of the month/period being reported. 6 Past monthly and year-to-date figures are revised on a monthly basis. Toronto West, July 2011 12