Condition Monitoring (PdM) Maturity Matrix - Know Best Practices
•
8 recomendaciones•4,801 vistas

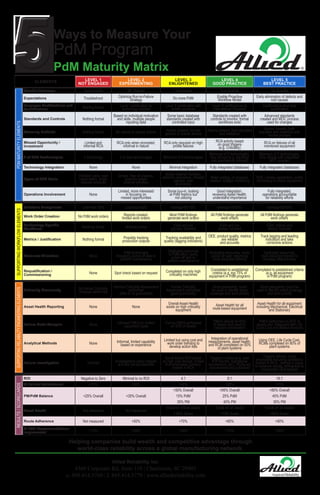
Use the PdM Maturity Maturity Matrix to identify gaps and maturity of the your current PdM Program. Most companies use a few types of PdM Technology however few maintenance organizations are focused on early detection of specific failure modes and responding by writing a work order, planning and scheduling work to eliminate the defect before the equipment fails. Balancing PM and PdM is not an easy task however it can be achieved through a disciplined maintenance process.
Recomendados

Recomendados
Más contenido relacionado
La actualidad más candente
La actualidad más candente (20)
Destacado
Destacado (19)
Similar a Condition Monitoring (PdM) Maturity Matrix - Know Best Practices
Similar a Condition Monitoring (PdM) Maturity Matrix - Know Best Practices (20)
Más de Ricky Smith CMRP, CMRT
Más de Ricky Smith CMRP, CMRT (20)
Último
Último (20)
Condition Monitoring (PdM) Maturity Matrix - Know Best Practices
- 1. Ways to Measure Your PdM Program PdM Maturity Matrix ELEMENTS LEVEL 1 NOT ENGAGED LEVEL 2 EXPERIMENTING LEVEL 3 ENLIGHTENED LEVEL 4 GOOD PRACTICE LEVEL 5 BEST PRACTICE PdMMATURITYELEMENTS Quartile Coverage Spot checks 4th Quartile 3rd Quartile 2nd Quartile 1st Quartile Expectations Troubleshoot Optimize Run-to-Failure Strategy Do more PdM Enable Proactive Workflow Model Early elimination of defects and root causes Employee Certifications and Qualifications Nothing formal Level I certification by technology supplier Level II certification with written practices Level III certifications to International Standard Certifications plus task qualification Standards and Controls Nothing formal Based on individual motivation and skills, multiple people inputting data Some basic database standards created with controlled input Standards created with controls to monitor, formal workflows exist Advanced standards created and MOC process used for changes Alarming Methods Nothing formal No alarms to overall alarms Alarms present, but are generic or overall alarms Alarms present, both standard and statistical Alarms present, both standard and statistical with review process Missed Opportunity / Investment Limited and informal RCA RCA only when prompted, informal in nature RCA only required on high profile failures RCA activity based on good triggers (e.g. Criticality) RCA on failures of all monitored equipment # of PdM Technologies 1 technology 2 or less technologies Minimum of 3 technologies Minimum of 5 technologies, fully utilized (e.g. electrical and mechanical infrared) Minimum of 5 technologies, fully utilized with integrated NDT program Technology Integration None None Minimal integration Fully integrated (database) Fully integrated (database) Types of PdM Tools Vibration pens, spot radiometers, single channel analyzer Simple, free oil analysis, possible single channel vibration Single channel vibration, airborne ultrasonics, infrared camera, paid oil analysis Motor testing, oil analysis, medium voltage monitoring ODS / modal capabilities, online monitoring of critical equipment Operations Involvement None Limited, more interested in focusing on missed opportunities Some buy-in, looking at PdM metrics but not utilizing Good integration, reviewing Asset Health, understand importance Fully integrated, operations accountable for reliability efforts SupportingWorkflowElements Schedule Compliance Less than 50% Less than 60% Average 60-70% Average 70-80% Average 80-90% Work Order Creation No PdM work orders Reports created, limited work orders Most PdM findings generate work orders All PdM findings generate work orders All PdM findings generate work orders Technology Specific Workflows Northing formal Nothing formal Exist and are typically followed Exist and are always followed Exist, refined and always followed Metrics / Justification Nothing formal Possibly tracking production outputs Tracking availability and quality (lagging indicators) OEE, product quality, metrics are reliable and accurate Track lagging and leading indicators and take corrective actions Resource Allocation None PdM technicians frequently pulled off task to perform maintenance Dedicated resources to PdM effort, rarely pulled off task to perform maintenance Dedicated resources, never pulled off task, beginning multi-discipline training Dedicated resources, multi-discipline trained to increase effectiveness Requalification / Commissioning None Spot check based on request Completed on only high criticality machines Completed to established criteria (e.g. top 75% of equipment in PdM program) Completed to established criteria (e.g. all equipment in PdM program) SupportingReliabilityEngineeringElements Criticality Granularity No formal Criticality Analysis performed Informal Criticality Assessment performed (little or no granularity) Formal Criticality Assessment performed (good granularity) Good granularity, could be used to identify asset coverage and work priority Good granularity, could be used to identify asset coverage and work priority Asset Health Reporting None None Overall Asset Health exists on high criticality equipment Asset Health for all route-based equipment Asset Health for all equipment including Mechanical, Electrical and Stationary Failure Mode Analysis None Informal FMEA on limited equipment types Formal FMEA performed on 50% of assets FMEA utilized on 65% of assets and used for program optimization FMEA performed on 80% of assets and integrated with Life Cycle Cost and Weibull Analysis Analytical Methods None Informal, limited capability based on experience Limited but using cost and work order trending to develop action lists Integration of operational measurements, asset health, and RCM completed on 50% of plant systems Using OEE, Life Cycle Cost, RCMs completed on 80% of plant systems Failure Investigation Informal Investigations rarely happen and are not documented Some formal RCA based on high cost failures, limited # of employees formerly trained in RCA Triggers in place (e.g. cost, # of failures, operational involvement, etc.), RCAs are documented and published Triggers refined, many employees including operations trained in RCA, metrics in place to measure results, willingness to incorporate OEM experts Results/Scorecards ROI Negative to Zero Minimal to no ROI 4:1 8:1 16:1 % Failure Maintenance >70% >50% <40% <25% <15% PM/PdM Balance <25% Overall <35% Overall >50% Overall >65% Overall >80% Overall 15% PdM 25% PdM 45% PdM 35% PM 40% PM 35% PM Asset Health Not measured Not measured Exists on critical assets Exists on all assets Exists on all assets > 65% Green >75% Green >80% Green Route Adherence Not measured <50% >70% >85% >90% % PdM Recommendations Implemented <15% <30% >50% >75% >90% PDMMATURITYELEMENTSPDMMATURITYELEMENTSSUPPORTINGRELIABILITYENGINEERINGELEMENTSSUPPORTINGRELIABILITYENGINEERINGELEMENTSRESULTS/SCORECARDSRESULTS/SCORECARDS LEVEL 1 NOT ENGAGED LEVEL 1 NOT ENGAGED LEVEL 2 EXPERIMENTING LEVEL 2 EXPERIMENTING LEVEL 4 GOOD PRACTICE LEVEL 4 GOOD PRACTICE LEVEL 5 BEST PRACTICE LEVEL 5 BEST PRACTICE Allied Reliability Inc. 4360 Corporate Rd, Suite 110 | Charleston, SC 29405 o. 888.414.5760 | f. 843.414.5779 | www.alliedreliability.com Helping companies build wealth and competitive advantage through world-class reliability across a global manufacturing network.