The effect of pdms based microdevice channel width on plasmid dna transformation efficiency in e. coli
•
1 recomendación•579 vistas

The document summarizes an experiment that studied the effect of microdevice channel width on plasmid DNA transformation efficiency in E. coli. Four PDMS microdevices with channel widths of 50 μm, 100 μm, 250 μm, and 500 μm were fabricated and used in chemical transformation trials. While transformation was successful, the data showed high variability and no clear relationship between channel width and transformation efficiency. Future work is needed to improve device design and experimental methods to better study the potential influence of channel width.

Recomendados
Recomendados
Más contenido relacionado
La actualidad más candente
La actualidad más candente (20)
Destacado
Similar a The effect of pdms based microdevice channel width on plasmid dna transformation efficiency in e. coli
Similar a The effect of pdms based microdevice channel width on plasmid dna transformation efficiency in e. coli (20)
Más de Regine Labog
Más de Regine Labog (8)
Último
Último (20)
The effect of pdms based microdevice channel width on plasmid dna transformation efficiency in e. coli
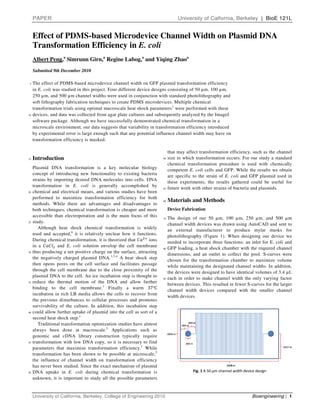
- 1. PAPER University of Calfornia, Berkeley | BioE 121L Effect of PDMS-based Microdevice Channel Width on Plasmid DNA based Transformation Efficiency in E. coli Albert Peng,a Simrunn Girn,a Regine Labog,a and Yiqing Zhaoa Submitted 9th December 2010 5 The effect of PDMS-based microdevice channel width on GFP plasmid transformation efficiency based in E. coli was studied in this project. Four different device designs consisting of 50 µ m, 100 µ m, 250 µ m, and 500 µ m channel widths were used in conjunction with s standard photolithography and soft lithography fabrication techniques to create PDMS microdevices. Multiple chemical transformation trials using optimal macroscale heat shock parameters 1 were performed with these 10 devices, and data was collected from agar plate cultures and subsequently analyzed by the ImageJ ate software package. Although we have successfully demonstrated chemical transformation in a microscale environment, our data suggests that variability in transformation efficiency introduced by experimental error is large enough such that any potential influence channel width may have on l transformation efficiency is masked. that may affect transformation efficiency, such as the channel 15 Introduction 60 size in which transformation occurs. For our study a standard chemical transformation procedure is used with chemically Plasmid DNA transformation is a key molecular biology competent E. coli cells and GFP. While the results we obtain concept of introducing new functionality to existing bacteria are specific to the strain of E. coli and GFP plasmid used in strains by importing desired DNA molecules into cells. DNA these experiments, the results gathered could be useful for transformation in E. coli is generally accomplished by 65 future work with other strains of bacteria and plasmids. 20 chemical and electrical means, and various studies have been ans, performed to maximize transformation efficiency for both 60 Materials and Methods methods. While there are advantages and disadvantages to both techniques, chemical transformation is cheaper and more Device Fabrication accessible than electroporation and is the mai focus of this main 75 The design of our 50 µ m, 100 µ m, 250 µ m, and 500 µ m 25 study. channel width devices was drawn using AutoCAD and sent to Although heat shock chemical transformation is widely an external manufacturer to produce mylar masks for used and accepted,6 it is relatively unclear how it functions. photolithography (Figure 1). When designing our device we During chemical transformation, it is theorized that ions needed to incorporate three functions: an inlet for E. coli and fo in a and E. coli solution envelop the cell membrane 80 GFP loading, a heat shock chamber with the required channel 30 thus producing a net positive charge on the surface, attracting dimensions, and an outlet to collect the pool. S-curves were S the negatively charged plasmid DNA. 1,3,4 A heat shock step chosen for the transformation chamber to maximize volume then opens pores on the cell surface and facilitates passage while maintaining the designated channel widths. In addition, through the cell membrane due to the close proximity of the the devices were designed to have identical volumes of 3.4 µ L e plasmid DNA to the cell. An ice incubation step is thought to 85 each in order to make channel width the only varying factor 35 reduce the thermal motion of the DNA and allow further between devices. This resulted in fewer S-curves for the larger S binding to the cell membrane.1 Finally a warm channel width devices compared with the smaller channel incubation in rich LB media allows the cells to recover from width devices. the previous disturbances to cellular processes and promotes survivability of the culture. In addition, this incubation step 40 could allow further uptake of plasmid into the cell as sort of a second heat shock step. 1 Traditional transformation optimization stud have almost studies always been done at macroscale.5 Applications such as genomic and cDNA library construction typically require 45 transformation with low DNA copy, so it is necessary to find parameters that maximize transformation efficiency. 1 While transformation has been shown to be possible at microscale,2 tion the influence of channel width on transformation efficiency has never been studied. Since the exact mechanism of plasmid 50 DNA uptake in E. coli during chemical transformation is Fig. 1 A 50 µm channel width device design unknown, it is important to study all the possible parameters University of California, Berkeley, College of Engineering 2010 o Bioengineering | 1
- 2. Fig. 3 Experimental procedure used for transformation A standard contact photolithography procedure with 50 competent E. coli was thawed on ice for 30 minutes, after minutes negative SU-8 2035 photoresist was then done using the which 2 µ L GFP plasmid obtained through miniprep was previously created mylar mask and a 4” silicon wafer. Contact added and mixed by gentle tapping. After incubating on ice 5 photolithography was used to keep production costs low while for 30 minutes, 5 µ L of this solution was vacuum loaded into maintaining high resolution of features. Spin coating each device. Vacuum loading was done on ice until the entire parameters were chosen to create a single final photorephotoresist 55 device was loaded. The devices were then placed on a hot ded. height of 50 µ m for all devices (Figure 2), and the appropriate , plate set at for 30 seconds as monitored by a UV exposure times were chosen to accommodate the contact thermocouple, and then placed on ice for 2 minutes. A syringe 10 aligner measured UV intensity, which is variable with the age was placed at the inlet of each device and used air pressure to and quality of the UV bulb. After the necessary heat, evacuate the device of bacteria, and pool was collected at the developing and cleaning treatments, the wafer is then placed 60 outlet and incubated in 50 µ L LB-Amp media for 1 hour. The Amp into a vacuum chamber for silanizing. Silanizing the wafer appropriate dilutions were made and the culture was plated on allows cured PDMS to be more readily removable from the agar-Amp plates and allowed to grow overnight. Pictures were Amp 15 surface of the wafer and is essential for soft lithography. taken the following day and colonies were counted by the counte ImageJ software. Results and Discussion Prior to performing any transformation experiments, we attempted to vacuum load our devices with E. coli to show that vacuum loading is a viable technique to introduce 65 solutions into microdevices. A picture using phase contrast microscopy was taken demonstrating successful vacuum loading (Figure 4). A total of 28 devices were then ). successfully used in transformation runs and had enough ormation colonies on their corresponding plates to be counted. 70 Transformation efficiency is determined quantitatively as the total colony count on each plate, with higher counts equating Fig. 2 Close-up channel dimensions of a 50 µm device s to higher transformation efficiencies. The silanized wafer with all the device features was then used as a mold for PDMS soft lithography. A 10:1 ratio of base to curing agent was weighed out and thoroughly mixed, 20 resulting in a 50 g base: 5 g curing agent mixture. This solution was degassed by vacuum and then poured over the ution clean wafer, and allowed to cure overnight on a hot plate. Once cured, the PDMS layer was carefully peeled off the wafer. Individual devices were cut out from the PDMS 25 sheet and 1 mm holes were punched at the inlet and outlet. hed Devices and microscope glass slides were then both tape cleaned and chemically cleaned by acetone, IPA and DI water, and subjected to UVO treatment to modify the surface chemistry to facilitate bonding. The PDMS devices and sli slides 30 were then bonded together to produce a final useable microdevice. Experimental Procedure Fig. 4 Phase microscopy image of E. coli loaded in a 50 µm device After our devices were created, we began running chemical 65 The first set of experiments we tried to perform included: 3 transformation trials (Figure 3). 20 µ L of chemically . x 50 µ m, 3 x 100 µ m, 3 x 250 µ m, and 3 x 500 µ m channel 2 | Bioengineering University of California, Berkeley, College of Engineering 2010 e
- 3. width devices. We wanted to do three runs of each channel width in order to average the data from all three and generate more reliable results. Out of these runs only: 1 x 50 µ m, 2 x 100 µ m, 2 x 250 µ m, and 2 x 500 µ m devices were able to 5 generate any measurable data (Figure 5). Some devices were not able to load completely in a reasonable amount of time and had to be discarded. In addition, our initial batch of 50 µ m channel width devices were not bonded very well to the glass slides, and popped off when we attempted to use air 10 pressure to empty the device of E. coli. 40 Fig. 6 Colony count data gathered from the second set of transformations In a last attempt to obtain coherent data, we performed a third and final set of transformations. For these trials we used: 4 x 50 µ m, 4 x 100 µ m, 4 x 250 µ m, and 4 x 500 µ m channel 45 width devices. The 50 µ m and 500 µ m channel widths performed the best at an average of 250 and 300 colonies respectively, while the 100 µm and 250 µ m channel widths had 100 and 180 colonies each (Figure 7). Unfortunately this data still does not agree with our previous runs, and we must 50 end this project with inconclusive results. Fig. 5 Colony count data gathered from the first set of transformations The data generated using these devices shows that colony count decreases as channel width increases, since the 100 µ m devices had an average of 900 colonies while the 250 µ m and 15 500 µ m devices had an average of 800 and 600 colonies, respectively. This suggests that smaller channel widths coincide with higher transformation efficiency. However, due to the low number of successful trials for each device, we decided to do more transformations in order to confirm our 20 findings. For the second set of transformation runs we wanted to see if there was a legitimate difference in transformation efficiency between smaller and larger channel widths. Since our data from the first set of runs was relatively sparse due to 25 experimental error, we decided that we should only focus on two channel widths and make sure that we believe our results. We ran trials with 4 x 100 µ m and 4 x 250 µ m devices in the Fig. 7 Colony count data gathered from the third set of transformations same fashion as the first set of runs and gathered the colony data (Figure 6). The data shows that the average colony Different dilution factors were used for each run prior to 30 number from the 100 µ m and 200 µ m devices are 1000 and plating, so the colony counts between runs are very different 1200 respectively, which is in direct contradiction of the trend in our data. However, only the relative difference in colony observed in the first set of runs. This new data suggests that 55 counts between individual devices within runs matters, and there is relatively little difference between the transformation from the three sets of runs that we performed, there was no efficiency of the 100 µ m and 200 µ m channel width devices. clear trend indicating the effect of channel width on 35 Judging from the extreme variability of the individual trials in transformation efficiency. One reason for this could be due to the second run (1500 colonies in trial 1 and 400 colonies in experimental error. The transformation has been shown to be trial 4 of the 250 µ m set), it appeared that our experimental 60 very robust even at a 10x dilution factor across all device methods were still unable to generate consistent results. widths, indicating that slight errors in experimental procedure such as inexact transfer volumes can result in high variability University of California, Berkeley, College of Engineering 2010 Bioengineering | 3
- 4. in colony counts. For example trial 1 of the 50 µ m device in run 2 had 600 colonies while trial 2 of the same device in the same run had only 100 colonies, even though they both experienced a 10x dilution before plating. Any effect that 5 channel width may have had on these colony counts would have been masked by the extreme variability introduced by experimental error. Conclusion Colony count data collected from three separate runs of 10 multiple transformation trials did not reveal a clear trend between microdevice channel width and transformation efficiency. Transformation was robust amongst all devices even at high dilution factors, suggesting that the effect of channel width is small compared to the inherently high 15 transformation efficiency. Variability in colony counts introduced due to experimental error also contributed to the inability to generate consistent data. Due to limitations in our original device design and time constraints we must end this project with inconclusive results. Future work can be done to 20 improve both device design and the experimental procedure by performing everything on-chip, to minimize compounding errors due to inexact off-chip activities such as E. coli evacuation from the device, dilution factors, and inconsistent plating technique. 25 References a College of Engineering, Bioengineering Department, University of California, Berkeley,CA, 94704, USA. 1 Mahipal Singh, Arpita Yadav, Xiaoling Ma and Eugene Amoah. Plasmid DNA Transformation in Escherichia Coli: Effect of Heat 30 Shock Temperature, Duration, and Cold Incubation of CaCl2 Treated Cells. International Journal of Biotechnology and Biochemistry, Volume 6 Number 4 (2010) pp. 561–568. 2 Sha Li, L. Meadow Anderson, Jui-Ming Yanga, Liwei Lin, Haw Yang. DNA transformation via local heat shock. APPLIED 35 PHYSICS LETTERS 91, 2007. 3 W. Edward Swords. Chemical Transformation of E. coli. Methods in Molecular Biology, 2003, Volume 235, 49-53, DOI: 10.1385/1- 59259-409-3:49. 4 Dagert M, Ehrlich SD. Prolonged incubation in calcium chloride 40 improves the competence of escherichia coli cells. Gene. 1979 May;6(1):23-8. 5 Huff JP, Grant BJ, Penning CA, Sullivan KF. Optimization of routine transformation of escherichia coli with plasmid DNA. BioTechniques. 1990 Nov;9(5):570,2, 574, 576-7. 45 6 Bergmans HE, van Die IM, Hoekstra WP. Transformation in escherichia coli: Stages in the process. J Bacteriol. 1981 May;146(2):564-70. 4 | Bioengineering University of California, Berkeley, College of Engineering 2010