SlideShare una empresa de Scribd logo
1 de 40
UGBA-196 Spring 2009: Country Focus Research Portfolio                                                                   Population (millions)
                                                                                                                                                                   Gini Coefficient
                                                                                                                         (2% increase) 1


      Egypt                                                                                                                                                         0.341
                                                                                                    $405B1
                                                                GDP (at PPP)                                         1200

                                                                                                                     1000                                           9
                                                                                                    $5,0001 
                                                                GDP per capita                                       800

                                                                                                                     600
                                                                                                                                                   ___
                                                                                                             
                                                                                                    71.91
                                                                Life Expectancy
      Your Name                                                                                                      400

      Mohammed Al-Shawaf and                                                                                         200
                                                                                                             
                                                                                                    9.1%1
                                                                Unemployment                                                    81,7
      Ami Yoon                                                                                                       0


       BREAD & POVERTY                                                                                                 Size of
                                                                                                                               2
                                                                                                                      BOP/MOP
      The word for bread in Egypt is “aish,” which also
      means “life.quot; Baladi bread is one of four foodstuffs
      subsidized by the government and at less than 1
      cent, the poor rely on it for their sustenance. In
      early 2008 when the prices of global commodities
      soared, long bread lines, rioting and deaths                                                                                                          *Poverty line as defined by
                                                                                                                                                            Egyptian government
      occurred throughout Egypt.3

        HUMAN DEVELOPMENT
      Egypt’s HDI value (.71) ranks 112th out
      of 177 countries, a figure that is made
      more troubling by comparing it with
      countries at the same value but with
      much lower GDP per capita (see
      graph).4


       ENERGY
                                                                                                                                                                                        
                                                                                                                                                                 99%1
                                                                                                                    Electrification
         Egypt’s energy demand grows 3% a year but is expected to decline over
                                                                                                                                                                                        
                                                                                                                                                                 .07%10
                                                                                                                    Forest Cover
         the next 3 decades. Egypt’s primary export is crude oil, but its
         production has peaked and by 2010 it will be a net oil importer. Its
                                                                                                                                                                 2.0 tons4 
                                                                                                                    CO2/capita
         importance as a strategic energy area will remain as it boasts significant
         natural gas reserves and is a key transit route for oil and gas from the
                                                                                                                                                                                        
                                                                                                                                                                 13.4%1
                                                                                                                    GDP from agr.
         Middle East to Europe.5

       DEMOGRAPHICS & OCCUPATIONS                                             Egypt is the most populous
                                                    13
                                                                              Arab country and second-
                       Median Salary by Job
                                                                              most populous country in
            Mechanical Engineer (28)
                                                                              Africa. The Nile River basin,
              Projet Manager, IT (36)                                         accounting for 3% of Egypt’s
                                                                              land, is one of the most
                      IT Manager (42)
                                                                              densely populated areas in
              Software Engineer (54)
                                                                              the world and is home to 90%
                                                                              of Egyptians.6
                                      0              200,000
      Currency: EGP, As of 2009, reporting 2,217 individuals

       LANDSCAPE                                                                                                         % Urban11
         Egypt is a presidential democracy and an ally of
         the U.S., but the ruling party headed by Hosni                                                             ‘75          42.9%
         Mubarak has been consistently accused of
                                                                                                                    ‘05          42.6%
         human rights abuses and authoritative measures
         to curtail dissent and opposition. The country has
                                                                                                                    ‘15          43.6%
         been under a state of emergency since 1981.1
 Sources:                                           Sources:                                                     Sources:
 1.           CIA World Factbook                    4. UNDP Human Development Report                             9. Earth Trends WRI
 2.           Nawar, Abdel-Hameed (2007). quot;quot;From    5. International Energy Agency                               10. rainforests.mongabay.com/deforestation
              Marina to Kom-Ombo: A Note on         6. http://geography.howstuffworks.com/africa/the-nile-       11. Population Reference Bureau
              Poverty in Egyptquot;quot;.                               river.htm/printable                              12.http://www.clickafrique.com/Magazine/ST014/CP0000002798.aspx
 3.           quot;Bread Lines Symbolize Egyptians'     7. Wssinfo.org/en/watqurey.html                              13. http://www.payscale.com/research/EG/Country=Egypt/Salary/by_City
              Financial Woes.quot; 17 Apr. 2008. NPR.   8. Mdgs.un.org/unsd/mdg/data.aspx
UGBA-196 Spring 2009: Country Focus Research Portfolio                                                                                                        Gini Coefficient1
                                                                                                                     Population 6.8 (millions)
                                                                                                                     (2.39% increase)1
                                                                                                                                                                   0.57
                                                                                                            
                                                                                     $29.1B1
                                               GDP (at PPP)

 Paraguay
                                                                                                                 1200

                                                                                                                 1000
                                                                                                            
                                                                                     $4,3001
                                               GDP per capita                                                    800
                                                                                                                                      % of P opulation at
                                                                                                                 600
                                                                                                            
                                                                                     75.561
                                               Life Expectancy                                                                                        Less than
                                                                                                                                              BOP
                                                                                                                 400                                          $ 3000
 Dai Tran
                                                                                                            
                                                                                     5.4%1
                                               Unemployment                                                      200
                                                                                                                                                              M o re than
 Miriam Alvarado                                                                                                            6.8
                                                                                                                                                              $ 3000
                                                                                                                 0


     GOVERNMENT & RELIGIONS
 •Democratization began in 1989
                                                            •90% Catholic .
 •The national government control 97% of the
 state budget.

 •Paraguay ranked 3rd most corrupt– drug
 trafficking is a big part of this.

      ECONOMY                                      •Inflation rate is moderate 11%1.
                                                                                                                                               Wate r (x)
 •Informal labor accounts for half of the
                                                   •30% population live below $2/day.
 workforce                                                                                                           L ife Expe c tanc y
                                                                                                                                                                   S anitation (x)
                                                                                                                             (x)
 •GDP comes mostly from exporting                                                   E conomic S ectors1
 agriculture, electricity and services.                                                       S ervice
                                                                                                                                                              A tte nde d births
                                                                                                                               Hung e r (x)
                                                                                              Agriculture
                                                                                                                                                                      (x)
                                                                                              Indus try
                                                                                                                                                              4
 •Lack of natural resources/fossil fuels                                                      Other
                                                                                                            7
                                                                                                                                                            220V
      ENVIRONMENT & ENERGY
                                                                                                                                                                                
                                                                                                                                                             86%4
                                                                                                                 Electrification
 •Hydro-electricity producer with 2 largest plants
 in the world, exporting 64 Billion Kwh/ year, but
                                                                                                                                                                                
                                                                                                                                                             46.5%4
                                                                                                                 Forest Cover
 depends on foreign oil and gas
                                                                                                                                                             0.7 tons4 
                                                                                                                 CO2/capita
                                                                                                            9
                                                                   Itaipú: world
 •Forrest occupies almost 50% the total area, but it’s
                                                                   biggest
 declining at a fast rate.                                                                                                                                                      
                                                                                                                                                             23.1%1
                                                                                                                 GDP from agr.
                                                                   hydroelectric
                                                                   plant.
 •No coastline.
      HEALTH
 •Distribution of health, and health access is
                                                                                                                                          L ite rac y (x)
 unequal –rural infant mortality is 2.5 times higher
 than urban                                                                                                               Educ ation                           Mobile
                                                                                                  8
                                                                                                                        S pe nding (x)                      P hone s (x)
 •HIV= 0.5%, Tuberculosis= 33%.                      *Abortions: illegal except as life                                         Girls in
                                                                                                                                                       Inte rne t (x)
                                                                                                                              S c hool (x)
                                                     threatening.                                                                                      4
 •*Major infectious diseases: bacterial              *Major drug traficking country in
 diarrhea, Hepatitis A, Typhoid fever.               South America.
      EDUCATION & TECHNOLOGY                                                                                         % Urban4
                                                                                                                                                   R elig ions P rac tic ed 1
 •Literacy rate is high in both female and         *Low ICT: only 34 internet, 54
                                                                                                                1975               39 %
 male (93% and 96%).                               landline, and 320 cellular users per
                                                   1000 people.
                                                                                                                2005           58.5 %                                       Protestant
 •Half of paraguayan children drop out             *Low Tech: Import all vehicles and                                                                                       Catholic
                                                                                                                                                                            Christian
 before 8th grade because of financial             industrial machineries.                                      2015              64.4%                                     None
 impediments5                                      *Only 79 researchers per million.
                                                                                                            6
 Sources:                                   Sources:                                                                    Sources:
 1.CIA World Factbook                       5. Paraguay: Social Issues Development Report, 2004                         8. www.photiuscom
 2.The Next Four Billion                    www.worldbank.org                                                           9. UNESCO: www.portal.unesco.org/
 3.Chapter 11: Appendix                     6. www.antislavery.org
 4.UNDP Human Development Report            7.MSN Encarta www.images.encart.msn.com/
UGBA-196 Spring 2009: Country Focus Research Portfolio                                                              Population (millions)
                                                                                                                                                                Gini Coefficient1

   Tanzania
                                                                                                                    (X% increase)9

                                                                                                                                                                   0.35
                                                                                    $56.2B1 
                                                    GDP (at PPP)                                                1200

                                                                                                                1000

                                                                                    $1,4005 
                                                    GDP per capita                                              800                        % of Population at BOP
         Name: Takeru Asakawa
                                                                                                                600                                             Less than$3000
         SID# 17452276                                                                                    
                                                                                    471
                                                    Life Expectancy                                             400
         Name: Joe Mazzella                                                                                                                                     Morethan
                                                                                                                200
                                                                                                          
                                                                                    12.7%8
                                                    Unemployment                                                                                                $3000
                                                                                                                              38
         SID# 18814170                                                                                          0


      POVERTY
                                                                                                                                   Size and spending of BOP
                                                                                                                                        (No MOP exists)
       Around 36% of Jamaicans live          More than 40% of GDP comes from
       below the poverty line1, and          agriculture, which provides more than
       the country depends on the            85% of exports, 80% of workforce.
       outside world                         Poverty is mainly due to outdated
                                             economic infrastructure(1).


      HEALTH                                        ABORTIONS(10)                                                                            Water (4)
                                                    Yes = abortion permitted

                                                                                                              Life Expectancy
                                                    To save the life of the woman                   Yes
     AIDS9                                                                                                                                                          Sanitation (4)
                                                    To preserve physical health                     Yes              (1)
     6.2% Population HIV+
                                                    To preserve mental health                       Yes
                                                    Rape or incest                                  No
     2ndleading cause of deaths for youth           Foetal impairment                               No                                                        Attended births
                                                                                                                       Nutrition (4)
     ages 15-24                                     Economic or social reasons                      No                                                              (4)
                                                    Available on request                            No
                                                        230Volts 50 Hertz
      ENERGY & ENVIRONMENT
                                                                                                                                                                                     
                                                                                                                                                             11%4
                                                                                                               Electrification
       Lack of overall development however has
                                                                                                                                                                                     
                                                                                                                                                             40%4
                                                                                                               Forest Cover
       hampered the extraction of these various
       resources, and even up to the present
                                                                                                                                                             0.1 tons4 
                                                                                                               CO2/capita
       there has been action on their part to
       develop the natural resource sector but no
                                                                                                                                                                                     
                                                                                                                                                             27%1
                                                                                                               GDP from agr.
       major quantifiable results9.


      ED & TECH
                                                                                                                                               Literacy (4)


                                                                                                              Education Spending (4)                             Mobile Phones (4)


                                                                                                                         Girls in School (4)                 Internet (4)


      LANDSCAPE                                                                                                     % Urban4
                                                                                                                                                   Religions Practiced1
                                                                                                               1975             11%
           Tanzania is now a democratic, as the president and National
           Assembly members are voted for 5 year terms. British rule came to
                                                                                                               2005             24%
           end in 1961, which right afterwards started on to become
                                                                                                                                                                         Islam
           democratic. 9                                                                                                                                                 Indigeneous
                                                                                                               2015             29%                                      Christian
                                                                                                                                                                         None

                                                                                                                       Sources:
                                                                                                                       8. BBC World Poverty 2008
 Sources:                                    Sources:
                                                                                                                       http://www.bbc.co.uk/worldservice/interact/2008/10/081016
 1.CIA World Factbook                        5. UNDP Human Development Report
                                             6. Jamaica Observer, January 29th                                         _yourstory_povertyuk.shtml
 2.The Next Four Billion
                                                                                                                       9.
 3.Earth Trends WRI                          7.http://www.usaid.gov/our_work/global_health/aids/Countri
                                                                                                                       http://www.globalhealthreporting.org/countries/tanzania.asp
 4.UNDP Human Development Report             es/lac/jamaica.html
                                                                                                                       ?collID=11&id=1329&malID=1330&tbID=1331&hivIC=1323&m
UGBA-196 Spring 2009: Country Focus Research Portfolio                                                                                                       Gini Coefficient5
                                                                                                                         Population (millions)
                                                                                                                         (1.29% increase)1
                                                                                                                                                                0.46
  Peru                                                                                        $249.5 B1 
                                                    GDP (at PPP)                                                     1200

                                                                                                                     1000

                                                                                                                                       % of Population at BOP
                                                                                              $8,5001
                                                    GDP per capita                                                   800
                                                                                                                                                            Less than $3000
                                                                                                                     600
                                                                                                                 
                                                                                              70.41
                                                    Life Expectancy                                                  400
                                                                                                                                                            More than $3000
                                                                                                                     200
   Monisha Ashok, Jean Lee                                                                                       
                                                                                              8.3%1
                                                    Unemployment                                                                29.2
                                                                                                                     0


    POVERTY
                                                                                                                         Size and Spending of BOP/MOP
   National poverty rate 49.0%5
   Population living on less than $1 a day 15.5%5
   Population living on less than $ 2 a day 41.4%5
   Poverty rate in the urban population 40.4%5
   Peru’s rapid expansion has lead to a decrease in
   poverty by 15% since 2002.
   Growth has been especially high due to high world prices of minerals and metals
   and recent trade liberalization policies1.

    HEALTH                                                                Major infectious diseases1:
                                                                           Food/water borne: typhoid,
   Public expenditures on health (% of GDP)4: 1.9                                                                                                Water3
                                                                           Hepatitis A
   Health expenditures per capita (PPP US$)4: 235
                                                                           Vector borne: malaria, yellow
   Physicians (per 100,000)4: 117
                                                                           fever, dengue fever                           Life Expectancy4                   Sanitation3
   Under 5 mortality rate (per 1000 live births)4: 27
   Children underweight for age (% under age 5)4: 8                       Total Fertility Rate: 2.42 (close to
                                                                          replacement level fertility of 2) 1
                                                                                                                                   Nutrition6             Attended births4
   HIV/AIDS adult prevalence rate: 0.5%                                   Contraceptive prevalence rate
   82,000 people living with HIV/AIDS1                                    (% of married women 15-49)4: 71
   4,200 deaths from HIV/AIDS1
    ENERGY & ENVIRONMENT
                                                                                                                                                                               
                                                                                                                                                            72%4
                                                                                                                     Electrification
   Population without electricity4: 7.7 million                               Mostly 220 V,
   Energy consumption per capita (kW hours)4: 924                             some 110 V
                                                                                                                                                                               
                                                                                                                                                            54%4
                                                                                                                     Forest Cover
   As % of total primary energy supply4
                                                                            Current environmental
    Coal: 6.7 
                                                                                                                                                            1.1 tons4 
                                                                                                                     CO2/capita
                                                                            problems include deforestation,
    Oil: 53.5 
                                                                            desertification, pollution of
    Gas: 10.6 
                                                                                                                                                                               
                                                                                                                                                            8.4%1
                                                                                                                     GDP from agr.
                                                                            rivers and coastal waters from
    Hydro, solar, wind and geothermal power: 12. 8 
                                                                            municipal and mining wastes.
    Bio mass and waste: 16.4 

    EDUCATION
                                                                                                                                           Literacy4
   Public expenditures on education
   (as % of GDP)4: 2.4
                                                                                                                      Education
   Combined gross enrollment ratio for primary,                                                                                                              Mobile Phones1
                                                                                                                      Spending4
   secondary, and tertiary education: 85.8%4
   Expected number of years spent in school1: 14


                                                                                                                     Girls in School4                  Internet1

    LANDSCAPE AND HISTORY                                                                                                   % Urban4
                                                                                                                                                  Religions Practiced1
   Peru was the center of the Incan Empire until
                                                                                                                     1975        61.5%
   Spanish colonization in 1533. Peru declared its
                                                                                                                                                                 Catholic
   independence from Spain in 1821. After years of
                                                                                                                     2005          73%
   military rule, Peru adopted democracy in 1980.1                                                                                                               Christian


   The 25 regions and 1 province have a varied geography allowing it to shape the economy                                                                        Other
                                                                                          2015                                     75%
   by providing mineral resources, agricultural products, metals and fishing grounds.                                                                            Unspecified/None


      Sources:                                            Sources:
      1.CIA World Factbook                                5. World Bank Earth Trends – Economic Indicators
      2.The Next Four Billion                             6. MDG indicators
      3.WHO Joint Monitoring program - water supply and   7. National Economies Encyclopedia – Americas – Peru
      sanitation                                          8. Living in Peru
      4.UNDP Human Development Report
UGBA-196 Spring 2009: Country Focus Research Portfolio                                                         Population (millions)
                                                                                                                                                                         Gini Coefficient1
                                                                                                               (2.025% increase)1
                                                                                                   
                                                                                        B1
                                         GDP (at PPP)                         $317
                                                                                                                                                                            0.44
   Nigeria
                                                                                                           1200

                                                                                                           1000

                                                                                                                                          Distribution of Income2
                                                                              $2,142 1
                                         GDP per capita                                                    800
                                                                                                                                          % of Population at BOP


                                                                                                           600
                                                                                                   
                                                                              472
                                         Life Expectancy                                                   400
                                                                                                                                                                             Less than $3000   More than $3000


                                                                                                           200
                                                                                                   
                                                                              N/A2
                                         Unemployment                                                                 146,255,312
                                                                                                           0


      POVERTY3                                                                                                                       Size and spending of
         •92% of the population is living on less than $2 a day.                                                                           BOP/MOP
         •Percent of total income earned by the richest
         20% of the population: 55.7%
         •Percent of total income earned by the poorest
         20% of the population: 4.4%
         •National Poverty Rate 34.1%
         •Poverty Rate, Urban Population 30.4%
      HEALTH4
                                                                                                                                    Water (3)
       •Healthcare system consists of primary,
       secondary and tertiary facilities.                                                                 Life Expectancy (5)                                        Sanitation (3)
       •48% 1year olds were immunized
       against TB in 2005                                                                                           Nutrition (5)                                  Attended births (2)
       •13% contraceptive prevalence rate
       (women 15-49)
       •28 physicians per 100,000 people
      ENERGY & ENVIRONMENT (4,1)
                                                                                                                                                                                                                 
                                                                                                                                                                        46%4
                                                                                                          Electrification
       •Current issues: soil degradation; rapid deforestation; urban air and
                                                                                                                                                                                                                 
                                                                                                                                                                        12.2%4
                                                                                                          Forest Cover
       water pollution; desertification; oil pollution - water, air, and soil; has
       suffered serious damage from oil spills; loss of arable land; rapid
                                                                                                                                                                        0.9 tons4 
                                                                                                          CO2/capita
       urbanization
       •They neither import and export electricity.
                                                                                                                                                                                                                 
                                                                                                                                                                        33%3
                                                                                                          GDP from agr.
       •In 2005 Biomass/waste was 78% of total primary energy
       •supply
      ED & TECH (4)
         •56.2% of population is enrolled in education (2005)                                                                          Literacy (4)
         •61% male, 51% female
                                                                                                           Education Spending (4)                                     Mobile Phones (4)
         •0.9% GDP is spent of Education
         •38 internet users per 1000 in 2005                                                                        Girls in School (4)                             Internet (4)
         •1.7% of exports=high tech


         LANDSCAPE (4,1)                                                                                       % Urban4

                                                                                                          1975         23.4%
           •12.2% of land=forest area
           •Slightly more than twice the size of                                                          2005         48.2%
           •CA
                                                                                                          2015         55.9%
           •equatorial in south, tropical in center, arid in north
 Sources:                                    Sources:                                                             Sources:
 1.CIA World Factbook                        5.                                                                   8. BBC World Poverty 2008
                                             6. Jamaica Observer, January 29th
 2.The Next Four Billion                                                                                          http://www.bbc.co.uk/worldservice/interact/2008/10/081016
 3.Earth Trends WRI                          7.http://www.usaid.gov/our_work/global_health/aids/Countri           _yourstory_povertyuk.shtml
 4.UNDP Human Development Report             es/lac/jamaica.html                                                  9. http://hdrstats.undp.org/indicators/40.html
UGBA-196 Spring 2009: Country Focus Research Portfolio                                                     Population (millions)
                                                                                                                                                    Gini Coefficient
                                                                                                           (1.3% increase)4


  El Salvador                                                                                                                                            0.52
                                                                                                   
                                                                                $45.3B1
                                                  GDP (at PPP)                                         1200

                                                                                                       1000                  Distribution of Income
                                                                                $6,4004 
                                                  GDP per capita                                       800

                                                                                                       600
                                                                                                   
                                                                                721
                                                  Life Expectancy                                      400
    Felix Boehme 20788990                                                                              200
                                                                                                   
                                                                                6.4%1
                                                  Unemployment                                                    7.1
    Sean Gossage 18137719                                                                              0


      POVERTY                                      Per capita income is the fifth
                                                                                                                           Size and spending of
                                                   lowest in the Western
        2.5 mm Salvadorians live in the                                                                                          BOP/MOP
                                                   Hemisphere.6
        US. Remittances from these
                                                   Central American Free Trade
                                                                                                                           4.5mm $6bn
        emigrants make up 17% of total
                                                   Agreement (CAFTA) between
        GDP ($3.7bn). For 2 out of 10
                                                                                                                            70% 25.8%
                                                   the US and four C.A. countries
        Salvadorans remittances are
                                                   expected to be key to
        their main source of income.5
                                                   economic growth and
                                                   prosperity.7
       HEALTH                                      Malnutrition persisted in an
                                                   estimated 23% of children under
        The principal causes of death
                                                   five as of 2000. However,
        remain gastroenteritis,
                                                   immunization rates for children up
        influenza, malaria, measles,
                                                   to one year old were quite high in
        pneumonia, and bronchitis,
                                                   1997: tuberculosis, 93%;
        caused or complicated by
                                                   diphtheria, pertussis, and tetanus,
        malnutrition, bad sanitation,
                                                   97%; polio, 96%; and measles,
        and poor housing.
                                                   97%.9
      ENERGY & ENVIRONMENT                              115V                                                                                                       
                                                                                                                                               80%4
                                                                                                       Electrification
        El Salvador is highly polluted and
                                                   Recent studies have shown that
        suffers from severe
                                                                                                                                                                   
                                                                                                                                               14.4%4
                                                                                                       Forest Cover
                                                   the Lempa river, the country's
        environmental degradation. By
                                                   main potable water source, is
        some estimates, only 59 percent                                                                                                        0.9 tons4 
                                                                                                       CO2/capita
                                                   contaminated with dangerously
        of the population has access to
                                                   high levels of mercury and other                                                                                
        safe drinking water. That figure is                                                                                                    11.1%1
                                                                                                       GDP from agr.
                                                   heavy metals.6
        likely optimistic.

      ED & TECH
                                                   educational level among the
         The education system in El
                                                   rural population is 3.4 years.7
         Salvador is weak; only 1 out of
                                                   Most wealthy Salvadorans
         3 complete the ninth grade,
                                                   send their children to private
         only 1 out of 5 complete high
                                                   schools or to schools
         school (1998).
                                                   abroad.There is only one
         Almost 17% of the population is
                                                   public university in the
         illiterate; the average
                                                   country1
      LANDSCAPE                                                                                            % Urban
                                                                                                                                      Religions Practiced1
         El Salvador remains one of the            The effect and threat of violent
                                                                                                        ‘75         41.5%
         five most violent countries in the        crime have led to increased                                                                                Protestant
                                                                                                                                       18%         22%
         world. There is an average of ten         isolation and the curtailment of                                                                           Catholic
                                                                                                                                     5%
                                                                                                        ‘05         59.8%
         murders and a number of car-              recreational opportunities,                                                                                Other

         jackings reported daily to the            including popular beach                                                                                    None
                                                                                                        ‘15         63.2%                    55%
         Police.                                   destinations.
 Sources:                                     5. http://www.youtube.com/watch?v=0NR8Lv0p7Uo
 1.CIA World Factbook                                                                                         8 http://www.state.gov/r/pa/ei/bgn/2033.htm
                                              6.http://www.nationsencyclopedia.com/economies/
 2.The Next Four Billion                                                                                      9.http://www.nationsencyclopedia.com/Americas/El-
                                              Americas/El-Salvador-POVERTY-AND-WEALTH.html
 3.Earth Trends WRI                                                                                           Salvador-HEALTH.html
                                              7.http://www.usaid.gov/policy/budget/cbj2005/lac/s
 4.UNDP Human Development Report              v.html
UGBA-196 Spring 2009: Country Focus Research Portfolio                                                                            Population (millions)
                                                                                                                                                                            Gini Coefficient2
                                                                                                                                  (1.8% increase) 1

   Mozambique                                                                                                                                                                  0.47
                                                                                                                  
                                                                                                 $20B1
                                                                GDP (at PPP)                                                  1200

                                                                                                                              1000

                                                                                                                                                      Distribution of Income3
                                                                                                 $9001
                                                                GDP per capita                                                800

                                                                                                                              600
                                                                                                                  
                                                                                                 41.041
                                                                Life Expectancy                                               400                                            MOP/TOP 28.9%
     Katie Borofka 18737639                                                                                                   200
                                                                                                                  
                                                                                                 21%1
                                                                Unemployment                                                             21.284                                     BOP 71.1%
     Elisa Tonfack 19871623                                                                                                   0


       POVERTY                     Extremely high food
                                   prices have                                                                                                    Size and spending of
                                   negatively affected
                                                                                                                                                       BOP/MOP3
                                   the poorest (and the
                                   most) of
                                   Mozambique’s
                                   population, forcing
                                                             69% of the population lives below the
                                   many to resort to
                                                             poverty line.
                                   cutting back the
                                                             The majority live in rural populations.11
                                   quality and quantity
                                   of food consumed.13

        HEALTH                                                                   Monday, June 11, 2007 : In
                                                             Malaria is
                                                                                                                                                         Water(10)
                                                                                 order to improve the health and
                                                             the primary
                                                                                 safety of women, policymakers
                                                             cause of            in Mozambique have
                                                             mortality                                                          Life
                                                                                 announced that they will
                                                                                                                                                                               Sanitation(10)
                                                                                 consider lifting the country's
                                                             among                                                          Expectancy(1)
                                                                                 ban on abortion.12
                                                             children. 11
                                                               On average, 500 new HIV infections occur every
                                                               day.                                                                                                      Attended
                                                                                                                                      Hunger(16)
                                                               Approximately 1.6 million Mozambicans are
                                                                                                                                                                         Births(17)
                                                               living with HIV.10
                                                                      220 Volts @ 50 Hertz7
       ENERGY & ENVIRONMENT
                                                                                                                                                                                              
                                                                                                                                                                          18%4
                                                                                                                             Electrification
         Currently, “Major projects in the
         pipeline include a $5 billion oil                       The country is extremely
                                                                                                                                                                                              
                                                                                                                                                                          24.6%5
                                                                                                                             Forest Cover
         refinery in Nacala and a second                         vulnerable to
         major hydro-electric project on                         floods, droughts, and                                                                                    0.1 tons6 
                                                                                                                             CO2/capita
         the Zambezi River.”8                                    cyclones, which has led to
                                                                                                                                                                                              
                                                                 the displacement of                                                                                      23.4%1
                                                                                                                             GDP from agr.
                                                                 thousands of people. 11
         Zambezi River
                                                          Radio Mocambique: state-
       ED & TECH                     Primary                                                                                                          Literacy(1)
                                                          run, operates national
                                     school               AntenaNacional network and
                                     children             provincial and local channels in
                                                                                                                            Education                                          Mobile
                                     painted              Portuguese, English and many
                                                                                                                           Spending(1)                                        Phones(1)
                                     their                indigenous languages.14
                                                  New cashew processing
                                     dreams for technology, introduced in
                                     better          2002 by a local
                                     education entrepreneur and funded                                                                 Girls in
                                                                                                                                                                        Internet(1)
                                     last July.10      by USAID.15                                                                   School(10)
                                                                                                                                              2
       LANDSCAPE                                                                                                                  % Urban
                                       Politics…                                                                                                                                         Catholic
                                                                                                                                                           Religions Practiced1
       Mozambique gained
                                           Prime Minister Luisa Diogo insists that perceptions of                                                                                        Muslim
      independence in 1975                                                                                                   ‘75          4.32%
                                           Africa should change “because today's Africa is a new
       from Portugal, but it                                                                                                                                                             Zionist
                                           Africa, where business opportunities are flourishing,
      wasn’t until 1990 that                                                                                                                                                             Christian
                                                                                                                             ‘05             32%
                                           where investments are being made in education,                                                                                                other
          it instituted a
                                           health and infrastructures, and where there is
            democratic
                                                                                                                             ‘15             70%
                                           permanent accountability before the African Union.”9                                                                                          none
          government.1
 1. CIA World Factbook                               7. Treehousehttp://treehouse.ofb.net/go/en/voltage/Mozambique        12. Mozambique Considers Lifting Abortion Ban to Protect Women's Lives
 2. Nation Master http://www.nationmaster.com        8. Farming to bolster Mozambique GDP in 2009                         http://www.indybay.org/newsitems/2007/06/11/18426821.php
 3. The Next Four Billion                            http://www.guardian.co.uk/business/feedarticle/8336442               13. UN Mozambique http://unmozambique.org
 4. Electricity sector reform in Mozambique          9. Mozambique: Diogo criticizes poor perceptions of Africa           14. BBC News http://news.bbc.co.uk
 http://www.sciencedirect.com                        http://allafrica.com/stories/200902020058.html                       15. USAID http://usaid.gov
 5.                                                  10. UNICEF http://www.unicef.org/mozambique                          16. World Food Programme
 Mongabayhttp://rainforests.mongabay.com/20mozambi   11. WHO                                                              http://www.wfp.org/country_brief/indexcountry.asp?country=508
 que.htm                                             http://www.who.int/hac/crises/moz/background/Mozambique_Sept05.pdf   17. Population Reference Bureau http://www.prb.org/Countries/Mozambique.aspx
Gini Coefficient
                                                                                                             Population (millions)
UGBA-196 Spring 2009: Country Focus Research Portfolio
                                                                                                             (0.6% increase)9
                                                                                                                                                            .47
   China                                                                                               
                                                                                         $7.8T1
                                                          GDP (at PPP)                                               1.3B
                                                                                                           1300

                                                                                                           1200

                                                                                         $6,1003                                  % of Population at
                                                          GDP per capita                                   1000
                                                                                                                                                   Less than
                                                                                                                                          BOP
                                                                                                           800
                                                                                                                                                        $3000
                                                                                         72/757
   Central                                                Life Expectancy                                  600
                                                                                                                                                         More than
   Alean Daniel                                                                                            400
                                                                                                       
                                                                                         4.2%1                                                           $3000
                                                          Unemployment
   Michelle Wu                                                                                             200
                                                                                                             0

       POVERTY                                                                                                              Spending of BOP/MOP
     Resource prices have been
     consistently rising, imposing
     pressure on farmers and
     people. Gas on average
     increased 11%. Jiangxi and                                                                  5
     Henan’s farming resources
     increased around 65%. 6

        HEALTH                                                                                                                Water
     Pressing diseases:
                                                                                                              Life
                                           China ranks first for                                                                        Sanitation
     1. Food and waterborne 2.                                           3.      30 million out of
                                                                                                           Expectancy
                                           percentage of adult
         disease such as                                                         340 million under
                                           population that
         bacterial diarrhea,                                                     17 suffer from
                                                                                                                                      Attended
                                           smokes with 67%
         hepatitis A and typhoid                                                 mental and or                    Nutrition
                                           of adults smoking.9
         fever1                                                                                                                         births
                                                                                 behavioral
              1. H5N1                                                            problems. 10
              2. Bird Flu
                                                               220 – 240 Volts
       ENERGY & ENVIRONMENT
                                                                                                                                                                     
                                                                                                                                                 99%2
                                                                                                           Electrification
     In 2006, central China’s
     industrial work growth was China is predicted to be the
                                                                                                                                                                     
                                                                                                                                                 21.2%2
                                                                                                           Forest Cover
     21.41%, $9169.55              world’s largest emitter of
     billion, leading all parts of greenhouse gases by 2010
     China. Electronic resources affecting climate change.
                                                                                                                                                 3.8 tons2 
     are becoming                  The authorities show no                                                 CO2/capita
     scarce, putting a constraint concern for mitigating this
     on its economic growth. 6 pollution. 11                                                                                                                         
                                                                                                                                                 10.6%1
                                                                                                           GDP from agr.
       ED & TECH
           1/6 of the population student                  300m internet users
           aged. 20m students alone are                   according to CNNIC. China
           in higher education. There is                  monitors internet usage and
           stiff competition for entrance                 silences critics of the
           into universities, a national                  government. Google provides
           exam is required.10                            a separate censored search
                                                          engine.
       LANDSCAPE                                                                                             % Urban

                                  Situated between resource-rich western regions and booming               ‘75        17.4%
                                  eastern regions, it is poised to become a manufacturing base for
                                  both finished goods and raw materials. It is also being developed
                                                                                                           ‘05        40.4%
                                  to be a transportation hub and major grain producer.

                                                                                                           ‘15        49.2%
                                                      Sources:                                                    Sources:
 Sources:
                                                      5. 中部地区各省宏观税负差异的实证分析[1].pdf                                 9. http://www.nationmaster.com
 1.CIA World Factbook
                                                      6. 当前中部地区经济发展的问题与建议[1].pdf                                  10.http://www.medicalnewstoday.com/articles/1482
 2.UNDP Human Development Report
                                                      7. World Health Organization (WHO)                          6.php
 3.CIA World Factbook
                                                      8. http://www.wpro.who.int/countries/2008/chn/              11. BBC World Poverty 2008
 4.http://hdrstats.undp.org/indicators/40.html
UGBA-196 Spring 2009: Country Focus Research Portfolio
                                                                                                                   Distribution of Income
                                                           GDP (at PPP)                     $34.23B


  Uganda
                                                                                                                              % of Population at BOP


                                                                                                                                                                                  Gini
                                                           GDP per capita                   $1,100
                                                                                                                                                                                Coefficient
                                                                                                                                                               Less
                                                                                                                                                               than
                                                                                                                                                               $3000


                                                                                                                                                                                   0.46
                                                                                                                                                                  minu


                                                                                                       
                                                                                            49.71
                                                           Life Expectancy                                                                                     More
                                                                                                                                                               than
                                                                                                                                                               $3000


    Brittany Deyan, David Dinh
                                                                                                       
                                                           Unemployment                     3.2%

      Poverty
                                                                                                                                             Size and spending of
        Income:
                                                                                                                                                   BOP/MOP
        Around 37.7% of Ugandans live below the poverty line
        and the country, being land locked, depends on the
        outside world.

        Dependency:
        31.8% of Uganda’s imports are from Kenya, Uganda’s
        largest import partner


                                                                                                                                                       Water

       Health
        AIDS                                      Access:
        4.1% HIV/AIDS prevalence rate             Sanitation: 42%                                           Life Expectancy                                                               Sanitation

        1.7% of the population has                Drugs: 50%
        AIDS
                                                  Physicians: .8/1000
        78,000 deaths from HIV in 2003
        Abortion:Illegal under the following conditions:
        1. If women is raped or incest 2. Economic or social                                                                    Hunger                                       Attended births
        reasons

      Children & Education
                                                                                                                                                                                                             
                                                                                                                                                                         9%4
                                                                                                             Electrification
      School                                Orphans:
                                                                                                                                                                                                             
                                                                                                                                                                         18.4%4
                                                                                                             Forest Cover
      Primary level enrollment: 56%         Nearly half of the 2
                                            million orphans are due
      Secondary level enrollment:
                                                                                                                                                                                                             
                                            to AIDS.
                                                                                                                                                                         .1 tons4
                                                                                                             CO2/capita
      12%
      Tertiary level enrollment: 3%         Night Commuters:
                                                                                                                                                                                                             
                                                                                                                                                                         29%1
                                                                                                             GDP from agr.
                                            Around 40,000 unaccompanied children “night commute”
      Youth Literacy: 76.6%                 each night to escape the LRA.

                                                                                                                                                       Literacy
      Landscape and Environment
      Physical Landscape:
      The Nile River starts at the base of Uganda and flows
                                                                                                           Education Spending                                                           Mobile Phones
      north to the mediterranean sea.

      Political Environment:
      Uganda’s current President, Yoweri Museveni, came into power in 1986. The country
      has been in a civil war for the last 22 years between the Lord’s Resistance Army and
      the Ugandan government.The war has been named the worst humanitarian crisis in the
                                                                                                                          Girls in School                                    Internet
      world today.

      Uganda Today                                                                                                 % Urban
                                                                                                                                                                                                1
                                                                                                                                                                          Religions Practiced


      Displacement: 1.8 million Internally Displaced
                                                                                                             ‘75                          7%
      Persons (IDPs)                                                                                                                                                                                Roman Catholic


      Water & Sanitation: access to as little as 4.6                                                                                                                                                Protestant


                                                                                                             ‘05                 12.6%
      liters of water per day. Toilet facilities are also over                                                                                                                                      Muslim


      capacity or non-existent                                                                                                                                                                      other


                                                                                                             ‘15                 14.5%
      Aid & Development: When peace comes, the
      challenge for development begins.


 Sources:                                               Sources:                                                       Sources:
 1.CIA World Factbook                                   5. UNDP Human Development Report                               8. BBC World Poverty 2008
 2.The Next Four Billion                                6. Vanguard- vanguard.invisiblechildren.com                    9. Resolve Uganda
 3.Earth Trends WRI                                     7. Invisible Children- invisiblechildren.com                   10. Unicef
 4.UNDP Human Development Report
UGBA-196 Spring 2009: Country Focus Research Portfolio                                                Population (millions)
                                                                                                                                                   Gini Coefficient1
                                                                                                      (1.6% increase)4


 Bangladesh                                                                          $228.4B1 
                                                                                                                                                      0.33
                                                 GDP (at PPP)                                     1200

                                                                                                  1000
                                                                                     $1,5001 
                                                 GDP per capita                                   800

                                                                                                  600
                                                                                             
                                                                                     63.11
                                                 Life Expectancy                                  400


                                                                                             
                                                                                                  200
     Nicole Ferris                                                                   2.5%1
                                                 Unemployment                                                3.7
                                                                                                  0


      POVERTY                                                                                            Size and spending of BOP/MOP
         45% live below the poverty line2
         30% live on less than US$1 per day2
         •½ of GDP is generated through the
         service sector yet 2/3 of population
         is employed in agriculture.
         •Rice is the single-most-important product.1

                                              98.2% kids-under- 5 vaccinated
      HEALTH
                                              for polio in ’07to keep country
       Morbidity Rates7:
                                              polio free.7
       1.Diarrhea 15.9%
                                              95% pop. received Vitamin A
       2.Intestinal Worm 7.38%
                                              Supplements7
       3.Skin Diseases 9.3%
                                              Tobacco control in textbooks in
       4.Anemia 9.92%
                                              20107
                                                        220V
      ENERGY & ENVIRONMENT                                         Banned plastic
                                                                                                                                                                  
                                                                                                                                                 32%4
                                                                                                  Electrification
                                                                   bags2
     80% of country’s electricity is produced using                 gas8
                                                                                                                                                                  
                                                                                                                                                 6.7%4
                                                                                                  Forest Cover
     Shortage of over 250 mil. cubic feet of gas per day8
     Only 500,000 internet users in ’071                                                                                                        0.3 tons4 
                                                                                                  CO2/capita
             $100 million loan from World Bank8 for solar plant and                                                                                               
                                                                                                                                                 19.1%1
                                                                                                  GDP from agr.
             other renewable energy. (June 2009)

      PEOPLE &
      CULTURE


      LANDSCAPE                                                                                       % Urban4
                                                          Obstacles to growth12:
     Natural Hazards10:                                   mismanaged ports, labor                 1975             9.9%
     Droughts, Cyclones & Floods.                         force > # of jobs, inefficient
                                                          use of energy, political                2005         25.1%
         Limited access to potable water.                 corruption & weak
         Water pollution from pesticides.10                                                       2015         29.9%
                                                          governance.

 Sources:                                   Sources:                                                     Sources:
 1.CIA World Factbook                       5. http://www.wssinfo.org/en/watquery.html                   9. http://hdrstats.undp.org/indicators/40.html
 2.http://www.lonelyplanet.com/bangladesh   6. MDG Indicators                                            10. http://www.discoverybangladesh.com
 3.Earth Trends WRI                         7.Country Health System Profile-WHO                          11. Bangla 2000
 4.UNDP Human Development Report            8. Planet Ark http://planetark.org/wen/51261                 12. World Bank
Egypt Country Profile Research

Más contenido relacionado

Destacado

Donde esta el Dios de justicia
Donde esta el Dios de justiciaDonde esta el Dios de justicia
Donde esta el Dios de justiciaPaulo Arieu
 
Risk management v imp
Risk management v impRisk management v imp
Risk management v impSIVA GOPAL
 
Pubblica amministrazione egovernance comunicazione e marketing nel web 20
Pubblica amministrazione egovernance comunicazione e marketing nel web 20Pubblica amministrazione egovernance comunicazione e marketing nel web 20
Pubblica amministrazione egovernance comunicazione e marketing nel web 20Communication Village
 
KUŞ GRİBİ
KUŞ GRİBİKUŞ GRİBİ
KUŞ GRİBİanttab
 
Hosted Sitebuilders by Liesl Barrell - Montreal Girl Geeks 28042011
Hosted Sitebuilders by Liesl Barrell -  Montreal Girl Geeks 28042011Hosted Sitebuilders by Liesl Barrell -  Montreal Girl Geeks 28042011
Hosted Sitebuilders by Liesl Barrell - Montreal Girl Geeks 28042011Liesl Barrell
 
What stakeholders really think of eLearning. Quality through self-evaluation.
What stakeholders really think of eLearning. Quality through self-evaluation.What stakeholders really think of eLearning. Quality through self-evaluation.
What stakeholders really think of eLearning. Quality through self-evaluation.DeborahJane
 
American Home Sales Prefab Housing - EE in HOME Workshop
American Home Sales Prefab Housing - EE in HOME WorkshopAmerican Home Sales Prefab Housing - EE in HOME Workshop
American Home Sales Prefab Housing - EE in HOME WorkshopICF_HCD
 
2010 I Rendementbijeenkomst
2010 I Rendementbijeenkomst2010 I Rendementbijeenkomst
2010 I Rendementbijeenkomstmr38schev
 
0903 Ayethadis
0903 Ayethadis0903 Ayethadis
0903 Ayethadistransportr
 
Anh Chuyen ve Chua Hai Dong Giesu
Anh Chuyen ve Chua Hai Dong GiesuAnh Chuyen ve Chua Hai Dong Giesu
Anh Chuyen ve Chua Hai Dong GiesuPhuc Nguyen Thanh
 
Continuous deployments in Azure websites (by Anton Vidishchev)
Continuous deployments in Azure websites (by Anton Vidishchev)Continuous deployments in Azure websites (by Anton Vidishchev)
Continuous deployments in Azure websites (by Anton Vidishchev)Alexandra Chudner
 
For a co-operative university?
For a co-operative university?For a co-operative university?
For a co-operative university?Joss Winn
 
Social relations of single people in Poland / Więzi społeczne polskich singli
Social relations of single people in Poland / Więzi społeczne polskich singliSocial relations of single people in Poland / Więzi społeczne polskich singli
Social relations of single people in Poland / Więzi społeczne polskich singliAnna Bujała
 
Conferenceware meeting functionalities
Conferenceware meeting functionalitiesConferenceware meeting functionalities
Conferenceware meeting functionalitiesguest01d22d
 

Destacado (20)

Donde esta el Dios de justicia
Donde esta el Dios de justiciaDonde esta el Dios de justicia
Donde esta el Dios de justicia
 
Risk management v imp
Risk management v impRisk management v imp
Risk management v imp
 
Pubblica amministrazione egovernance comunicazione e marketing nel web 20
Pubblica amministrazione egovernance comunicazione e marketing nel web 20Pubblica amministrazione egovernance comunicazione e marketing nel web 20
Pubblica amministrazione egovernance comunicazione e marketing nel web 20
 
KUŞ GRİBİ
KUŞ GRİBİKUŞ GRİBİ
KUŞ GRİBİ
 
Toronto
TorontoToronto
Toronto
 
Chemistryfm
ChemistryfmChemistryfm
Chemistryfm
 
Hosted Sitebuilders by Liesl Barrell - Montreal Girl Geeks 28042011
Hosted Sitebuilders by Liesl Barrell -  Montreal Girl Geeks 28042011Hosted Sitebuilders by Liesl Barrell -  Montreal Girl Geeks 28042011
Hosted Sitebuilders by Liesl Barrell - Montreal Girl Geeks 28042011
 
30 wcwb
30 wcwb30 wcwb
30 wcwb
 
Shandy Engaging The Social Media
Shandy Engaging The Social MediaShandy Engaging The Social Media
Shandy Engaging The Social Media
 
Condones
CondonesCondones
Condones
 
What stakeholders really think of eLearning. Quality through self-evaluation.
What stakeholders really think of eLearning. Quality through self-evaluation.What stakeholders really think of eLearning. Quality through self-evaluation.
What stakeholders really think of eLearning. Quality through self-evaluation.
 
American Home Sales Prefab Housing - EE in HOME Workshop
American Home Sales Prefab Housing - EE in HOME WorkshopAmerican Home Sales Prefab Housing - EE in HOME Workshop
American Home Sales Prefab Housing - EE in HOME Workshop
 
вебинары конф
вебинары конфвебинары конф
вебинары конф
 
2010 I Rendementbijeenkomst
2010 I Rendementbijeenkomst2010 I Rendementbijeenkomst
2010 I Rendementbijeenkomst
 
0903 Ayethadis
0903 Ayethadis0903 Ayethadis
0903 Ayethadis
 
Anh Chuyen ve Chua Hai Dong Giesu
Anh Chuyen ve Chua Hai Dong GiesuAnh Chuyen ve Chua Hai Dong Giesu
Anh Chuyen ve Chua Hai Dong Giesu
 
Continuous deployments in Azure websites (by Anton Vidishchev)
Continuous deployments in Azure websites (by Anton Vidishchev)Continuous deployments in Azure websites (by Anton Vidishchev)
Continuous deployments in Azure websites (by Anton Vidishchev)
 
For a co-operative university?
For a co-operative university?For a co-operative university?
For a co-operative university?
 
Social relations of single people in Poland / Więzi społeczne polskich singli
Social relations of single people in Poland / Więzi społeczne polskich singliSocial relations of single people in Poland / Więzi społeczne polskich singli
Social relations of single people in Poland / Więzi społeczne polskich singli
 
Conferenceware meeting functionalities
Conferenceware meeting functionalitiesConferenceware meeting functionalities
Conferenceware meeting functionalities
 

Último

The McKinsey 7S Framework: A Holistic Approach to Harmonizing All Parts of th...
The McKinsey 7S Framework: A Holistic Approach to Harmonizing All Parts of th...The McKinsey 7S Framework: A Holistic Approach to Harmonizing All Parts of th...
The McKinsey 7S Framework: A Holistic Approach to Harmonizing All Parts of th...Operational Excellence Consulting
 
20200128 Ethical by Design - Whitepaper.pdf
20200128 Ethical by Design - Whitepaper.pdf20200128 Ethical by Design - Whitepaper.pdf
20200128 Ethical by Design - Whitepaper.pdfChris Skinner
 
Welding Electrode Making Machine By Deccan Dynamics
Welding Electrode Making Machine By Deccan DynamicsWelding Electrode Making Machine By Deccan Dynamics
Welding Electrode Making Machine By Deccan DynamicsIndiaMART InterMESH Limited
 
Driving Business Impact for PMs with Jon Harmer
Driving Business Impact for PMs with Jon HarmerDriving Business Impact for PMs with Jon Harmer
Driving Business Impact for PMs with Jon HarmerAggregage
 
trending-flavors-and-ingredients-in-salty-snacks-us-2024_Redacted-V2.pdf
trending-flavors-and-ingredients-in-salty-snacks-us-2024_Redacted-V2.pdftrending-flavors-and-ingredients-in-salty-snacks-us-2024_Redacted-V2.pdf
trending-flavors-and-ingredients-in-salty-snacks-us-2024_Redacted-V2.pdfMintel Group
 
digital marketing , introduction of digital marketing
digital marketing , introduction of digital marketingdigital marketing , introduction of digital marketing
digital marketing , introduction of digital marketingrajputmeenakshi733
 
20220816-EthicsGrade_Scorecard-JP_Morgan_Chase-Q2-63_57.pdf
20220816-EthicsGrade_Scorecard-JP_Morgan_Chase-Q2-63_57.pdf20220816-EthicsGrade_Scorecard-JP_Morgan_Chase-Q2-63_57.pdf
20220816-EthicsGrade_Scorecard-JP_Morgan_Chase-Q2-63_57.pdfChris Skinner
 
Effective Strategies for Maximizing Your Profit When Selling Gold Jewelry
Effective Strategies for Maximizing Your Profit When Selling Gold JewelryEffective Strategies for Maximizing Your Profit When Selling Gold Jewelry
Effective Strategies for Maximizing Your Profit When Selling Gold JewelryWhittensFineJewelry1
 
Traction part 2 - EOS Model JAX Bridges.
Traction part 2 - EOS Model JAX Bridges.Traction part 2 - EOS Model JAX Bridges.
Traction part 2 - EOS Model JAX Bridges.Anamaria Contreras
 
Introducing the Analogic framework for business planning applications
Introducing the Analogic framework for business planning applicationsIntroducing the Analogic framework for business planning applications
Introducing the Analogic framework for business planning applicationsKnowledgeSeed
 
Excvation Safety for safety officers reference
Excvation Safety for safety officers referenceExcvation Safety for safety officers reference
Excvation Safety for safety officers referencessuser2c065e
 
NAB Show Exhibitor List 2024 - Exhibitors Data
NAB Show Exhibitor List 2024 - Exhibitors DataNAB Show Exhibitor List 2024 - Exhibitors Data
NAB Show Exhibitor List 2024 - Exhibitors DataExhibitors Data
 
WSMM Technology February.March Newsletter_vF.pdf
WSMM Technology February.March Newsletter_vF.pdfWSMM Technology February.March Newsletter_vF.pdf
WSMM Technology February.March Newsletter_vF.pdfJamesConcepcion7
 
Jewish Resources in the Family Resource Centre
Jewish Resources in the Family Resource CentreJewish Resources in the Family Resource Centre
Jewish Resources in the Family Resource CentreNZSG
 
Memorándum de Entendimiento (MoU) entre Codelco y SQM
Memorándum de Entendimiento (MoU) entre Codelco y SQMMemorándum de Entendimiento (MoU) entre Codelco y SQM
Memorándum de Entendimiento (MoU) entre Codelco y SQMVoces Mineras
 
APRIL2024_UKRAINE_xml_0000000000000 .pdf
APRIL2024_UKRAINE_xml_0000000000000 .pdfAPRIL2024_UKRAINE_xml_0000000000000 .pdf
APRIL2024_UKRAINE_xml_0000000000000 .pdfRbc Rbcua
 
Cybersecurity Awareness Training Presentation v2024.03
Cybersecurity Awareness Training Presentation v2024.03Cybersecurity Awareness Training Presentation v2024.03
Cybersecurity Awareness Training Presentation v2024.03DallasHaselhorst
 
Planetary and Vedic Yagyas Bring Positive Impacts in Life
Planetary and Vedic Yagyas Bring Positive Impacts in LifePlanetary and Vedic Yagyas Bring Positive Impacts in Life
Planetary and Vedic Yagyas Bring Positive Impacts in LifeBhavana Pujan Kendra
 
GUIDELINES ON USEFUL FORMS IN FREIGHT FORWARDING (F) Danny Diep Toh MBA.pdf
GUIDELINES ON USEFUL FORMS IN FREIGHT FORWARDING (F) Danny Diep Toh MBA.pdfGUIDELINES ON USEFUL FORMS IN FREIGHT FORWARDING (F) Danny Diep Toh MBA.pdf
GUIDELINES ON USEFUL FORMS IN FREIGHT FORWARDING (F) Danny Diep Toh MBA.pdfDanny Diep To
 
Healthcare Feb. & Mar. Healthcare Newsletter
Healthcare Feb. & Mar. Healthcare NewsletterHealthcare Feb. & Mar. Healthcare Newsletter
Healthcare Feb. & Mar. Healthcare NewsletterJamesConcepcion7
 

Último (20)

The McKinsey 7S Framework: A Holistic Approach to Harmonizing All Parts of th...
The McKinsey 7S Framework: A Holistic Approach to Harmonizing All Parts of th...The McKinsey 7S Framework: A Holistic Approach to Harmonizing All Parts of th...
The McKinsey 7S Framework: A Holistic Approach to Harmonizing All Parts of th...
 
20200128 Ethical by Design - Whitepaper.pdf
20200128 Ethical by Design - Whitepaper.pdf20200128 Ethical by Design - Whitepaper.pdf
20200128 Ethical by Design - Whitepaper.pdf
 
Welding Electrode Making Machine By Deccan Dynamics
Welding Electrode Making Machine By Deccan DynamicsWelding Electrode Making Machine By Deccan Dynamics
Welding Electrode Making Machine By Deccan Dynamics
 
Driving Business Impact for PMs with Jon Harmer
Driving Business Impact for PMs with Jon HarmerDriving Business Impact for PMs with Jon Harmer
Driving Business Impact for PMs with Jon Harmer
 
trending-flavors-and-ingredients-in-salty-snacks-us-2024_Redacted-V2.pdf
trending-flavors-and-ingredients-in-salty-snacks-us-2024_Redacted-V2.pdftrending-flavors-and-ingredients-in-salty-snacks-us-2024_Redacted-V2.pdf
trending-flavors-and-ingredients-in-salty-snacks-us-2024_Redacted-V2.pdf
 
digital marketing , introduction of digital marketing
digital marketing , introduction of digital marketingdigital marketing , introduction of digital marketing
digital marketing , introduction of digital marketing
 
20220816-EthicsGrade_Scorecard-JP_Morgan_Chase-Q2-63_57.pdf
20220816-EthicsGrade_Scorecard-JP_Morgan_Chase-Q2-63_57.pdf20220816-EthicsGrade_Scorecard-JP_Morgan_Chase-Q2-63_57.pdf
20220816-EthicsGrade_Scorecard-JP_Morgan_Chase-Q2-63_57.pdf
 
Effective Strategies for Maximizing Your Profit When Selling Gold Jewelry
Effective Strategies for Maximizing Your Profit When Selling Gold JewelryEffective Strategies for Maximizing Your Profit When Selling Gold Jewelry
Effective Strategies for Maximizing Your Profit When Selling Gold Jewelry
 
Traction part 2 - EOS Model JAX Bridges.
Traction part 2 - EOS Model JAX Bridges.Traction part 2 - EOS Model JAX Bridges.
Traction part 2 - EOS Model JAX Bridges.
 
Introducing the Analogic framework for business planning applications
Introducing the Analogic framework for business planning applicationsIntroducing the Analogic framework for business planning applications
Introducing the Analogic framework for business planning applications
 
Excvation Safety for safety officers reference
Excvation Safety for safety officers referenceExcvation Safety for safety officers reference
Excvation Safety for safety officers reference
 
NAB Show Exhibitor List 2024 - Exhibitors Data
NAB Show Exhibitor List 2024 - Exhibitors DataNAB Show Exhibitor List 2024 - Exhibitors Data
NAB Show Exhibitor List 2024 - Exhibitors Data
 
WSMM Technology February.March Newsletter_vF.pdf
WSMM Technology February.March Newsletter_vF.pdfWSMM Technology February.March Newsletter_vF.pdf
WSMM Technology February.March Newsletter_vF.pdf
 
Jewish Resources in the Family Resource Centre
Jewish Resources in the Family Resource CentreJewish Resources in the Family Resource Centre
Jewish Resources in the Family Resource Centre
 
Memorándum de Entendimiento (MoU) entre Codelco y SQM
Memorándum de Entendimiento (MoU) entre Codelco y SQMMemorándum de Entendimiento (MoU) entre Codelco y SQM
Memorándum de Entendimiento (MoU) entre Codelco y SQM
 
APRIL2024_UKRAINE_xml_0000000000000 .pdf
APRIL2024_UKRAINE_xml_0000000000000 .pdfAPRIL2024_UKRAINE_xml_0000000000000 .pdf
APRIL2024_UKRAINE_xml_0000000000000 .pdf
 
Cybersecurity Awareness Training Presentation v2024.03
Cybersecurity Awareness Training Presentation v2024.03Cybersecurity Awareness Training Presentation v2024.03
Cybersecurity Awareness Training Presentation v2024.03
 
Planetary and Vedic Yagyas Bring Positive Impacts in Life
Planetary and Vedic Yagyas Bring Positive Impacts in LifePlanetary and Vedic Yagyas Bring Positive Impacts in Life
Planetary and Vedic Yagyas Bring Positive Impacts in Life
 
GUIDELINES ON USEFUL FORMS IN FREIGHT FORWARDING (F) Danny Diep Toh MBA.pdf
GUIDELINES ON USEFUL FORMS IN FREIGHT FORWARDING (F) Danny Diep Toh MBA.pdfGUIDELINES ON USEFUL FORMS IN FREIGHT FORWARDING (F) Danny Diep Toh MBA.pdf
GUIDELINES ON USEFUL FORMS IN FREIGHT FORWARDING (F) Danny Diep Toh MBA.pdf
 
Healthcare Feb. & Mar. Healthcare Newsletter
Healthcare Feb. & Mar. Healthcare NewsletterHealthcare Feb. & Mar. Healthcare Newsletter
Healthcare Feb. & Mar. Healthcare Newsletter
 

Egypt Country Profile Research

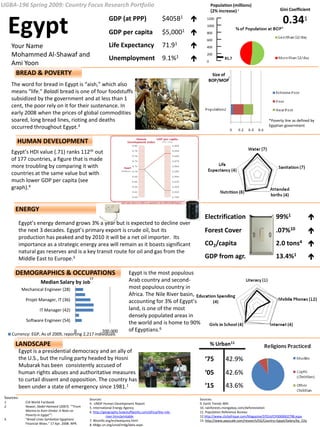
  • 1. UGBA-196 Spring 2009: Country Focus Research Portfolio Population (millions) Gini Coefficient (2% increase) 1 Egypt  0.341 $405B1 GDP (at PPP) 1200 1000 9 $5,0001  GDP per capita 800 600 ___  71.91 Life Expectancy Your Name 400 Mohammed Al-Shawaf and 200  9.1%1 Unemployment 81,7 Ami Yoon 0 BREAD & POVERTY Size of 2 BOP/MOP The word for bread in Egypt is “aish,” which also means “life.quot; Baladi bread is one of four foodstuffs subsidized by the government and at less than 1 cent, the poor rely on it for their sustenance. In early 2008 when the prices of global commodities soared, long bread lines, rioting and deaths *Poverty line as defined by Egyptian government occurred throughout Egypt.3 HUMAN DEVELOPMENT Egypt’s HDI value (.71) ranks 112th out of 177 countries, a figure that is made more troubling by comparing it with countries at the same value but with much lower GDP per capita (see graph).4 ENERGY  99%1 Electrification Egypt’s energy demand grows 3% a year but is expected to decline over  .07%10 Forest Cover the next 3 decades. Egypt’s primary export is crude oil, but its production has peaked and by 2010 it will be a net oil importer. Its 2.0 tons4  CO2/capita importance as a strategic energy area will remain as it boasts significant natural gas reserves and is a key transit route for oil and gas from the  13.4%1 GDP from agr. Middle East to Europe.5 DEMOGRAPHICS & OCCUPATIONS Egypt is the most populous 13 Arab country and second- Median Salary by Job most populous country in Mechanical Engineer (28) Africa. The Nile River basin, Projet Manager, IT (36) accounting for 3% of Egypt’s land, is one of the most IT Manager (42) densely populated areas in Software Engineer (54) the world and is home to 90% of Egyptians.6 0 200,000 Currency: EGP, As of 2009, reporting 2,217 individuals LANDSCAPE % Urban11 Egypt is a presidential democracy and an ally of the U.S., but the ruling party headed by Hosni ‘75 42.9% Mubarak has been consistently accused of ‘05 42.6% human rights abuses and authoritative measures to curtail dissent and opposition. The country has ‘15 43.6% been under a state of emergency since 1981.1 Sources: Sources: Sources: 1. CIA World Factbook 4. UNDP Human Development Report 9. Earth Trends WRI 2. Nawar, Abdel-Hameed (2007). quot;quot;From 5. International Energy Agency 10. rainforests.mongabay.com/deforestation Marina to Kom-Ombo: A Note on 6. http://geography.howstuffworks.com/africa/the-nile- 11. Population Reference Bureau Poverty in Egyptquot;quot;. river.htm/printable 12.http://www.clickafrique.com/Magazine/ST014/CP0000002798.aspx 3. quot;Bread Lines Symbolize Egyptians' 7. Wssinfo.org/en/watqurey.html 13. http://www.payscale.com/research/EG/Country=Egypt/Salary/by_City Financial Woes.quot; 17 Apr. 2008. NPR. 8. Mdgs.un.org/unsd/mdg/data.aspx
  • 2. UGBA-196 Spring 2009: Country Focus Research Portfolio Gini Coefficient1 Population 6.8 (millions) (2.39% increase)1 0.57  $29.1B1 GDP (at PPP) Paraguay 1200 1000  $4,3001 GDP per capita 800 % of P opulation at 600  75.561 Life Expectancy Less than BOP 400 $ 3000 Dai Tran  5.4%1 Unemployment 200 M o re than Miriam Alvarado 6.8 $ 3000 0 GOVERNMENT & RELIGIONS •Democratization began in 1989 •90% Catholic . •The national government control 97% of the state budget. •Paraguay ranked 3rd most corrupt– drug trafficking is a big part of this. ECONOMY •Inflation rate is moderate 11%1. Wate r (x) •Informal labor accounts for half of the •30% population live below $2/day. workforce L ife Expe c tanc y S anitation (x) (x) •GDP comes mostly from exporting E conomic S ectors1 agriculture, electricity and services. S ervice A tte nde d births Hung e r (x) Agriculture (x) Indus try 4 •Lack of natural resources/fossil fuels Other 7 220V ENVIRONMENT & ENERGY  86%4 Electrification •Hydro-electricity producer with 2 largest plants in the world, exporting 64 Billion Kwh/ year, but  46.5%4 Forest Cover depends on foreign oil and gas 0.7 tons4  CO2/capita 9 Itaipú: world •Forrest occupies almost 50% the total area, but it’s biggest declining at a fast rate.  23.1%1 GDP from agr. hydroelectric plant. •No coastline. HEALTH •Distribution of health, and health access is L ite rac y (x) unequal –rural infant mortality is 2.5 times higher than urban Educ ation Mobile 8 S pe nding (x) P hone s (x) •HIV= 0.5%, Tuberculosis= 33%. *Abortions: illegal except as life Girls in Inte rne t (x) S c hool (x) threatening. 4 •*Major infectious diseases: bacterial *Major drug traficking country in diarrhea, Hepatitis A, Typhoid fever. South America. EDUCATION & TECHNOLOGY % Urban4 R elig ions P rac tic ed 1 •Literacy rate is high in both female and *Low ICT: only 34 internet, 54 1975 39 % male (93% and 96%). landline, and 320 cellular users per 1000 people. 2005 58.5 % Protestant •Half of paraguayan children drop out *Low Tech: Import all vehicles and Catholic Christian before 8th grade because of financial industrial machineries. 2015 64.4% None impediments5 *Only 79 researchers per million. 6 Sources: Sources: Sources: 1.CIA World Factbook 5. Paraguay: Social Issues Development Report, 2004 8. www.photiuscom 2.The Next Four Billion www.worldbank.org 9. UNESCO: www.portal.unesco.org/ 3.Chapter 11: Appendix 6. www.antislavery.org 4.UNDP Human Development Report 7.MSN Encarta www.images.encart.msn.com/
  • 3. UGBA-196 Spring 2009: Country Focus Research Portfolio Population (millions) Gini Coefficient1 Tanzania (X% increase)9 0.35 $56.2B1  GDP (at PPP) 1200 1000 $1,4005  GDP per capita 800 % of Population at BOP Name: Takeru Asakawa 600 Less than$3000 SID# 17452276  471 Life Expectancy 400 Name: Joe Mazzella Morethan 200  12.7%8 Unemployment $3000 38 SID# 18814170 0 POVERTY Size and spending of BOP (No MOP exists) Around 36% of Jamaicans live More than 40% of GDP comes from below the poverty line1, and agriculture, which provides more than the country depends on the 85% of exports, 80% of workforce. outside world Poverty is mainly due to outdated economic infrastructure(1). HEALTH ABORTIONS(10) Water (4) Yes = abortion permitted Life Expectancy To save the life of the woman Yes AIDS9 Sanitation (4) To preserve physical health Yes (1) 6.2% Population HIV+ To preserve mental health Yes Rape or incest No 2ndleading cause of deaths for youth Foetal impairment No Attended births Nutrition (4) ages 15-24 Economic or social reasons No (4) Available on request No 230Volts 50 Hertz ENERGY & ENVIRONMENT  11%4 Electrification Lack of overall development however has  40%4 Forest Cover hampered the extraction of these various resources, and even up to the present 0.1 tons4  CO2/capita there has been action on their part to develop the natural resource sector but no  27%1 GDP from agr. major quantifiable results9. ED & TECH Literacy (4) Education Spending (4) Mobile Phones (4) Girls in School (4) Internet (4) LANDSCAPE % Urban4 Religions Practiced1 1975 11% Tanzania is now a democratic, as the president and National Assembly members are voted for 5 year terms. British rule came to 2005 24% end in 1961, which right afterwards started on to become Islam democratic. 9 Indigeneous 2015 29% Christian None Sources: 8. BBC World Poverty 2008 Sources: Sources: http://www.bbc.co.uk/worldservice/interact/2008/10/081016 1.CIA World Factbook 5. UNDP Human Development Report 6. Jamaica Observer, January 29th _yourstory_povertyuk.shtml 2.The Next Four Billion 9. 3.Earth Trends WRI 7.http://www.usaid.gov/our_work/global_health/aids/Countri http://www.globalhealthreporting.org/countries/tanzania.asp 4.UNDP Human Development Report es/lac/jamaica.html ?collID=11&id=1329&malID=1330&tbID=1331&hivIC=1323&m
  • 4. UGBA-196 Spring 2009: Country Focus Research Portfolio Gini Coefficient5 Population (millions) (1.29% increase)1 0.46 Peru $249.5 B1  GDP (at PPP) 1200 1000  % of Population at BOP $8,5001 GDP per capita 800 Less than $3000 600  70.41 Life Expectancy 400 More than $3000 200 Monisha Ashok, Jean Lee  8.3%1 Unemployment 29.2 0 POVERTY Size and Spending of BOP/MOP National poverty rate 49.0%5 Population living on less than $1 a day 15.5%5 Population living on less than $ 2 a day 41.4%5 Poverty rate in the urban population 40.4%5 Peru’s rapid expansion has lead to a decrease in poverty by 15% since 2002. Growth has been especially high due to high world prices of minerals and metals and recent trade liberalization policies1. HEALTH Major infectious diseases1: Food/water borne: typhoid, Public expenditures on health (% of GDP)4: 1.9 Water3 Hepatitis A Health expenditures per capita (PPP US$)4: 235 Vector borne: malaria, yellow Physicians (per 100,000)4: 117 fever, dengue fever Life Expectancy4 Sanitation3 Under 5 mortality rate (per 1000 live births)4: 27 Children underweight for age (% under age 5)4: 8 Total Fertility Rate: 2.42 (close to replacement level fertility of 2) 1 Nutrition6 Attended births4 HIV/AIDS adult prevalence rate: 0.5% Contraceptive prevalence rate 82,000 people living with HIV/AIDS1 (% of married women 15-49)4: 71 4,200 deaths from HIV/AIDS1 ENERGY & ENVIRONMENT  72%4 Electrification Population without electricity4: 7.7 million Mostly 220 V, Energy consumption per capita (kW hours)4: 924 some 110 V  54%4 Forest Cover As % of total primary energy supply4 Current environmental Coal: 6.7  1.1 tons4  CO2/capita problems include deforestation, Oil: 53.5  desertification, pollution of Gas: 10.6   8.4%1 GDP from agr. rivers and coastal waters from Hydro, solar, wind and geothermal power: 12. 8  municipal and mining wastes. Bio mass and waste: 16.4  EDUCATION Literacy4 Public expenditures on education (as % of GDP)4: 2.4 Education Combined gross enrollment ratio for primary, Mobile Phones1 Spending4 secondary, and tertiary education: 85.8%4 Expected number of years spent in school1: 14 Girls in School4 Internet1 LANDSCAPE AND HISTORY % Urban4 Religions Practiced1 Peru was the center of the Incan Empire until 1975 61.5% Spanish colonization in 1533. Peru declared its Catholic independence from Spain in 1821. After years of 2005 73% military rule, Peru adopted democracy in 1980.1 Christian The 25 regions and 1 province have a varied geography allowing it to shape the economy Other 2015 75% by providing mineral resources, agricultural products, metals and fishing grounds. Unspecified/None Sources: Sources: 1.CIA World Factbook 5. World Bank Earth Trends – Economic Indicators 2.The Next Four Billion 6. MDG indicators 3.WHO Joint Monitoring program - water supply and 7. National Economies Encyclopedia – Americas – Peru sanitation 8. Living in Peru 4.UNDP Human Development Report
  • 5. UGBA-196 Spring 2009: Country Focus Research Portfolio Population (millions) Gini Coefficient1 (2.025% increase)1  B1 GDP (at PPP) $317 0.44 Nigeria 1200 1000  Distribution of Income2 $2,142 1 GDP per capita 800 % of Population at BOP 600  472 Life Expectancy 400 Less than $3000 More than $3000 200  N/A2 Unemployment 146,255,312 0 POVERTY3 Size and spending of •92% of the population is living on less than $2 a day. BOP/MOP •Percent of total income earned by the richest 20% of the population: 55.7% •Percent of total income earned by the poorest 20% of the population: 4.4% •National Poverty Rate 34.1% •Poverty Rate, Urban Population 30.4% HEALTH4 Water (3) •Healthcare system consists of primary, secondary and tertiary facilities. Life Expectancy (5) Sanitation (3) •48% 1year olds were immunized against TB in 2005 Nutrition (5) Attended births (2) •13% contraceptive prevalence rate (women 15-49) •28 physicians per 100,000 people ENERGY & ENVIRONMENT (4,1)  46%4 Electrification •Current issues: soil degradation; rapid deforestation; urban air and  12.2%4 Forest Cover water pollution; desertification; oil pollution - water, air, and soil; has suffered serious damage from oil spills; loss of arable land; rapid 0.9 tons4  CO2/capita urbanization •They neither import and export electricity.  33%3 GDP from agr. •In 2005 Biomass/waste was 78% of total primary energy •supply ED & TECH (4) •56.2% of population is enrolled in education (2005) Literacy (4) •61% male, 51% female Education Spending (4) Mobile Phones (4) •0.9% GDP is spent of Education •38 internet users per 1000 in 2005 Girls in School (4) Internet (4) •1.7% of exports=high tech LANDSCAPE (4,1) % Urban4 1975 23.4% •12.2% of land=forest area •Slightly more than twice the size of 2005 48.2% •CA 2015 55.9% •equatorial in south, tropical in center, arid in north Sources: Sources: Sources: 1.CIA World Factbook 5. 8. BBC World Poverty 2008 6. Jamaica Observer, January 29th 2.The Next Four Billion http://www.bbc.co.uk/worldservice/interact/2008/10/081016 3.Earth Trends WRI 7.http://www.usaid.gov/our_work/global_health/aids/Countri _yourstory_povertyuk.shtml 4.UNDP Human Development Report es/lac/jamaica.html 9. http://hdrstats.undp.org/indicators/40.html
  • 6. UGBA-196 Spring 2009: Country Focus Research Portfolio Population (millions) Gini Coefficient (1.3% increase)4 El Salvador 0.52  $45.3B1 GDP (at PPP) 1200 1000 Distribution of Income $6,4004  GDP per capita 800 600  721 Life Expectancy 400 Felix Boehme 20788990 200  6.4%1 Unemployment 7.1 Sean Gossage 18137719 0 POVERTY Per capita income is the fifth Size and spending of lowest in the Western 2.5 mm Salvadorians live in the BOP/MOP Hemisphere.6 US. Remittances from these Central American Free Trade 4.5mm $6bn emigrants make up 17% of total Agreement (CAFTA) between GDP ($3.7bn). For 2 out of 10 70% 25.8% the US and four C.A. countries Salvadorans remittances are expected to be key to their main source of income.5 economic growth and prosperity.7 HEALTH Malnutrition persisted in an estimated 23% of children under The principal causes of death five as of 2000. However, remain gastroenteritis, immunization rates for children up influenza, malaria, measles, to one year old were quite high in pneumonia, and bronchitis, 1997: tuberculosis, 93%; caused or complicated by diphtheria, pertussis, and tetanus, malnutrition, bad sanitation, 97%; polio, 96%; and measles, and poor housing. 97%.9 ENERGY & ENVIRONMENT 115V  80%4 Electrification El Salvador is highly polluted and Recent studies have shown that suffers from severe  14.4%4 Forest Cover the Lempa river, the country's environmental degradation. By main potable water source, is some estimates, only 59 percent 0.9 tons4  CO2/capita contaminated with dangerously of the population has access to high levels of mercury and other  safe drinking water. That figure is 11.1%1 GDP from agr. heavy metals.6 likely optimistic. ED & TECH educational level among the The education system in El rural population is 3.4 years.7 Salvador is weak; only 1 out of Most wealthy Salvadorans 3 complete the ninth grade, send their children to private only 1 out of 5 complete high schools or to schools school (1998). abroad.There is only one Almost 17% of the population is public university in the illiterate; the average country1 LANDSCAPE % Urban Religions Practiced1 El Salvador remains one of the The effect and threat of violent ‘75 41.5% five most violent countries in the crime have led to increased Protestant 18% 22% world. There is an average of ten isolation and the curtailment of Catholic 5% ‘05 59.8% murders and a number of car- recreational opportunities, Other jackings reported daily to the including popular beach None ‘15 63.2% 55% Police. destinations. Sources: 5. http://www.youtube.com/watch?v=0NR8Lv0p7Uo 1.CIA World Factbook 8 http://www.state.gov/r/pa/ei/bgn/2033.htm 6.http://www.nationsencyclopedia.com/economies/ 2.The Next Four Billion 9.http://www.nationsencyclopedia.com/Americas/El- Americas/El-Salvador-POVERTY-AND-WEALTH.html 3.Earth Trends WRI Salvador-HEALTH.html 7.http://www.usaid.gov/policy/budget/cbj2005/lac/s 4.UNDP Human Development Report v.html
  • 7. UGBA-196 Spring 2009: Country Focus Research Portfolio Population (millions) Gini Coefficient2 (1.8% increase) 1 Mozambique 0.47  $20B1 GDP (at PPP) 1200 1000  Distribution of Income3 $9001 GDP per capita 800 600  41.041 Life Expectancy 400 MOP/TOP 28.9% Katie Borofka 18737639 200  21%1 Unemployment 21.284 BOP 71.1% Elisa Tonfack 19871623 0 POVERTY Extremely high food prices have Size and spending of negatively affected BOP/MOP3 the poorest (and the most) of Mozambique’s population, forcing 69% of the population lives below the many to resort to poverty line. cutting back the The majority live in rural populations.11 quality and quantity of food consumed.13 HEALTH Monday, June 11, 2007 : In Malaria is Water(10) order to improve the health and the primary safety of women, policymakers cause of in Mozambique have mortality Life announced that they will Sanitation(10) consider lifting the country's among Expectancy(1) ban on abortion.12 children. 11 On average, 500 new HIV infections occur every day. Attended Hunger(16) Approximately 1.6 million Mozambicans are Births(17) living with HIV.10 220 Volts @ 50 Hertz7 ENERGY & ENVIRONMENT  18%4 Electrification Currently, “Major projects in the pipeline include a $5 billion oil The country is extremely  24.6%5 Forest Cover refinery in Nacala and a second vulnerable to major hydro-electric project on floods, droughts, and 0.1 tons6  CO2/capita the Zambezi River.”8 cyclones, which has led to  the displacement of 23.4%1 GDP from agr. thousands of people. 11 Zambezi River Radio Mocambique: state- ED & TECH Primary Literacy(1) run, operates national school AntenaNacional network and children provincial and local channels in Education Mobile painted Portuguese, English and many Spending(1) Phones(1) their indigenous languages.14 New cashew processing dreams for technology, introduced in better 2002 by a local education entrepreneur and funded Girls in Internet(1) last July.10 by USAID.15 School(10) 2 LANDSCAPE % Urban Politics… Catholic Religions Practiced1 Mozambique gained Prime Minister Luisa Diogo insists that perceptions of Muslim independence in 1975 ‘75 4.32% Africa should change “because today's Africa is a new from Portugal, but it Zionist Africa, where business opportunities are flourishing, wasn’t until 1990 that Christian ‘05 32% where investments are being made in education, other it instituted a health and infrastructures, and where there is democratic ‘15 70% permanent accountability before the African Union.”9 none government.1 1. CIA World Factbook 7. Treehousehttp://treehouse.ofb.net/go/en/voltage/Mozambique 12. Mozambique Considers Lifting Abortion Ban to Protect Women's Lives 2. Nation Master http://www.nationmaster.com 8. Farming to bolster Mozambique GDP in 2009 http://www.indybay.org/newsitems/2007/06/11/18426821.php 3. The Next Four Billion http://www.guardian.co.uk/business/feedarticle/8336442 13. UN Mozambique http://unmozambique.org 4. Electricity sector reform in Mozambique 9. Mozambique: Diogo criticizes poor perceptions of Africa 14. BBC News http://news.bbc.co.uk http://www.sciencedirect.com http://allafrica.com/stories/200902020058.html 15. USAID http://usaid.gov 5. 10. UNICEF http://www.unicef.org/mozambique 16. World Food Programme Mongabayhttp://rainforests.mongabay.com/20mozambi 11. WHO http://www.wfp.org/country_brief/indexcountry.asp?country=508 que.htm http://www.who.int/hac/crises/moz/background/Mozambique_Sept05.pdf 17. Population Reference Bureau http://www.prb.org/Countries/Mozambique.aspx
  • 8. Gini Coefficient Population (millions) UGBA-196 Spring 2009: Country Focus Research Portfolio (0.6% increase)9 .47 China  $7.8T1 GDP (at PPP) 1.3B 1300 1200 $6,1003  % of Population at GDP per capita 1000 Less than BOP 800  $3000 72/757 Central Life Expectancy 600 More than Alean Daniel 400  4.2%1 $3000 Unemployment Michelle Wu 200 0 POVERTY Spending of BOP/MOP Resource prices have been consistently rising, imposing pressure on farmers and people. Gas on average increased 11%. Jiangxi and 5 Henan’s farming resources increased around 65%. 6 HEALTH Water Pressing diseases: Life China ranks first for Sanitation 1. Food and waterborne 2. 3. 30 million out of Expectancy percentage of adult disease such as 340 million under population that bacterial diarrhea, 17 suffer from Attended smokes with 67% hepatitis A and typhoid mental and or Nutrition of adults smoking.9 fever1 births behavioral 1. H5N1 problems. 10 2. Bird Flu 220 – 240 Volts ENERGY & ENVIRONMENT  99%2 Electrification In 2006, central China’s industrial work growth was China is predicted to be the  21.2%2 Forest Cover 21.41%, $9169.55 world’s largest emitter of billion, leading all parts of greenhouse gases by 2010 China. Electronic resources affecting climate change. 3.8 tons2  are becoming The authorities show no CO2/capita scarce, putting a constraint concern for mitigating this on its economic growth. 6 pollution. 11  10.6%1 GDP from agr. ED & TECH 1/6 of the population student 300m internet users aged. 20m students alone are according to CNNIC. China in higher education. There is monitors internet usage and stiff competition for entrance silences critics of the into universities, a national government. Google provides exam is required.10 a separate censored search engine. LANDSCAPE % Urban Situated between resource-rich western regions and booming ‘75 17.4% eastern regions, it is poised to become a manufacturing base for both finished goods and raw materials. It is also being developed ‘05 40.4% to be a transportation hub and major grain producer. ‘15 49.2% Sources: Sources: Sources: 5. 中部地区各省宏观税负差异的实证分析[1].pdf 9. http://www.nationmaster.com 1.CIA World Factbook 6. 当前中部地区经济发展的问题与建议[1].pdf 10.http://www.medicalnewstoday.com/articles/1482 2.UNDP Human Development Report 7. World Health Organization (WHO) 6.php 3.CIA World Factbook 8. http://www.wpro.who.int/countries/2008/chn/ 11. BBC World Poverty 2008 4.http://hdrstats.undp.org/indicators/40.html
  • 9. UGBA-196 Spring 2009: Country Focus Research Portfolio  Distribution of Income GDP (at PPP) $34.23B Uganda % of Population at BOP  Gini GDP per capita $1,100 Coefficient Less than $3000 0.46 minu  49.71 Life Expectancy More than $3000 Brittany Deyan, David Dinh  Unemployment 3.2% Poverty Size and spending of Income: BOP/MOP Around 37.7% of Ugandans live below the poverty line and the country, being land locked, depends on the outside world. Dependency: 31.8% of Uganda’s imports are from Kenya, Uganda’s largest import partner Water Health AIDS Access: 4.1% HIV/AIDS prevalence rate Sanitation: 42% Life Expectancy Sanitation 1.7% of the population has Drugs: 50% AIDS Physicians: .8/1000 78,000 deaths from HIV in 2003 Abortion:Illegal under the following conditions: 1. If women is raped or incest 2. Economic or social Hunger Attended births reasons Children & Education  9%4 Electrification School Orphans:  18.4%4 Forest Cover Primary level enrollment: 56% Nearly half of the 2 million orphans are due Secondary level enrollment:  to AIDS. .1 tons4 CO2/capita 12% Tertiary level enrollment: 3% Night Commuters:  29%1 GDP from agr. Around 40,000 unaccompanied children “night commute” Youth Literacy: 76.6% each night to escape the LRA. Literacy Landscape and Environment Physical Landscape: The Nile River starts at the base of Uganda and flows Education Spending Mobile Phones north to the mediterranean sea. Political Environment: Uganda’s current President, Yoweri Museveni, came into power in 1986. The country has been in a civil war for the last 22 years between the Lord’s Resistance Army and the Ugandan government.The war has been named the worst humanitarian crisis in the Girls in School Internet world today. Uganda Today % Urban 1 Religions Practiced Displacement: 1.8 million Internally Displaced ‘75 7% Persons (IDPs) Roman Catholic Water & Sanitation: access to as little as 4.6 Protestant ‘05 12.6% liters of water per day. Toilet facilities are also over Muslim capacity or non-existent other ‘15 14.5% Aid & Development: When peace comes, the challenge for development begins. Sources: Sources: Sources: 1.CIA World Factbook 5. UNDP Human Development Report 8. BBC World Poverty 2008 2.The Next Four Billion 6. Vanguard- vanguard.invisiblechildren.com 9. Resolve Uganda 3.Earth Trends WRI 7. Invisible Children- invisiblechildren.com 10. Unicef 4.UNDP Human Development Report
  • 10. UGBA-196 Spring 2009: Country Focus Research Portfolio Population (millions) Gini Coefficient1 (1.6% increase)4 Bangladesh $228.4B1  0.33 GDP (at PPP) 1200 1000 $1,5001  GDP per capita 800 600  63.11 Life Expectancy 400  200 Nicole Ferris 2.5%1 Unemployment 3.7 0 POVERTY Size and spending of BOP/MOP 45% live below the poverty line2 30% live on less than US$1 per day2 •½ of GDP is generated through the service sector yet 2/3 of population is employed in agriculture. •Rice is the single-most-important product.1 98.2% kids-under- 5 vaccinated HEALTH for polio in ’07to keep country Morbidity Rates7: polio free.7 1.Diarrhea 15.9% 95% pop. received Vitamin A 2.Intestinal Worm 7.38% Supplements7 3.Skin Diseases 9.3% Tobacco control in textbooks in 4.Anemia 9.92% 20107 220V ENERGY & ENVIRONMENT Banned plastic  32%4 Electrification bags2 80% of country’s electricity is produced using gas8  6.7%4 Forest Cover Shortage of over 250 mil. cubic feet of gas per day8 Only 500,000 internet users in ’071 0.3 tons4  CO2/capita $100 million loan from World Bank8 for solar plant and  19.1%1 GDP from agr. other renewable energy. (June 2009) PEOPLE & CULTURE LANDSCAPE % Urban4 Obstacles to growth12: Natural Hazards10: mismanaged ports, labor 1975 9.9% Droughts, Cyclones & Floods. force > # of jobs, inefficient use of energy, political 2005 25.1% Limited access to potable water. corruption & weak Water pollution from pesticides.10 2015 29.9% governance. Sources: Sources: Sources: 1.CIA World Factbook 5. http://www.wssinfo.org/en/watquery.html 9. http://hdrstats.undp.org/indicators/40.html 2.http://www.lonelyplanet.com/bangladesh 6. MDG Indicators 10. http://www.discoverybangladesh.com 3.Earth Trends WRI 7.Country Health System Profile-WHO 11. Bangla 2000 4.UNDP Human Development Report 8. Planet Ark http://planetark.org/wen/51261 12. World Bank