SlideShare una empresa de Scribd logo
1 de 7
Descargar para leer sin conexión
1
Fig. 1.2.2 Energy-
producing nuclear
reactions occur only
within the inner 25
percent of the Sun’s
radius. The energy
produced by these
reactions is carried
outward by photons to 70
percent of the Sun’s
radius. From that distance
outward, convection
carries most of the Sun’s
energy.
1.2 Stars
A star (like our sun) is a is a massive, dense ball of gases with a surface heated to incandescence by energy released
from fusion reactions deep within. Our sun is just an ordinary star with an average brightness. Since the Sun is an
average star, it can be used as a reference for understanding all the other stars.
1.2.1 Origin of Stars
Stars are born from nebulae (swirling clouds of hydrogen gas in the deep space between other stars).
These clouds consist of random, swirling atoms of gases that have little gravitational attraction for one another because
they have little mass. Complex motions of stars, however, can produce a shock wave that causes particles to move
closer together and collide, making local compressions. Their mutual gravitational attraction then begins to pull
them together into a cluster. The cluster grows as more atoms are pulled into it, which increases the mass and thus the
gravitational attraction, and still more atoms are pulled in from farther away. Theoretical calculations indicate that on
the order of 1 × 10 57
atoms are necessary, all within a distance of 3 trillion km. When these conditions occur, the cloud
of gas atoms begins to condense by gravitational attraction to a protostar, an accumulation of gases that will become a
star.
SAMPLE PROBLEM
Compared to the 1019
molecules/cm3
of air on Earth, an average concentration of 1000. hydrogen atoms/cm3
in the
Orion Nebula does not seem very dense. However, considering that the Orion Nebula is about 20 light-years (20 × 1018
cm) across, a sphere with a volume of 4.19 × 1057
cm3
would enclose the Orion Nebula, and it would contain
1000 𝑎𝑡𝑜𝑚𝑠
𝑐𝑚3
𝑥 (4.19 𝑥 1057
𝑐𝑚3) = 4.19 𝑥 1060
𝑎𝑡𝑜𝑚𝑠
This is a sufficient number of hydrogen atoms to produce
4.19 𝑥 1060
1 𝑥 1057
= 4190 𝑠𝑡𝑎𝑟𝑠
Thus, there is a sufficient number of hydrogen atoms in the Orion Nebula to produce 4,190 average stars like the
Sun.
Gravitational attraction pulls the average protostar from a cloud with a diameter of trillions of kilometers down to a
dense sphere with a diameter of 2.5 million km or so. As gravitational attraction accelerates the atoms toward the
center, they gain kinetic energy, and the interior temperature increases. Over a period of some 10 million years of
contracting and heating, the temperature and density conditions at the center of the protostar are sufficient to start
nuclear fusion reactions. Pressure from hot gases and energy from increasing fusion reactions begin to balance the
gravitational attraction over the next 17 million years, and the newborn, average star begins its stable life, which will
continue for the next 10 billion years.
1.2.2 Star’s Interior and Life Span
The interior of an average star, such as the Sun, is modeled after the theoretical pressure, temperature, and density
conditions that would be necessary to produce the observed energy and light from the surface. This model describes the
interior as a set of three shells: (1) the core, (2) a radiation zone, and (3) the convection zone.
2
 Core - a dense, very hot region where nuclear fusion reactions release gamma and X-ray radiation. The density
of the core is about 12 times that of solid lead. Because of the plasma conditions, however, the core
remains in a gaseous state even at this density.
 Radiation zone - less dense than the core, having a density about the same as that of water. Energy in the form
of gamma and X rays from the core is absorbed and reemitted by collisions with atoms in this zone. The
radiation slowly diffuses outward because of the countless collisions over a distance comparable to the distance
between Earth and the Moon. It could take millions of years before this radiation finally escapes the radiation
zone.
 Convection zone - begins about seven-tenths of the way to the surface, where the density of the gases is
about 1 percent of the density of water. Gases at the bottom of this zone are heated by radiation from the
radiation zone below, expand from the heating, and rise to the surface by convection. At the surface, the gases
emit energy in the form of visible light, ultraviolet radiation, and infrared radiation, which moves out into space.
As they lose energy, the gases contract in volume and sink back to the radiation zone to become heated again,
continuously carrying energy from the radiation zone to the surface in convection cells. The surface is
continuously heated by the convection cells as it gives off energy to space, maintaining a temperature of about
5,800 K (about 5,500°C).
As an average star, the Sun converts about 1.4 × 10¹⁷
kg of matter to energy every year as hydrogen nuclei are fused to
produce helium. The Sun was born about 5 billion years ago and has sufficient hydrogen in the core to continue shining
for another 4 or 5 billion years. Other stars, however, have masses that are much greater or much less than the mass of
the Sun, so they have different life spans. More massive stars generate higher temperatures in the core because they
have a greater gravitational contraction from their greater masses. Higher temperatures mean increased kinetic
energy, which results in increased numbers of collisions between hydrogen nuclei with the end result being an increased
number of fusion reactions. Thus, a more massive star uses up its hydrogen more rapidly than a less massive star. On
the other hand, stars that are less massive than the Sun use their hydrogen at a slower rate, so they have longer life
spans. The life spans of the stars range from a few million years for large, massive stars, to 10 billion years for average
stars like the Sun, to trillions of years for small, less massive stars.
1.2.3 Brightness of a Star
Stars generate their own light, but some stars appear brighter than others in the night sky. A classification scheme for
different levels of brightness that you see is called the apparent magnitude scale. The brightness of a star as it appears
to you in the night sky is a combination of these factors:
1. the amount of light produced by the stars,
2. the size of each star,
3. the distance to a particular star, and
4. the atmospheric condition.
The apparent magnitude scale is based on a system established by a Greek astronomer over two thousand years ago.
Hipparchus made a catalog of the stars he could see and assigned a numerical value to each to identify its relative
brightness. The brightness values ranged from 1 to 6, with the number 1 assigned to the brightest star and the
number 6 assigned to the faintest star that could be seen. Stars assigned the number 1 came to be known as first-
magnitude stars, those a little dimmer as second-magnitude stars, and so on to the faintest stars visible, the sixth-
magnitude stars.
When technological developments in the nineteenth century made it possible to measure the brightness of a
star, Hipparchus’s system of brightness values acquired a precise, quantitative meaning. Today, a first-magnitude
star is defined as one that is 100 times brighter than a sixth-magnitude star, with five uniform multiples of decreasing
brightness on a scale from the first magnitude to the sixth magnitude.
To compensate for distance differences, astronomers calculate the brightness that stars would appear to have if they
were all at a defined, standard distance (32.6 light-years) (known as absolute magnitude). The absolute magnitude is an
expression of luminosity, the total amount of energy radiated into space each second from the surface of a star. The
Sun, for example, radiates 4 × 1026
joules per second from its surface. The luminosity of stars is often compared to the
Sun’s luminosity, with the Sun considered to have a luminosity of 1 unit. When this is done, the luminosity of the stars
ranges from a low of 10–6
sun units for the dimmest stars up to a high of 105
sun units. Thus, the Sun is somewhere in
the middle of the range of star luminosity.
3
Fig. 1.2.4 The
distribution of radiant
energy emitted is
different for stars with
different surface
temperatures. Note that
the peak radiation of a
cooler star is more
toward the red part of
the spectrum, and the
peak radiation of a hotter
star is more toward the
blue part of the
spectrum.
SAMPLE PROBLEM
The measured brightness of a star can be determined from its luminosity (L) and its distance (d ) from the observer. This
is so because the energy radiated into space from a star spreads equally in all directions and follows an inverse square
relationship with distance. Ignoring the effects of the atmosphere, what is the brightness (B) of the Sun, in watts per
square meter, as observed from Earth?
SOLUTION
L = 4 x 1026
W
d = 1.5 x 10¹¹
m
B = ?
𝐵 =
𝐿
4𝜋𝑑2
=
4 𝑥 1026
𝑊
4𝜋(1.5 𝑥 1011 𝑚)2
= 1 𝑥 103 𝑤
𝑚2⁄
1.2.4 Star Temperature
If you observe the
stars on a clear night,
you will notice that
some are brighter
than others, but you
will also notice some
color differences.
Some stars have a
reddish color, others
have a bluish-white
color, and still others
have a yellowish
color. This color
difference is understood to be a result of the relationship that exists between the color and the temperature of an
incandescent object. The colors of the various stars are a result of the temperatures of the stars. You see a cooler star as
reddish and comparatively hotter stars as bluish white. Stars with in-between temperatures, such as the Sun, appear to
have a yellowish color.
Astronomers analyze starlight to measure the temperature and luminosity as well as the chemical composition of a star.
When the starlight is analyzed in a spectroscope, specific elements can be identified from the unique set of spectral lines
that each element emits. Temperature and spectra are used as the basis for a star classification scheme. Originally, the
classification scheme was based on 16 categories according to the
strength of the hydrogen line spectra. The groups were identified
alphabetically with A for the group with the strongest hydrogen line
spectrum, B for slightly weaker lines, and on to the last group with
the faintest lines. Later, astronomers realized that the star
temperature was the important variable, so they rearranged the
categories according to decreasing temperatures. The original letter
categories were retained, however, resulting in classes of stars with
the hottest temperature first and the coolest last with the sequence
O B A F G K M.
SAMPLE PROBLEM
The temperature of a star in Kelvins can be determined from the peak wavelength of the light emitted by a
relationship called Wien’s displacement law. The temperature is equal to a constant of 2.897 × 10⁷
K∙angstroms
divided by the peak wavelength in angstroms. What is the temperature of a star emitting light with a peak wavelength of
3,500 angstroms?
=
2.897 𝑥 107
K ∙ angstroms
3500 𝑎𝑛𝑔𝑠𝑡𝑟𝑜𝑚𝑠
= 8300 K
Major Stellar Spectral Types and Temperatures
Type Color Temperature
O Bluish 30,000 - 80,000
B Bluish 10,000 - 30,000
A Bluish 7,500 – 10,000
F White 6,000 – 7,500
G Yellow 5,000 – 6,000
K Orange-red 3,500 – 5,000
M Reddish 2,000 – 3,500
4
1.2.5 Star Types
Henry Russell in the United States and Ejnar
Hertzsprung in Denmark independently developed a
scheme to classify stars with a temperature-
luminosity graph (known as Hertzsprung-Russell
diagram or H-R diagram).
Each dot is a data point representing the surface
temperature and brightness of a particular star. The
Sun, for example, is a type G star with an absolute
magnitude of about +5, which places the data point
for the Sun almost in the center of the diagram. This
means that the Sun is an ordinary, average star with
respect to both surface temperature and true
brightness.
Most of the stars plotted on an H-R diagram fall in or
close to a narrow band that runs from the top left to
the lower right. This band is made up of main
sequence stars. Stars along the main sequence band
are normal, mature stars that are using their nuclear
fuel at a steady rate. Those stars on the upper left of
the main sequence are the brightest, bluest, and
most massive stars on the sequence. Those at the
lower right are the faintest, reddest, and least
massive of the stars on the main sequence. In
general, most of the main sequence stars have
masses that fall between a range from 10 times
greater than the mass of the Sun (upper left) to one-
tenth the mass of the Sun (lower right). The
extremes, or ends, of the main sequence range from
about 60 times more massive than the Sun to one-
twenty-fifth of the Sun’s mass. It is the mass of a main sequence star that determines its brightness, its temperature,
and its location on the H-R diagram. High-mass stars on the main sequence are brighter and hotter and have shorter
lives than low-mass stars. These relation-ships do not apply to the other types of stars in the H-R diagram.
There are two groups of stars that have a different set of properties than the main sequence stars. The red
giant stars are bright, but low-temperature, giants. These reddish stars are enormously bright for their temperature
because they are very large, with an enormous surface area giving off light. A red giant might be 100 times larger but
have the same mass as the Sun. These low-density red giants are located in the upper right part of the H-R diagram. The
white dwarf stars, on the other hand, are located at the lower left because they are faint, white-hot stars. A white dwarf
is faint because it is small, perhaps twice the size of Earth. It is also very dense, with a mass approximately equal to the
Sun’s. During its lifetime, a star will be found in different places on the H-R diagram as it undergoes changes. Red giants
and white dwarfs are believed to be evolutionary stages that aging stars pass through, and the path a star takes across
the diagram is called an evolutionary track. During the lifetime of the Sun, it will be a main sequence star, a red giant,
and then a white dwarf.
Stars such as the Sun emit a steady light because the force of gravitational contraction is balanced by the outward flow
of energy. Variable stars, on the other hand, are stars that change in brightness over a period of time. A Cepheid
variable is a bright variable star that is used to measure distances. There is a general relationship between the period
and the brightness: the longer the time needed for one pulse, the greater the apparent brightness of that star. The
period-brightness relationship to distance was calibrated by comparing the apparent brightness with the absolute
magnitude (true brightness) of a Cepheid at a known distance with a known period. Using the period to predict how
bright the star would appear at various distances allowed astronomers to calculate the distance to a Cepheid given its
apparent brightness.
Fig. 1.2.5 The Hertzsprung-Russell diagram. The main
sequence and giant regions contain most of the stars, whereas
hot underluminous stars, the white dwarfs, lie below and to
the left of the main sequence.
5
Fig. 1.2.6.1 A star becomes stable when the outward
forces of expansion from the energy released in
nuclear fusion reactions balance the inward forces of
gravity.
1.2.6 Life of a Star
A star is born in a gigantic cloud of gas and dust in interstellar space, then spends billions of years calmly shining while it
fuses hydrogen nuclei in the core. How long a star shines and what happens to it when it uses up the hydrogen in the
core depend on the mass of the star.
Protostar Stage
The first stage in the theoretical model of the life cycle of a star
is the formation of the protostar. As gravity pulls the gas of a
protostar together, the density, pressure, and temperature
increase from the surface down to the center. Eventually, the
conditions are right for nuclear fusion reactions to begin in the
core, which requires a temperature of 10 million kelvins. The
initial fusion reaction essentially combines four hydrogen nuclei
to form a helium nucleus with the release of much energy. This
energy heats the core beyond the temperature reached by
gravitational contraction, eventually to 16 million kelvins. Since
the star is a gas, the increased temperature expands the volume
of the star. The outward pressure of expansion balances the
inward pressure from gravitational collapse, and the star settles
down to a balanced condition of calmly converting hydrogen to
helium in the core, radiating the energy released into space.
The theoretical time elapsed from the initial formation and
collapse of the protostar to the main sequence is about 50 million years for a star of a solar mass.
Main Sequence Stage
Where the star is located on the main sequence and what happens to it next depend only on how massive it is. The
more massive stars have higher core temperatures and use up their hydrogen more rapidly as they shine at higher
surface temperatures (O-type stars). Less massive stars shine at lower surface temperatures (M-type stars) as they use
their fuel at a slower rate. The overall life span on the main sequence ranges from millions of years for O-type stars to
trillions of years for M-type stars. An average one-solar-mass star will last about 10 billion years.
Red Giant Stage
The next stage in the theoretical life of a star begins when the hydrogen in the core has been fused into helium. With
fewer hydrogen fusion reactions, less energy is released and less outward balancing pressure is produced, so the star
begins to collapse. The collapse heats the core, which now is composed primarily of helium, and the surrounding shell
where hydrogen still exists. The increased temperature causes the hydrogen in the shell to undergo fusion, and the
increased release of energy causes the outer layers of the star to expand. With an increased surface area, the amount of
radiation emitted per unit area is less, and the star acquires the properties of a brilliant red giant.
Back Toward Main Sequence
After about 500 million years as a red giant, the star now has a surface temperature of about 4,000 kelvins compared to
its main sequence surface temperature of 6,000 kelvins. The radius of the red giant is now 1,000 times greater, a
distance that will engulf Earth when the Sun reaches this stage, assuming Earth is in the same position as today. Even
though the surface temperature has decreased from the expansion, the helium core is continually heating and
eventually reaches a temperature of 100 million kelvins, the critical temperature necessary for the helium nuclei to
undergo fusion to produce carbon. The red giant now has helium fusion reactions in the core and hydrogen fusion
reactions in a shell around the core. This changes the radius, the surface temperature, and the luminosity, with the
overall result depending on the composition of the star. In general, the radius and luminosity decrease when this stage is
reached, moving the star back toward the main sequence.
6
Fig. 1.2.6.2 The blown-off outer layers of stars form
ringlike structures called planetary nebulae.
Beginning of the End for Less Massive Stars
After millions of years of helium fusion reactions, the core is gradually converted to a carbon core, and helium fusion
begins in the shell surrounding the core. The core reactions decrease as the star now has a helium fusing shell
surrounded by a second hydrogen fusing shell. This releases additional energy, and the star again expands to a red giant
for the second time. A star the size of the Sun or less massive may cool enough at this point that nuclei at the surface
become neutral atoms rather than a plasma. As neutral atoms, they can absorb radiant energy coming from within the
star, heating the outer layers. Changes in temperature produce changes in pressure, which change the balance
among the temperature, pressure, and the internal
energy generation rate. The star begins to expand
outward from heating. The expanded gases are cooled by
the expansion process, however, and are pulled back to
the star by gravity, only to be heated and expand outward
again. In other words, the outer layers of the star begin to
pulsate in and out. Finally, a violent expansion blows off the
outer layers of the star, leaving the hot core. Such blown-off
outer layers of a star form circular nebulae called planetary
nebulae. The nebulae continue moving away from the core,
eventually adding to the dust and gases between the stars.
The remaining carbon core and helium-fusing shell begin
gravitationally to contract to a small, dense white dwarf
star. A star with the original mass of the Sun or less slowly
cools from white, to red, then to a black lump of carbon in
space.
Beginning of the End for Massive Stars
A more massive star will have a different theoretical ending than the slow cooling of a white dwarf. A massive star will
contract, just as the less massive stars do, after blowing off its outer shells. In a more massive star, however, heat from
the contraction may reach the critical temperature of 600 million kelvins to begin carbon fusion reactions. Thus, a more
massive star may go through a carbon fusing stage and other fusion reaction stages that will continue to produce new
elements until the element iron is reached. After iron, energy is no longer released by the fusion process, and the star
has used up all of its energy sources. Lacking an energy source, the star is no longer able to maintain its internal
temperature. The star loses the outward pressure of expansion from the high temperature, which had previously
balanced the inward pressure from gravitational attraction. The star thus collapses, then rebounds like a compressed
spring into a catastrophic explosion called a supernova. A supernova produces a brilliant light in the sky that may last for
months before it begins to dim as the new elements that were created during the life of the star diffuse into space.
These include all the elements up to iron that were produced by fusion reactions during the life of the star and heavier
elements that were created during the instant of the explosion. All the elements heavier than iron were created as some
less massive nuclei disintegrated in the explosion, joining with one another and with lighter nuclei to produce the nuclei
of the elements from iron to uranium,. These newly produced, scattered elements will later become the building blocks
for new stars and planets such as the Sun and Earth.
If the core of a supernova has a remaining mass greater than 1.4 solar masses, the gravitational forces on the
remaining matter, together with the compressional forces of the supernova explosion, are great enough to collapse
nuclei, forcing protons and electrons together into neutrons, forming the core of a neutron star. A neutron star is
the very small (10 to 20 km diameter), superdense (1011
kg/cm3 or greater) remains of a supernova with a center core of
pure neutrons.
Because it is a superdense form of matter, the neutron star also has an extremely powerful magnetic field,
capable of becoming a pulsar (Fig. 1.2.6.3). A pulsar is a very strongly magnetized neutron star that emits a uniform
series of equally spaced electromagnetic pulses. Evidently, the magnetic field of a rotating neutron star makes it a
powerful electric generator, capable of accelerating charged particles to very high energies. These accelerated charges
are responsible for emitting a beam of electromagnetic radiation, which sweeps through space with amazing regularity).
The pulsating radio signals from a pulsar were a big mystery when first discovered. For a time, extraterrestrial life was
7
Fig. 1.2.6.3 The magnetic axis of the pulsar is
inclined with respect to the rotation axis. Rapidly
moving electrons in the regions near the magnetic
poles emit radiation in a beam pointed outward.
When the beam sweeps past Earth, a pulse is
detected.
considered as the source of the signals, so they were jokingly identified as LGM (for “little green men”). Over 300 pulsars
have been identified, and most emit radiation in the form of radio waves. Two, however, emit visible light, two emit
beams of gamma radiation, and one emits X-ray pulses.
Another theoretical limit occurs if the remaining core has a mass
of about 3 solar masses or more. At this limit, the force of gravity
overwhelms all nucleon forces, including the repulsive forces
between like charged particles. If this theoretical limit is reached,
nothing can stop the collapse, and the collapsed star will become
so dense that even light cannot escape. The star is now a black
hole in space. Since nothing can stop the collapsing star,
theoretically a black hole would continue to collapse to a
pinpoint and then to a zero radius called a singularity. This event
seems contrary to anything that can be directly observed in the
physical universe, but it does agree with the general theory of
relativity and concepts about the curvature of space produced by
such massively dense objects. Black holes are theoretical and
none has been seen, of course, because a black hole theoretically
pulls in radiation of all wavelengths and emits nothing. Evidence
for the existence of a black hole is sought by studying X rays that
would be given off by matter as it is accelerated into a black
hole.
Evidence of the existence of a black hole has been provided by
photographs from the Hubble Space Telescope. Hubble pictured
a disk of gas only about 60 light-years out from the center of a
galaxy (M87), moving at more than 1.6 million km/h. The only known possible explanation for such a massive disk of gas
moving with this velocity at the distance observed would require the presence of a 1 to 2 billion solar-mass black hole.
This gas disk could only be resolved by the Hubble Space Telescope, so this telescope has provided the first
observational evidence of a black hole.
Fig. 1.2.6.4 This flowchart shows some of the possible stages in the birth and aging of a star. The differences are
determined by the mass of the star

Más contenido relacionado

La actualidad más candente

Astonishing Astronomy 101 - Chapter 16
Astonishing Astronomy 101 - Chapter 16Astonishing Astronomy 101 - Chapter 16
Astonishing Astronomy 101 - Chapter 16Don R. Mueller, Ph.D.
 
Astonishing Astronomy 101 – Chapters 14 and 15
Astonishing Astronomy 101 – Chapters 14 and 15Astonishing Astronomy 101 – Chapters 14 and 15
Astonishing Astronomy 101 – Chapters 14 and 15Don R. Mueller, Ph.D.
 
Intro to astrophysics nis grade 11 by mr marty, visible brightness = apparent...
Intro to astrophysics nis grade 11 by mr marty, visible brightness = apparent...Intro to astrophysics nis grade 11 by mr marty, visible brightness = apparent...
Intro to astrophysics nis grade 11 by mr marty, visible brightness = apparent...Michael Marty
 
IB Astrophysics - intro to the universe - Flippingphysics by nothingnerdy
IB Astrophysics -  intro to the universe - Flippingphysics by nothingnerdyIB Astrophysics -  intro to the universe - Flippingphysics by nothingnerdy
IB Astrophysics - intro to the universe - Flippingphysics by nothingnerdyNothingnerdy
 
Cosmology And Astronomy
Cosmology And AstronomyCosmology And Astronomy
Cosmology And AstronomyMarinela L
 
Astronomy - State of the Art - Life in the Universe
Astronomy - State of the Art - Life in the UniverseAstronomy - State of the Art - Life in the Universe
Astronomy - State of the Art - Life in the UniverseChris Impey
 
Basics Of Astrophysics
Basics Of AstrophysicsBasics Of Astrophysics
Basics Of AstrophysicsHomam Hosseini
 
Jupiter - The gas giant - 2012-11-06
Jupiter - The gas giant - 2012-11-06Jupiter - The gas giant - 2012-11-06
Jupiter - The gas giant - 2012-11-06Aritra Sarkar
 
E1 Introduction to the Universe
E1 Introduction to the UniverseE1 Introduction to the Universe
E1 Introduction to the UniverseDavid Young
 
Astronomy - State of the Art - Telescopes
Astronomy - State of the Art - TelescopesAstronomy - State of the Art - Telescopes
Astronomy - State of the Art - TelescopesChris Impey
 
NEW HOT-to-COOL COSMOLOGY: Amazing Progress Yet Greater Questions
NEW HOT-to-COOL COSMOLOGY: Amazing Progress Yet Greater QuestionsNEW HOT-to-COOL COSMOLOGY: Amazing Progress Yet Greater Questions
NEW HOT-to-COOL COSMOLOGY: Amazing Progress Yet Greater QuestionsPaul H. Carr
 
IB Astrophysics - stellar distances - Flippingphysics by nothingnerdy
IB Astrophysics - stellar distances - Flippingphysics by nothingnerdyIB Astrophysics - stellar distances - Flippingphysics by nothingnerdy
IB Astrophysics - stellar distances - Flippingphysics by nothingnerdyNothingnerdy
 
D5 further cosmology
D5 further cosmologyD5 further cosmology
D5 further cosmologyPaula Mills
 
Size and Scale of the Universe
Size and Scale of the UniverseSize and Scale of the Universe
Size and Scale of the Universesmiller5
 

La actualidad más candente (16)

Astonishing Astronomy 101 - Chapter 16
Astonishing Astronomy 101 - Chapter 16Astonishing Astronomy 101 - Chapter 16
Astonishing Astronomy 101 - Chapter 16
 
Astonishing Astronomy 101 – Chapters 14 and 15
Astonishing Astronomy 101 – Chapters 14 and 15Astonishing Astronomy 101 – Chapters 14 and 15
Astonishing Astronomy 101 – Chapters 14 and 15
 
Intro to astrophysics nis grade 11 by mr marty, visible brightness = apparent...
Intro to astrophysics nis grade 11 by mr marty, visible brightness = apparent...Intro to astrophysics nis grade 11 by mr marty, visible brightness = apparent...
Intro to astrophysics nis grade 11 by mr marty, visible brightness = apparent...
 
IB Astrophysics - intro to the universe - Flippingphysics by nothingnerdy
IB Astrophysics -  intro to the universe - Flippingphysics by nothingnerdyIB Astrophysics -  intro to the universe - Flippingphysics by nothingnerdy
IB Astrophysics - intro to the universe - Flippingphysics by nothingnerdy
 
Cosmology And Astronomy
Cosmology And AstronomyCosmology And Astronomy
Cosmology And Astronomy
 
Astronomy - State of the Art - Life in the Universe
Astronomy - State of the Art - Life in the UniverseAstronomy - State of the Art - Life in the Universe
Astronomy - State of the Art - Life in the Universe
 
Basics Of Astrophysics
Basics Of AstrophysicsBasics Of Astrophysics
Basics Of Astrophysics
 
Jupiter - The gas giant - 2012-11-06
Jupiter - The gas giant - 2012-11-06Jupiter - The gas giant - 2012-11-06
Jupiter - The gas giant - 2012-11-06
 
E1 Introduction to the Universe
E1 Introduction to the UniverseE1 Introduction to the Universe
E1 Introduction to the Universe
 
Solar energy
Solar energySolar energy
Solar energy
 
Astronomy - State of the Art - Telescopes
Astronomy - State of the Art - TelescopesAstronomy - State of the Art - Telescopes
Astronomy - State of the Art - Telescopes
 
NEW HOT-to-COOL COSMOLOGY: Amazing Progress Yet Greater Questions
NEW HOT-to-COOL COSMOLOGY: Amazing Progress Yet Greater QuestionsNEW HOT-to-COOL COSMOLOGY: Amazing Progress Yet Greater Questions
NEW HOT-to-COOL COSMOLOGY: Amazing Progress Yet Greater Questions
 
IB Astrophysics - stellar distances - Flippingphysics by nothingnerdy
IB Astrophysics - stellar distances - Flippingphysics by nothingnerdyIB Astrophysics - stellar distances - Flippingphysics by nothingnerdy
IB Astrophysics - stellar distances - Flippingphysics by nothingnerdy
 
D5 further cosmology
D5 further cosmologyD5 further cosmology
D5 further cosmology
 
Size and Scale of the Universe
Size and Scale of the UniverseSize and Scale of the Universe
Size and Scale of the Universe
 
D3
D3D3
D3
 

Destacado

Solutions, suspensions, and colloids
Solutions, suspensions, and colloidsSolutions, suspensions, and colloids
Solutions, suspensions, and colloidsAhmed_Marai
 
Measuring distances of astronomical objects
Measuring distances of astronomical objectsMeasuring distances of astronomical objects
Measuring distances of astronomical objectsNabila Syuhada
 
Solutions, suspensions, and colloids
Solutions, suspensions, and colloidsSolutions, suspensions, and colloids
Solutions, suspensions, and colloidsStephanie Pruitt
 
Life Cycle of Stars
Life Cycle of StarsLife Cycle of Stars
Life Cycle of StarsJoan Shinkle
 
The life and death of stars
The life and death of starsThe life and death of stars
The life and death of starsMegan Soh
 
Life cycle of stars
Life cycle of starsLife cycle of stars
Life cycle of starsdavideis
 
Death of a star
Death of a starDeath of a star
Death of a starNtlia20
 
Uses of solvents and solutions
Uses of solvents and solutions Uses of solvents and solutions
Uses of solvents and solutions Abdul Ayaz
 
Solution, Solute and Solvent Grade 7
Solution, Solute and Solvent Grade 7Solution, Solute and Solvent Grade 7
Solution, Solute and Solvent Grade 7Sher Lock
 
Solutions and suspensions
Solutions and suspensionsSolutions and suspensions
Solutions and suspensionsJacklyn Kong
 
Ch 19 -life and death of stars
Ch 19 -life and death of starsCh 19 -life and death of stars
Ch 19 -life and death of starscphsastronomy
 

Destacado (20)

Stars
StarsStars
Stars
 
Solutions, suspensions, and colloids
Solutions, suspensions, and colloidsSolutions, suspensions, and colloids
Solutions, suspensions, and colloids
 
Measuring distances of astronomical objects
Measuring distances of astronomical objectsMeasuring distances of astronomical objects
Measuring distances of astronomical objects
 
All about Stars
All about StarsAll about Stars
All about Stars
 
Stars -Stelele
Stars -Stelele Stars -Stelele
Stars -Stelele
 
Solutions, suspensions, and colloids
Solutions, suspensions, and colloidsSolutions, suspensions, and colloids
Solutions, suspensions, and colloids
 
Life Cycle of Stars
Life Cycle of StarsLife Cycle of Stars
Life Cycle of Stars
 
The life and death of stars
The life and death of starsThe life and death of stars
The life and death of stars
 
Stars
StarsStars
Stars
 
Life cycle of stars
Life cycle of starsLife cycle of stars
Life cycle of stars
 
Solutions, suspensions and colloids
Solutions, suspensions and colloidsSolutions, suspensions and colloids
Solutions, suspensions and colloids
 
Wictor hugo & william wordsworth
Wictor hugo & william wordsworthWictor hugo & william wordsworth
Wictor hugo & william wordsworth
 
Death of a star
Death of a starDeath of a star
Death of a star
 
Uses of solvents and solutions
Uses of solvents and solutions Uses of solvents and solutions
Uses of solvents and solutions
 
Solution, Solute and Solvent Grade 7
Solution, Solute and Solvent Grade 7Solution, Solute and Solvent Grade 7
Solution, Solute and Solvent Grade 7
 
Stars - Basic Properties/H- R Diagram
Stars - Basic Properties/H- R DiagramStars - Basic Properties/H- R Diagram
Stars - Basic Properties/H- R Diagram
 
Stars
StarsStars
Stars
 
Edukasyon Sa Pagpapakatao Gr. 1
Edukasyon Sa Pagpapakatao Gr. 1Edukasyon Sa Pagpapakatao Gr. 1
Edukasyon Sa Pagpapakatao Gr. 1
 
Solutions and suspensions
Solutions and suspensionsSolutions and suspensions
Solutions and suspensions
 
Ch 19 -life and death of stars
Ch 19 -life and death of starsCh 19 -life and death of stars
Ch 19 -life and death of stars
 

Similar a Stars1

Chemistry project - Space chemistry
Chemistry project - Space chemistryChemistry project - Space chemistry
Chemistry project - Space chemistryHemant Singh
 
Characteristics of Stars.pptx
Characteristics of Stars.pptxCharacteristics of Stars.pptx
Characteristics of Stars.pptxquartz4
 
Universe Ohpp
Universe OhppUniverse Ohpp
Universe Ohppringoldj
 
The Stars of the Sky and their Life Cycles (2).pptx
The Stars of the Sky and their Life Cycles (2).pptxThe Stars of the Sky and their Life Cycles (2).pptx
The Stars of the Sky and their Life Cycles (2).pptxBricemilet
 
Form 3 PMR Science Chapter 9 Stars and Galaxies
Form 3 PMR Science Chapter 9 Stars and GalaxiesForm 3 PMR Science Chapter 9 Stars and Galaxies
Form 3 PMR Science Chapter 9 Stars and GalaxiesSook Yen Wong
 
Unit8astronomy09 10-101024160150-phpapp02
Unit8astronomy09 10-101024160150-phpapp02Unit8astronomy09 10-101024160150-phpapp02
Unit8astronomy09 10-101024160150-phpapp02Kristin Calhoun
 
Astrophysics by RAVEENDRA BAGADE lecturer in Physics S.G Degree College Koppa...
Astrophysics by RAVEENDRA BAGADE lecturer in Physics S.G Degree College Koppa...Astrophysics by RAVEENDRA BAGADE lecturer in Physics S.G Degree College Koppa...
Astrophysics by RAVEENDRA BAGADE lecturer in Physics S.G Degree College Koppa...Ravindra Bagade
 
Stars print
Stars printStars print
Stars printjoverba
 
Into the Edge of the Stars Humanity’s changing vision of the cosmos Presenter...
Into the Edge of the Stars Humanity’s changing vision of the cosmos Presenter...Into the Edge of the Stars Humanity’s changing vision of the cosmos Presenter...
Into the Edge of the Stars Humanity’s changing vision of the cosmos Presenter...Haileyesus Wondwossen
 
Universe and the Solar System (Lesson 1).pptx
Universe and the Solar System (Lesson 1).pptxUniverse and the Solar System (Lesson 1).pptx
Universe and the Solar System (Lesson 1).pptxJoenelRubino3
 

Similar a Stars1 (20)

Chemistry project - Space chemistry
Chemistry project - Space chemistryChemistry project - Space chemistry
Chemistry project - Space chemistry
 
sun properties.ppt
sun properties.pptsun properties.ppt
sun properties.ppt
 
Characteristics of Stars.pptx
Characteristics of Stars.pptxCharacteristics of Stars.pptx
Characteristics of Stars.pptx
 
Universe Ohpp
Universe OhppUniverse Ohpp
Universe Ohpp
 
The Stars of the Sky and their Life Cycles (2).pptx
The Stars of the Sky and their Life Cycles (2).pptxThe Stars of the Sky and their Life Cycles (2).pptx
The Stars of the Sky and their Life Cycles (2).pptx
 
Form 3 PMR Science Chapter 9 Stars and Galaxies
Form 3 PMR Science Chapter 9 Stars and GalaxiesForm 3 PMR Science Chapter 9 Stars and Galaxies
Form 3 PMR Science Chapter 9 Stars and Galaxies
 
Unit8astronomy09 10-101024160150-phpapp02
Unit8astronomy09 10-101024160150-phpapp02Unit8astronomy09 10-101024160150-phpapp02
Unit8astronomy09 10-101024160150-phpapp02
 
6.Sun.ppt
6.Sun.ppt6.Sun.ppt
6.Sun.ppt
 
Astrophysics by RAVEENDRA BAGADE lecturer in Physics S.G Degree College Koppa...
Astrophysics by RAVEENDRA BAGADE lecturer in Physics S.G Degree College Koppa...Astrophysics by RAVEENDRA BAGADE lecturer in Physics S.G Degree College Koppa...
Astrophysics by RAVEENDRA BAGADE lecturer in Physics S.G Degree College Koppa...
 
Glossary
GlossaryGlossary
Glossary
 
6.sun
6.sun6.sun
6.sun
 
The_Sun.ppt
The_Sun.pptThe_Sun.ppt
The_Sun.ppt
 
Stars print
Stars printStars print
Stars print
 
stars.pptx
stars.pptxstars.pptx
stars.pptx
 
Into the Edge of the Stars Humanity’s changing vision of the cosmos Presenter...
Into the Edge of the Stars Humanity’s changing vision of the cosmos Presenter...Into the Edge of the Stars Humanity’s changing vision of the cosmos Presenter...
Into the Edge of the Stars Humanity’s changing vision of the cosmos Presenter...
 
05 Stellar Evolution Mc Neely
05 Stellar Evolution Mc Neely05 Stellar Evolution Mc Neely
05 Stellar Evolution Mc Neely
 
YOUKO
YOUKOYOUKO
YOUKO
 
Magnetic sun
Magnetic sunMagnetic sun
Magnetic sun
 
Universe and the Solar System (Lesson 1).pptx
Universe and the Solar System (Lesson 1).pptxUniverse and the Solar System (Lesson 1).pptx
Universe and the Solar System (Lesson 1).pptx
 
11.1 stars
11.1 stars11.1 stars
11.1 stars
 

Más de Roxanne Tiffany Dotillos (16)

The passionate shepherd to his love
The passionate shepherd to his loveThe passionate shepherd to his love
The passionate shepherd to his love
 
Parts of a Plant
Parts of a PlantParts of a Plant
Parts of a Plant
 
Lesson plan in Gr. III
Lesson plan in Gr. IIILesson plan in Gr. III
Lesson plan in Gr. III
 
Human Body
Human BodyHuman Body
Human Body
 
Parts of a Flower
Parts of a FlowerParts of a Flower
Parts of a Flower
 
Developmental Reading
Developmental ReadingDevelopmental Reading
Developmental Reading
 
Verbs
Verbs Verbs
Verbs
 
Subject Verb Agreement
Subject Verb AgreementSubject Verb Agreement
Subject Verb Agreement
 
Assessing learning outcomes objectives
Assessing learning outcomes objectivesAssessing learning outcomes objectives
Assessing learning outcomes objectives
 
Fcdrc application form (1)
Fcdrc application form (1)Fcdrc application form (1)
Fcdrc application form (1)
 
Social philosophy
Social philosophySocial philosophy
Social philosophy
 
Assesment of learning types of test
Assesment of learning types of testAssesment of learning types of test
Assesment of learning types of test
 
Principles of teaching 2
Principles of teaching 2Principles of teaching 2
Principles of teaching 2
 
Assessment of learning 1
Assessment of learning 1Assessment of learning 1
Assessment of learning 1
 
The beginnings of astronomy
The beginnings of astronomyThe beginnings of astronomy
The beginnings of astronomy
 
Star charts
Star chartsStar charts
Star charts
 

Último

Developer Data Modeling Mistakes: From Postgres to NoSQL
Developer Data Modeling Mistakes: From Postgres to NoSQLDeveloper Data Modeling Mistakes: From Postgres to NoSQL
Developer Data Modeling Mistakes: From Postgres to NoSQLScyllaDB
 
Vertex AI Gemini Prompt Engineering Tips
Vertex AI Gemini Prompt Engineering TipsVertex AI Gemini Prompt Engineering Tips
Vertex AI Gemini Prompt Engineering TipsMiki Katsuragi
 
"Debugging python applications inside k8s environment", Andrii Soldatenko
"Debugging python applications inside k8s environment", Andrii Soldatenko"Debugging python applications inside k8s environment", Andrii Soldatenko
"Debugging python applications inside k8s environment", Andrii SoldatenkoFwdays
 
What's New in Teams Calling, Meetings and Devices March 2024
What's New in Teams Calling, Meetings and Devices March 2024What's New in Teams Calling, Meetings and Devices March 2024
What's New in Teams Calling, Meetings and Devices March 2024Stephanie Beckett
 
Tampa BSides - Chef's Tour of Microsoft Security Adoption Framework (SAF)
Tampa BSides - Chef's Tour of Microsoft Security Adoption Framework (SAF)Tampa BSides - Chef's Tour of Microsoft Security Adoption Framework (SAF)
Tampa BSides - Chef's Tour of Microsoft Security Adoption Framework (SAF)Mark Simos
 
From Family Reminiscence to Scholarly Archive .
From Family Reminiscence to Scholarly Archive .From Family Reminiscence to Scholarly Archive .
From Family Reminiscence to Scholarly Archive .Alan Dix
 
Streamlining Python Development: A Guide to a Modern Project Setup
Streamlining Python Development: A Guide to a Modern Project SetupStreamlining Python Development: A Guide to a Modern Project Setup
Streamlining Python Development: A Guide to a Modern Project SetupFlorian Wilhelm
 
Search Engine Optimization SEO PDF for 2024.pdf
Search Engine Optimization SEO PDF for 2024.pdfSearch Engine Optimization SEO PDF for 2024.pdf
Search Engine Optimization SEO PDF for 2024.pdfRankYa
 
WordPress Websites for Engineers: Elevate Your Brand
WordPress Websites for Engineers: Elevate Your BrandWordPress Websites for Engineers: Elevate Your Brand
WordPress Websites for Engineers: Elevate Your Brandgvaughan
 
Advanced Test Driven-Development @ php[tek] 2024
Advanced Test Driven-Development @ php[tek] 2024Advanced Test Driven-Development @ php[tek] 2024
Advanced Test Driven-Development @ php[tek] 2024Scott Keck-Warren
 
Hyperautomation and AI/ML: A Strategy for Digital Transformation Success.pdf
Hyperautomation and AI/ML: A Strategy for Digital Transformation Success.pdfHyperautomation and AI/ML: A Strategy for Digital Transformation Success.pdf
Hyperautomation and AI/ML: A Strategy for Digital Transformation Success.pdfPrecisely
 
DevEX - reference for building teams, processes, and platforms
DevEX - reference for building teams, processes, and platformsDevEX - reference for building teams, processes, and platforms
DevEX - reference for building teams, processes, and platformsSergiu Bodiu
 
Powerpoint exploring the locations used in television show Time Clash
Powerpoint exploring the locations used in television show Time ClashPowerpoint exploring the locations used in television show Time Clash
Powerpoint exploring the locations used in television show Time Clashcharlottematthew16
 
Dev Dives: Streamline document processing with UiPath Studio Web
Dev Dives: Streamline document processing with UiPath Studio WebDev Dives: Streamline document processing with UiPath Studio Web
Dev Dives: Streamline document processing with UiPath Studio WebUiPathCommunity
 
The Ultimate Guide to Choosing WordPress Pros and Cons
The Ultimate Guide to Choosing WordPress Pros and ConsThe Ultimate Guide to Choosing WordPress Pros and Cons
The Ultimate Guide to Choosing WordPress Pros and ConsPixlogix Infotech
 
Merck Moving Beyond Passwords: FIDO Paris Seminar.pptx
Merck Moving Beyond Passwords: FIDO Paris Seminar.pptxMerck Moving Beyond Passwords: FIDO Paris Seminar.pptx
Merck Moving Beyond Passwords: FIDO Paris Seminar.pptxLoriGlavin3
 
Gen AI in Business - Global Trends Report 2024.pdf
Gen AI in Business - Global Trends Report 2024.pdfGen AI in Business - Global Trends Report 2024.pdf
Gen AI in Business - Global Trends Report 2024.pdfAddepto
 
Advanced Computer Architecture – An Introduction
Advanced Computer Architecture – An IntroductionAdvanced Computer Architecture – An Introduction
Advanced Computer Architecture – An IntroductionDilum Bandara
 
Scanning the Internet for External Cloud Exposures via SSL Certs
Scanning the Internet for External Cloud Exposures via SSL CertsScanning the Internet for External Cloud Exposures via SSL Certs
Scanning the Internet for External Cloud Exposures via SSL CertsRizwan Syed
 
"Subclassing and Composition – A Pythonic Tour of Trade-Offs", Hynek Schlawack
"Subclassing and Composition – A Pythonic Tour of Trade-Offs", Hynek Schlawack"Subclassing and Composition – A Pythonic Tour of Trade-Offs", Hynek Schlawack
"Subclassing and Composition – A Pythonic Tour of Trade-Offs", Hynek SchlawackFwdays
 

Último (20)

Developer Data Modeling Mistakes: From Postgres to NoSQL
Developer Data Modeling Mistakes: From Postgres to NoSQLDeveloper Data Modeling Mistakes: From Postgres to NoSQL
Developer Data Modeling Mistakes: From Postgres to NoSQL
 
Vertex AI Gemini Prompt Engineering Tips
Vertex AI Gemini Prompt Engineering TipsVertex AI Gemini Prompt Engineering Tips
Vertex AI Gemini Prompt Engineering Tips
 
"Debugging python applications inside k8s environment", Andrii Soldatenko
"Debugging python applications inside k8s environment", Andrii Soldatenko"Debugging python applications inside k8s environment", Andrii Soldatenko
"Debugging python applications inside k8s environment", Andrii Soldatenko
 
What's New in Teams Calling, Meetings and Devices March 2024
What's New in Teams Calling, Meetings and Devices March 2024What's New in Teams Calling, Meetings and Devices March 2024
What's New in Teams Calling, Meetings and Devices March 2024
 
Tampa BSides - Chef's Tour of Microsoft Security Adoption Framework (SAF)
Tampa BSides - Chef's Tour of Microsoft Security Adoption Framework (SAF)Tampa BSides - Chef's Tour of Microsoft Security Adoption Framework (SAF)
Tampa BSides - Chef's Tour of Microsoft Security Adoption Framework (SAF)
 
From Family Reminiscence to Scholarly Archive .
From Family Reminiscence to Scholarly Archive .From Family Reminiscence to Scholarly Archive .
From Family Reminiscence to Scholarly Archive .
 
Streamlining Python Development: A Guide to a Modern Project Setup
Streamlining Python Development: A Guide to a Modern Project SetupStreamlining Python Development: A Guide to a Modern Project Setup
Streamlining Python Development: A Guide to a Modern Project Setup
 
Search Engine Optimization SEO PDF for 2024.pdf
Search Engine Optimization SEO PDF for 2024.pdfSearch Engine Optimization SEO PDF for 2024.pdf
Search Engine Optimization SEO PDF for 2024.pdf
 
WordPress Websites for Engineers: Elevate Your Brand
WordPress Websites for Engineers: Elevate Your BrandWordPress Websites for Engineers: Elevate Your Brand
WordPress Websites for Engineers: Elevate Your Brand
 
Advanced Test Driven-Development @ php[tek] 2024
Advanced Test Driven-Development @ php[tek] 2024Advanced Test Driven-Development @ php[tek] 2024
Advanced Test Driven-Development @ php[tek] 2024
 
Hyperautomation and AI/ML: A Strategy for Digital Transformation Success.pdf
Hyperautomation and AI/ML: A Strategy for Digital Transformation Success.pdfHyperautomation and AI/ML: A Strategy for Digital Transformation Success.pdf
Hyperautomation and AI/ML: A Strategy for Digital Transformation Success.pdf
 
DevEX - reference for building teams, processes, and platforms
DevEX - reference for building teams, processes, and platformsDevEX - reference for building teams, processes, and platforms
DevEX - reference for building teams, processes, and platforms
 
Powerpoint exploring the locations used in television show Time Clash
Powerpoint exploring the locations used in television show Time ClashPowerpoint exploring the locations used in television show Time Clash
Powerpoint exploring the locations used in television show Time Clash
 
Dev Dives: Streamline document processing with UiPath Studio Web
Dev Dives: Streamline document processing with UiPath Studio WebDev Dives: Streamline document processing with UiPath Studio Web
Dev Dives: Streamline document processing with UiPath Studio Web
 
The Ultimate Guide to Choosing WordPress Pros and Cons
The Ultimate Guide to Choosing WordPress Pros and ConsThe Ultimate Guide to Choosing WordPress Pros and Cons
The Ultimate Guide to Choosing WordPress Pros and Cons
 
Merck Moving Beyond Passwords: FIDO Paris Seminar.pptx
Merck Moving Beyond Passwords: FIDO Paris Seminar.pptxMerck Moving Beyond Passwords: FIDO Paris Seminar.pptx
Merck Moving Beyond Passwords: FIDO Paris Seminar.pptx
 
Gen AI in Business - Global Trends Report 2024.pdf
Gen AI in Business - Global Trends Report 2024.pdfGen AI in Business - Global Trends Report 2024.pdf
Gen AI in Business - Global Trends Report 2024.pdf
 
Advanced Computer Architecture – An Introduction
Advanced Computer Architecture – An IntroductionAdvanced Computer Architecture – An Introduction
Advanced Computer Architecture – An Introduction
 
Scanning the Internet for External Cloud Exposures via SSL Certs
Scanning the Internet for External Cloud Exposures via SSL CertsScanning the Internet for External Cloud Exposures via SSL Certs
Scanning the Internet for External Cloud Exposures via SSL Certs
 
"Subclassing and Composition – A Pythonic Tour of Trade-Offs", Hynek Schlawack
"Subclassing and Composition – A Pythonic Tour of Trade-Offs", Hynek Schlawack"Subclassing and Composition – A Pythonic Tour of Trade-Offs", Hynek Schlawack
"Subclassing and Composition – A Pythonic Tour of Trade-Offs", Hynek Schlawack
 

Stars1

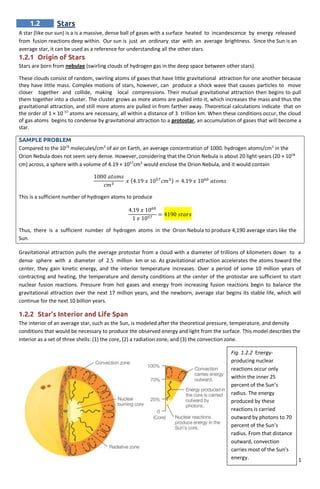
  • 1. 1 Fig. 1.2.2 Energy- producing nuclear reactions occur only within the inner 25 percent of the Sun’s radius. The energy produced by these reactions is carried outward by photons to 70 percent of the Sun’s radius. From that distance outward, convection carries most of the Sun’s energy. 1.2 Stars A star (like our sun) is a is a massive, dense ball of gases with a surface heated to incandescence by energy released from fusion reactions deep within. Our sun is just an ordinary star with an average brightness. Since the Sun is an average star, it can be used as a reference for understanding all the other stars. 1.2.1 Origin of Stars Stars are born from nebulae (swirling clouds of hydrogen gas in the deep space between other stars). These clouds consist of random, swirling atoms of gases that have little gravitational attraction for one another because they have little mass. Complex motions of stars, however, can produce a shock wave that causes particles to move closer together and collide, making local compressions. Their mutual gravitational attraction then begins to pull them together into a cluster. The cluster grows as more atoms are pulled into it, which increases the mass and thus the gravitational attraction, and still more atoms are pulled in from farther away. Theoretical calculations indicate that on the order of 1 × 10 57 atoms are necessary, all within a distance of 3 trillion km. When these conditions occur, the cloud of gas atoms begins to condense by gravitational attraction to a protostar, an accumulation of gases that will become a star. SAMPLE PROBLEM Compared to the 1019 molecules/cm3 of air on Earth, an average concentration of 1000. hydrogen atoms/cm3 in the Orion Nebula does not seem very dense. However, considering that the Orion Nebula is about 20 light-years (20 × 1018 cm) across, a sphere with a volume of 4.19 × 1057 cm3 would enclose the Orion Nebula, and it would contain 1000 𝑎𝑡𝑜𝑚𝑠 𝑐𝑚3 𝑥 (4.19 𝑥 1057 𝑐𝑚3) = 4.19 𝑥 1060 𝑎𝑡𝑜𝑚𝑠 This is a sufficient number of hydrogen atoms to produce 4.19 𝑥 1060 1 𝑥 1057 = 4190 𝑠𝑡𝑎𝑟𝑠 Thus, there is a sufficient number of hydrogen atoms in the Orion Nebula to produce 4,190 average stars like the Sun. Gravitational attraction pulls the average protostar from a cloud with a diameter of trillions of kilometers down to a dense sphere with a diameter of 2.5 million km or so. As gravitational attraction accelerates the atoms toward the center, they gain kinetic energy, and the interior temperature increases. Over a period of some 10 million years of contracting and heating, the temperature and density conditions at the center of the protostar are sufficient to start nuclear fusion reactions. Pressure from hot gases and energy from increasing fusion reactions begin to balance the gravitational attraction over the next 17 million years, and the newborn, average star begins its stable life, which will continue for the next 10 billion years. 1.2.2 Star’s Interior and Life Span The interior of an average star, such as the Sun, is modeled after the theoretical pressure, temperature, and density conditions that would be necessary to produce the observed energy and light from the surface. This model describes the interior as a set of three shells: (1) the core, (2) a radiation zone, and (3) the convection zone.
  • 2. 2  Core - a dense, very hot region where nuclear fusion reactions release gamma and X-ray radiation. The density of the core is about 12 times that of solid lead. Because of the plasma conditions, however, the core remains in a gaseous state even at this density.  Radiation zone - less dense than the core, having a density about the same as that of water. Energy in the form of gamma and X rays from the core is absorbed and reemitted by collisions with atoms in this zone. The radiation slowly diffuses outward because of the countless collisions over a distance comparable to the distance between Earth and the Moon. It could take millions of years before this radiation finally escapes the radiation zone.  Convection zone - begins about seven-tenths of the way to the surface, where the density of the gases is about 1 percent of the density of water. Gases at the bottom of this zone are heated by radiation from the radiation zone below, expand from the heating, and rise to the surface by convection. At the surface, the gases emit energy in the form of visible light, ultraviolet radiation, and infrared radiation, which moves out into space. As they lose energy, the gases contract in volume and sink back to the radiation zone to become heated again, continuously carrying energy from the radiation zone to the surface in convection cells. The surface is continuously heated by the convection cells as it gives off energy to space, maintaining a temperature of about 5,800 K (about 5,500°C). As an average star, the Sun converts about 1.4 × 10¹⁷ kg of matter to energy every year as hydrogen nuclei are fused to produce helium. The Sun was born about 5 billion years ago and has sufficient hydrogen in the core to continue shining for another 4 or 5 billion years. Other stars, however, have masses that are much greater or much less than the mass of the Sun, so they have different life spans. More massive stars generate higher temperatures in the core because they have a greater gravitational contraction from their greater masses. Higher temperatures mean increased kinetic energy, which results in increased numbers of collisions between hydrogen nuclei with the end result being an increased number of fusion reactions. Thus, a more massive star uses up its hydrogen more rapidly than a less massive star. On the other hand, stars that are less massive than the Sun use their hydrogen at a slower rate, so they have longer life spans. The life spans of the stars range from a few million years for large, massive stars, to 10 billion years for average stars like the Sun, to trillions of years for small, less massive stars. 1.2.3 Brightness of a Star Stars generate their own light, but some stars appear brighter than others in the night sky. A classification scheme for different levels of brightness that you see is called the apparent magnitude scale. The brightness of a star as it appears to you in the night sky is a combination of these factors: 1. the amount of light produced by the stars, 2. the size of each star, 3. the distance to a particular star, and 4. the atmospheric condition. The apparent magnitude scale is based on a system established by a Greek astronomer over two thousand years ago. Hipparchus made a catalog of the stars he could see and assigned a numerical value to each to identify its relative brightness. The brightness values ranged from 1 to 6, with the number 1 assigned to the brightest star and the number 6 assigned to the faintest star that could be seen. Stars assigned the number 1 came to be known as first- magnitude stars, those a little dimmer as second-magnitude stars, and so on to the faintest stars visible, the sixth- magnitude stars. When technological developments in the nineteenth century made it possible to measure the brightness of a star, Hipparchus’s system of brightness values acquired a precise, quantitative meaning. Today, a first-magnitude star is defined as one that is 100 times brighter than a sixth-magnitude star, with five uniform multiples of decreasing brightness on a scale from the first magnitude to the sixth magnitude. To compensate for distance differences, astronomers calculate the brightness that stars would appear to have if they were all at a defined, standard distance (32.6 light-years) (known as absolute magnitude). The absolute magnitude is an expression of luminosity, the total amount of energy radiated into space each second from the surface of a star. The Sun, for example, radiates 4 × 1026 joules per second from its surface. The luminosity of stars is often compared to the Sun’s luminosity, with the Sun considered to have a luminosity of 1 unit. When this is done, the luminosity of the stars ranges from a low of 10–6 sun units for the dimmest stars up to a high of 105 sun units. Thus, the Sun is somewhere in the middle of the range of star luminosity.
  • 3. 3 Fig. 1.2.4 The distribution of radiant energy emitted is different for stars with different surface temperatures. Note that the peak radiation of a cooler star is more toward the red part of the spectrum, and the peak radiation of a hotter star is more toward the blue part of the spectrum. SAMPLE PROBLEM The measured brightness of a star can be determined from its luminosity (L) and its distance (d ) from the observer. This is so because the energy radiated into space from a star spreads equally in all directions and follows an inverse square relationship with distance. Ignoring the effects of the atmosphere, what is the brightness (B) of the Sun, in watts per square meter, as observed from Earth? SOLUTION L = 4 x 1026 W d = 1.5 x 10¹¹ m B = ? 𝐵 = 𝐿 4𝜋𝑑2 = 4 𝑥 1026 𝑊 4𝜋(1.5 𝑥 1011 𝑚)2 = 1 𝑥 103 𝑤 𝑚2⁄ 1.2.4 Star Temperature If you observe the stars on a clear night, you will notice that some are brighter than others, but you will also notice some color differences. Some stars have a reddish color, others have a bluish-white color, and still others have a yellowish color. This color difference is understood to be a result of the relationship that exists between the color and the temperature of an incandescent object. The colors of the various stars are a result of the temperatures of the stars. You see a cooler star as reddish and comparatively hotter stars as bluish white. Stars with in-between temperatures, such as the Sun, appear to have a yellowish color. Astronomers analyze starlight to measure the temperature and luminosity as well as the chemical composition of a star. When the starlight is analyzed in a spectroscope, specific elements can be identified from the unique set of spectral lines that each element emits. Temperature and spectra are used as the basis for a star classification scheme. Originally, the classification scheme was based on 16 categories according to the strength of the hydrogen line spectra. The groups were identified alphabetically with A for the group with the strongest hydrogen line spectrum, B for slightly weaker lines, and on to the last group with the faintest lines. Later, astronomers realized that the star temperature was the important variable, so they rearranged the categories according to decreasing temperatures. The original letter categories were retained, however, resulting in classes of stars with the hottest temperature first and the coolest last with the sequence O B A F G K M. SAMPLE PROBLEM The temperature of a star in Kelvins can be determined from the peak wavelength of the light emitted by a relationship called Wien’s displacement law. The temperature is equal to a constant of 2.897 × 10⁷ K∙angstroms divided by the peak wavelength in angstroms. What is the temperature of a star emitting light with a peak wavelength of 3,500 angstroms? = 2.897 𝑥 107 K ∙ angstroms 3500 𝑎𝑛𝑔𝑠𝑡𝑟𝑜𝑚𝑠 = 8300 K Major Stellar Spectral Types and Temperatures Type Color Temperature O Bluish 30,000 - 80,000 B Bluish 10,000 - 30,000 A Bluish 7,500 – 10,000 F White 6,000 – 7,500 G Yellow 5,000 – 6,000 K Orange-red 3,500 – 5,000 M Reddish 2,000 – 3,500
  • 4. 4 1.2.5 Star Types Henry Russell in the United States and Ejnar Hertzsprung in Denmark independently developed a scheme to classify stars with a temperature- luminosity graph (known as Hertzsprung-Russell diagram or H-R diagram). Each dot is a data point representing the surface temperature and brightness of a particular star. The Sun, for example, is a type G star with an absolute magnitude of about +5, which places the data point for the Sun almost in the center of the diagram. This means that the Sun is an ordinary, average star with respect to both surface temperature and true brightness. Most of the stars plotted on an H-R diagram fall in or close to a narrow band that runs from the top left to the lower right. This band is made up of main sequence stars. Stars along the main sequence band are normal, mature stars that are using their nuclear fuel at a steady rate. Those stars on the upper left of the main sequence are the brightest, bluest, and most massive stars on the sequence. Those at the lower right are the faintest, reddest, and least massive of the stars on the main sequence. In general, most of the main sequence stars have masses that fall between a range from 10 times greater than the mass of the Sun (upper left) to one- tenth the mass of the Sun (lower right). The extremes, or ends, of the main sequence range from about 60 times more massive than the Sun to one- twenty-fifth of the Sun’s mass. It is the mass of a main sequence star that determines its brightness, its temperature, and its location on the H-R diagram. High-mass stars on the main sequence are brighter and hotter and have shorter lives than low-mass stars. These relation-ships do not apply to the other types of stars in the H-R diagram. There are two groups of stars that have a different set of properties than the main sequence stars. The red giant stars are bright, but low-temperature, giants. These reddish stars are enormously bright for their temperature because they are very large, with an enormous surface area giving off light. A red giant might be 100 times larger but have the same mass as the Sun. These low-density red giants are located in the upper right part of the H-R diagram. The white dwarf stars, on the other hand, are located at the lower left because they are faint, white-hot stars. A white dwarf is faint because it is small, perhaps twice the size of Earth. It is also very dense, with a mass approximately equal to the Sun’s. During its lifetime, a star will be found in different places on the H-R diagram as it undergoes changes. Red giants and white dwarfs are believed to be evolutionary stages that aging stars pass through, and the path a star takes across the diagram is called an evolutionary track. During the lifetime of the Sun, it will be a main sequence star, a red giant, and then a white dwarf. Stars such as the Sun emit a steady light because the force of gravitational contraction is balanced by the outward flow of energy. Variable stars, on the other hand, are stars that change in brightness over a period of time. A Cepheid variable is a bright variable star that is used to measure distances. There is a general relationship between the period and the brightness: the longer the time needed for one pulse, the greater the apparent brightness of that star. The period-brightness relationship to distance was calibrated by comparing the apparent brightness with the absolute magnitude (true brightness) of a Cepheid at a known distance with a known period. Using the period to predict how bright the star would appear at various distances allowed astronomers to calculate the distance to a Cepheid given its apparent brightness. Fig. 1.2.5 The Hertzsprung-Russell diagram. The main sequence and giant regions contain most of the stars, whereas hot underluminous stars, the white dwarfs, lie below and to the left of the main sequence.
  • 5. 5 Fig. 1.2.6.1 A star becomes stable when the outward forces of expansion from the energy released in nuclear fusion reactions balance the inward forces of gravity. 1.2.6 Life of a Star A star is born in a gigantic cloud of gas and dust in interstellar space, then spends billions of years calmly shining while it fuses hydrogen nuclei in the core. How long a star shines and what happens to it when it uses up the hydrogen in the core depend on the mass of the star. Protostar Stage The first stage in the theoretical model of the life cycle of a star is the formation of the protostar. As gravity pulls the gas of a protostar together, the density, pressure, and temperature increase from the surface down to the center. Eventually, the conditions are right for nuclear fusion reactions to begin in the core, which requires a temperature of 10 million kelvins. The initial fusion reaction essentially combines four hydrogen nuclei to form a helium nucleus with the release of much energy. This energy heats the core beyond the temperature reached by gravitational contraction, eventually to 16 million kelvins. Since the star is a gas, the increased temperature expands the volume of the star. The outward pressure of expansion balances the inward pressure from gravitational collapse, and the star settles down to a balanced condition of calmly converting hydrogen to helium in the core, radiating the energy released into space. The theoretical time elapsed from the initial formation and collapse of the protostar to the main sequence is about 50 million years for a star of a solar mass. Main Sequence Stage Where the star is located on the main sequence and what happens to it next depend only on how massive it is. The more massive stars have higher core temperatures and use up their hydrogen more rapidly as they shine at higher surface temperatures (O-type stars). Less massive stars shine at lower surface temperatures (M-type stars) as they use their fuel at a slower rate. The overall life span on the main sequence ranges from millions of years for O-type stars to trillions of years for M-type stars. An average one-solar-mass star will last about 10 billion years. Red Giant Stage The next stage in the theoretical life of a star begins when the hydrogen in the core has been fused into helium. With fewer hydrogen fusion reactions, less energy is released and less outward balancing pressure is produced, so the star begins to collapse. The collapse heats the core, which now is composed primarily of helium, and the surrounding shell where hydrogen still exists. The increased temperature causes the hydrogen in the shell to undergo fusion, and the increased release of energy causes the outer layers of the star to expand. With an increased surface area, the amount of radiation emitted per unit area is less, and the star acquires the properties of a brilliant red giant. Back Toward Main Sequence After about 500 million years as a red giant, the star now has a surface temperature of about 4,000 kelvins compared to its main sequence surface temperature of 6,000 kelvins. The radius of the red giant is now 1,000 times greater, a distance that will engulf Earth when the Sun reaches this stage, assuming Earth is in the same position as today. Even though the surface temperature has decreased from the expansion, the helium core is continually heating and eventually reaches a temperature of 100 million kelvins, the critical temperature necessary for the helium nuclei to undergo fusion to produce carbon. The red giant now has helium fusion reactions in the core and hydrogen fusion reactions in a shell around the core. This changes the radius, the surface temperature, and the luminosity, with the overall result depending on the composition of the star. In general, the radius and luminosity decrease when this stage is reached, moving the star back toward the main sequence.
  • 6. 6 Fig. 1.2.6.2 The blown-off outer layers of stars form ringlike structures called planetary nebulae. Beginning of the End for Less Massive Stars After millions of years of helium fusion reactions, the core is gradually converted to a carbon core, and helium fusion begins in the shell surrounding the core. The core reactions decrease as the star now has a helium fusing shell surrounded by a second hydrogen fusing shell. This releases additional energy, and the star again expands to a red giant for the second time. A star the size of the Sun or less massive may cool enough at this point that nuclei at the surface become neutral atoms rather than a plasma. As neutral atoms, they can absorb radiant energy coming from within the star, heating the outer layers. Changes in temperature produce changes in pressure, which change the balance among the temperature, pressure, and the internal energy generation rate. The star begins to expand outward from heating. The expanded gases are cooled by the expansion process, however, and are pulled back to the star by gravity, only to be heated and expand outward again. In other words, the outer layers of the star begin to pulsate in and out. Finally, a violent expansion blows off the outer layers of the star, leaving the hot core. Such blown-off outer layers of a star form circular nebulae called planetary nebulae. The nebulae continue moving away from the core, eventually adding to the dust and gases between the stars. The remaining carbon core and helium-fusing shell begin gravitationally to contract to a small, dense white dwarf star. A star with the original mass of the Sun or less slowly cools from white, to red, then to a black lump of carbon in space. Beginning of the End for Massive Stars A more massive star will have a different theoretical ending than the slow cooling of a white dwarf. A massive star will contract, just as the less massive stars do, after blowing off its outer shells. In a more massive star, however, heat from the contraction may reach the critical temperature of 600 million kelvins to begin carbon fusion reactions. Thus, a more massive star may go through a carbon fusing stage and other fusion reaction stages that will continue to produce new elements until the element iron is reached. After iron, energy is no longer released by the fusion process, and the star has used up all of its energy sources. Lacking an energy source, the star is no longer able to maintain its internal temperature. The star loses the outward pressure of expansion from the high temperature, which had previously balanced the inward pressure from gravitational attraction. The star thus collapses, then rebounds like a compressed spring into a catastrophic explosion called a supernova. A supernova produces a brilliant light in the sky that may last for months before it begins to dim as the new elements that were created during the life of the star diffuse into space. These include all the elements up to iron that were produced by fusion reactions during the life of the star and heavier elements that were created during the instant of the explosion. All the elements heavier than iron were created as some less massive nuclei disintegrated in the explosion, joining with one another and with lighter nuclei to produce the nuclei of the elements from iron to uranium,. These newly produced, scattered elements will later become the building blocks for new stars and planets such as the Sun and Earth. If the core of a supernova has a remaining mass greater than 1.4 solar masses, the gravitational forces on the remaining matter, together with the compressional forces of the supernova explosion, are great enough to collapse nuclei, forcing protons and electrons together into neutrons, forming the core of a neutron star. A neutron star is the very small (10 to 20 km diameter), superdense (1011 kg/cm3 or greater) remains of a supernova with a center core of pure neutrons. Because it is a superdense form of matter, the neutron star also has an extremely powerful magnetic field, capable of becoming a pulsar (Fig. 1.2.6.3). A pulsar is a very strongly magnetized neutron star that emits a uniform series of equally spaced electromagnetic pulses. Evidently, the magnetic field of a rotating neutron star makes it a powerful electric generator, capable of accelerating charged particles to very high energies. These accelerated charges are responsible for emitting a beam of electromagnetic radiation, which sweeps through space with amazing regularity). The pulsating radio signals from a pulsar were a big mystery when first discovered. For a time, extraterrestrial life was
  • 7. 7 Fig. 1.2.6.3 The magnetic axis of the pulsar is inclined with respect to the rotation axis. Rapidly moving electrons in the regions near the magnetic poles emit radiation in a beam pointed outward. When the beam sweeps past Earth, a pulse is detected. considered as the source of the signals, so they were jokingly identified as LGM (for “little green men”). Over 300 pulsars have been identified, and most emit radiation in the form of radio waves. Two, however, emit visible light, two emit beams of gamma radiation, and one emits X-ray pulses. Another theoretical limit occurs if the remaining core has a mass of about 3 solar masses or more. At this limit, the force of gravity overwhelms all nucleon forces, including the repulsive forces between like charged particles. If this theoretical limit is reached, nothing can stop the collapse, and the collapsed star will become so dense that even light cannot escape. The star is now a black hole in space. Since nothing can stop the collapsing star, theoretically a black hole would continue to collapse to a pinpoint and then to a zero radius called a singularity. This event seems contrary to anything that can be directly observed in the physical universe, but it does agree with the general theory of relativity and concepts about the curvature of space produced by such massively dense objects. Black holes are theoretical and none has been seen, of course, because a black hole theoretically pulls in radiation of all wavelengths and emits nothing. Evidence for the existence of a black hole is sought by studying X rays that would be given off by matter as it is accelerated into a black hole. Evidence of the existence of a black hole has been provided by photographs from the Hubble Space Telescope. Hubble pictured a disk of gas only about 60 light-years out from the center of a galaxy (M87), moving at more than 1.6 million km/h. The only known possible explanation for such a massive disk of gas moving with this velocity at the distance observed would require the presence of a 1 to 2 billion solar-mass black hole. This gas disk could only be resolved by the Hubble Space Telescope, so this telescope has provided the first observational evidence of a black hole. Fig. 1.2.6.4 This flowchart shows some of the possible stages in the birth and aging of a star. The differences are determined by the mass of the star