

Recomendados
Recomendados
Más contenido relacionado
La actualidad más candente
La actualidad más candente (17)
Destacado
Similar a Oilwatch Monthly - April 2010
Similar a Oilwatch Monthly - April 2010 (20)
Más de Bob Lowery
Más de Bob Lowery (20)
Último
Último (20)
Oilwatch Monthly - April 2010
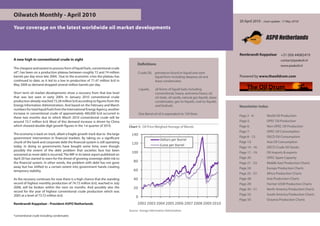
- 1. Oilwatch Monthly - April 2010 20 April 2010 - (next update: 17 May 2010) Your coverage on the latest worldwide oil market developments ASPO Netherlands Rembrandt Koppelaar +31 (0)6 44082419 A new high in conventional crude in sight contact@peakoil.nl Definitions www.peakoil.nl The cheapest and easiest to process form of liquid fuels, conventional crude oil*, has been on a production plateau between roughly 72 and 74 million Crude Oil, petroleum found in liquid and semi barrels per day since late 2004. Due to the economic crisis the plateau has liquid form including deepsea oil and Powered by www.theoildrum.com continued to date, as it led to a low in production of 71.47 million b/d in lease condensates. May 2009 as demand dropped several million barrels per day. Liquids, all forms of liquid fuels including Short term oil market developments show a recovery from that low level conventional, heavy, and extra heavy oil, that was last seen in early 2004. In January 2010 conventional crude oil shale, oil sands, natural gas liquids, lease production already reached 73.28 million b/d according to figures from the condensates, gas-to-liquids, coal-to-liquids, Energy Information Administration. And based on the February and March and biofuels. Newsletter Index numbers for total liquid fuels from the International Energy Agency, another increase in conventional crude of approximately 400,000 b/d occurred in One Barrel of oil is equivalent to 159 litres Page 2 - 4: World Oil Production these two months due to which March 2010 conventional crude will be around 73.7 million b/d. Most of this demand increase is driven by China Page 5: OPEC Oil Production which showed double digit growth figures in the 1st quarter of 2010. Chart 1: Oil Price Weighed Average of Blends Page 6: Non-OPEC Oil Production Page 7: OPEC Oil Consumption The economy is back on track, albeit a fragile growth track due to the large 140 government intervention in financial markets. By taking on a significant Page 8 - 12: OECD Oil Consumption Dollars per Barrel chunk of the bank and corporate debt the financial system is still operating 120 Page 13: Asia Oil Consumption today. In doing so governments have bought some time, even though Euros per Barrel Page 14 - 16: OECD Crude Oil Stocks possibly the extent of the debt problem that societies face has been 100 Page 17 - 19: Oil Imports & exports worsened as more debt is incurred. The IMF in its latest report published on April 20 has started to warn for the threat of growing sovereign debt risk to Page 20: OPEC Spare Capacity the financial system. In other words, the problem with debt has not gone 80 Page 21 - 23: Middle East Production Charts away but has shifted to a certain extent into government hands creating Page 24: Europe Production Charts temporary stability. 60 Page 25 - 27: Africa Production Charts As the recovery continues for now there is a high chance that the standing 40 Page 28: Asia Production Charts record of highest monthly production of 74.73 million b/d, reached in July Page 29: Former USSR Production Charts 2008, will be broken within the next six months. And possibly also the 20 Page 30 - 31: North America Production Charts record for the year of highest conventional crude production which was 2005 at a level of 73.72 million b/d. Page 32: South America Production Charts 0 Page 33: Oceania Production Charts Rembrandt Koppelaar - President ASPO Netherlands 2002 2003 2004 2005 2006 2007 2008 2009 2010 Source: Energy Information Admistration *conventional crude including condensates
- 2. ASPO Netherlands World Oil Production World liquid fuels production World biofuels production World oil production capacity In March 2010 world production of all liquid fuels declined by Total world biofuels production in March 2010 is estimated at Total oil production capacity in March 2010 decreased by 200,000 220,000 barrels per day from February according to the latest 1.89 million b/d based on statistics compiled from the Energy b/d from February 2010, from 90.36 to 90.16 million b/d. World fgures of the International Energy Agency (IEA). Resulting in Information Administration, and the International Energy Agency. production capacity is measured here as the sum of world liquids total world liquid fuels production of 86.59 million b/d. Liquids With an estimated 825,000 b/d from the United States, 630,000 production excluding biofuels plus total OPEC spare capacity production for February 2010 was revised upwards in the IEA Oil b/d from Brazil and 440,000 b/d from other countries. excluding Iraq, Venezuela and Nigeria. Market Report of April from 86.59 to 86.8 million b/d. Average global liquid fuels production in 2009 was 84.94 versus 86.6 and 85.32 million b/d in 2008 and 2007. Chart 2: Liquids Production January 2004 - March 2010 Chart 3: World Biofuels Production Jan. 2004 - March 2010 Chart 4: World Production Capacity Jan. 2003 - March 2010 90 2.5 92 90 88 88 2.0 86 Million barrels per day 86 84 1.5 82 84 80 1.0 78 82 76 0.5 80 Liquids (IEA) 74 Liquids (EIA) Biofuels (IEA) World Liquids Prod. excl. Biofuels (IEA) 72 World Production Capacity (IEA) 78 0.0 70 2004 2005 2006 2007 2008 2009 2010 2004 2005 2006 2007 2008 2009 2010 2003 2004 2005 2006 2007 2008 2009 2010 Source: International Energy Agency Source: IEA, EIA, Source: Energy Information Administration Page 2
- 3. World Oil Production ASPO Netherlands EIA liquids versus IEA liquids excluding biofuels production World crude oil production World natural gas liquids production Liquid fuels production figures published by the Energy Latest figures from the Energy Information Administration (EIA) Natural Gas Liquids production from natural gas fields increased Information Administration in their International Petroleum show that crude oil production including lease condensates by 100,000 b/d from December 2009 to January 2010 according Monthly excludes biofuels produced in countries beside the increased by 190,000 b/d from December 2009 to January to the latest International Petroleum Monthly of the Energy United States and Brazil. The remaining difference is caused 2010. Resulting in total production of crude oil including lease Information Administration (EIA). Resulting in total NGL production by discrepancies between natural gas liquids and Canadian condensates of 73.24 million b/d. of 8.33 million b/d. unconventional oil production. Chart 5: EIA & EIA Liquids Comparison Jan. 2004 - March 2010 Chart 6: Crude Oil Production January 2004 - January 2010 Chart 7: Nat. Gas Liquids Production Jan. 2004 - January 2010 88 75 8.5 87 74 86 8.0 85 Million barrels per day 73 84 7.5 83 72 82 7.0 71 81 80 Liquids excluding biofuels (IEA) 6.5 70 Crude Oil (EIA) Natural Gas Liquids (EIA) Liquids (EIA) 79 78 69 6.0 2004 2005 2006 2007 2008 2009 2010 2004 2005 2006 2007 2008 2009 2010 2004 2005 2006 2007 2008 2009 2010 Source: Energy Information Administration Source: Energy Information Administration Source: Energy Information Administration Page 3
- 4. ASPO Netherlands World Oil Production World conventional crude versus liquids production ratio World unconventional liquid fuels production World energy content from liquid fuels production Approximately 85% of world liquid fuels production in 2008 came In 2008 the biggest part of unconventional liquid fuels production In production statistics all liquid fuels are aggregated as total from conventional crude oil including lease condensates. The came from Natural Gas Liquids at 11% or 7.94 million b/d. ‘oil’ production while containing different amounts of energy remaining share of 15% was produced by unconventional sources Secondly, extra heavy crude and bitumen at 3.4% or 2.68 million per barrel produced. For example, a barrel of crude oil contains including Biofuels, Extra Heavy Oil, Tar Sands, Polar Oil and Natural b/d of which 1.27 million b/d from Canadian oil sands and 1.41 around 5.8 million British Thermal Units while a similar barrel of Gas Liquids. In absolute amounts unconventional production has million b/d from other sources. Thirdly, Biofuels at 1.8% or 1.45 natural gas liquids contains 4.2 million BTU. Conversion to BTU’s increased steadily, from 4 million b/d at the end of the 1970s, to million b/d. A and finally Polar Oil at a production rate of 840,000 shows that actual available energy worldwide in January 2010 approximately 12.9 mb/d in 2008, excluding lease condensates. b/d in 2008 or 1.1% of total liquids supply. was 3.3% lower than liquids statistics counted in barrels would suggest. Chart 8: World Crude and Liquids production 1938 - 2008 Chart 9: Unconventional Oil Production 1938 - 2008 Chart 10: World Production in BTU January 2003 - March 2010 100 14 550 Liquids Biofuels Biofuels 90 X-Heavy crude (excl. Canada) Conventional crude 525 Natural Gas Liquids 12 Canadian Oil Sands 80 Polar Oil Crude Oil Natural Gas Liquids 500 70 10 Million barrels per day Trillion BTU per day 475 60 8 50 450 6 40 425 30 4 400 20 2 375 10 0 0 350 1938 1948 1958 1968 1978 1988 1998 2008 1938 1948 1958 1968 1978 1988 1998 2008 2003 2004 2005 2006 2007 2008 2009 2010 Source: International Energy Agency & Energy Information Administration Source: EIA, EIA & CAPP Source: International Energy Agency Page 4
- 5. OPEC Oil Production ASPO Netherlands OPEC liquid fuels production & production capacity OPEC crude oil production OPEC natural gas liquids production Total liquid fuels production in OPEC countries decreased by Total crude oil production excluding lease condensates of the OPEC natural gas liquids remained stable from February to March 160,000 b/d from February to March 2010 to a level of 34.13 million OPEC cartel decreased by 160,000 b/d to a level of 29.0 million 2010 at a level of 5.13 million b/d. Average OPEC natural gas b/d. Liquids production for February 2010 was revised downwards b/d, from February to March 2010, according to the latest available liquids production in 2009 was 4.67 million b/d, versus 4.47 and in the IEA Oil Market Report of April from 34.36 to 34.29 million estimate of the IEA. Average crude oil production in 2009 was 4.55 million b/d in respectively 2008 and 2007. b/d. Average liquid fuels production in 2009 was 33.7 million b/d, 28.7 million b/d, versus 31.43 and 30.37 million b/d in respectively versus 36.09 and 35.02 million b/d in respectively 2008 and 2007. 2008 and 2007. All time high production of OPEC liquid fuels stands at 36.4 million b/d reached in July 2008. Chart 11: OPEC Liquids Production Jan. 2004 - March 2010 Chart 12: OPEC Crude Oil Production Jan. 2004 - March 2010 Chart 13: OPEC NGL Production January 2004 - March 2010 38 33 5.5 37 32 5.0 36 31 Million barrels per day 35 4.5 30 34 29 4.0 33 28 32 3.5 27 31 Liquids (IEA) Crude Oil (IEA) 3.0 Natural Gas Liquids (IEA) 30 Liquids (EIA) 26 Crude Oil (EIA) Natural Gas Liquids (EIA) 29 25 2.5 2004 2005 2006 2007 2008 2009 2010 2004 2005 2006 2007 2008 2009 2010 2004 2005 2006 2007 2008 2009 2010 Source: International Energy Agency & Energy Information Administration Source: Energy Information Administration Source: Energy Information Administration Page 5
- 6. ASPO Netherlands Non-OPEC Oil Production Non-OPEC liquid fuels production Non-OPEC crude oil production Non-OPEC natural gas liquids production Total liquid fuels production excluding biofuels in Non-OPEC Total Non-OPEC crude oil production including lease condensates Non-OPEC natural gas liquids production increased by 178,000 countries decreased by 50,000 b/d from February to March 2010. increased by 90,000 b/d to a level of 42.27 million b/d, from b/d from December 2009 to January 2010 to a level of 3.55 Resulting in a production level of 50.55 million b/d according to December 2009 to January 2010, according to the latest available million b/d. Average Non-OPEC natural gas liquids production the International Energy Agency. Liquids production for February estimate of the EIA. Crude oil production for December 2009 was in 2009 was 3.34 million b/d, versus 3.65 and 3.79 million b/d in 2010 was revised upwards in the IEA Oil Market Report of April revised upwards in the EIA International Petroleum Monthly of respectively 2008 and 2007. from 50.43 to 50.6 million b/d. Average liquid fuels production in April from 41.18 to 42.19 million b/d. Average crude oil production 2009 was 49.67 million b/d, versus 49.32 and 49.34 million b/d in in 2009 was 41.62 million b/d, versus 41.32 and 41.80 million b/d respectively 2008 and 2007. in respectively 2008 and 2007. Chart 14: Non-OPEC Liquids Production Jan. 2004 - March 2010 Chart 15: Non-OPEC Crude Oil Production Jan. 2004 - Jan. 2010 Chart 16: Non-OPEC NGL Production January 2004 - Jan. 2010 51 43.0 4.5 42.5 50 4.0 42.0 49 Million barrels per day 41.5 3.5 48 41.0 47 3.0 40.5 46 40.0 Liquids (IEA) 2.5 45 Crude oil (EIA) Natural Gas Liquids (EIA) Liquids (EIA) 39.5 44 39.0 2.0 2004 2005 2006 2007 2008 2009 2010 2004 2005 2006 2007 2008 2009 2010 2004 2005 2006 2007 2008 2009 2010 Source: International Energy Agency & Energy Information Administration Source: Energy Information Administration Source: Energy Information Administration Page 6
- 7. OPEC Oil Consumption ASPO Netherlands OPEC oil consumption Iran oil consumption Saudi Arabia oil consumption Oil consumption in all OPEC oil producers combined increased Oil consumption in Iran decreased by 4,000 b/d from January to Oil consumption in Saudi Arabia decreased by 35,000 b/d from by 249,000 b/d from January to February 2010. Resulting in February 2010 to a level of 1.51 million b/d. Average Iranian oil January to February 2010 to a level of 1.61 million b/d. Average a consumption level of 5.96 million b/d. Average OPEC oil consumption in 2009 was 1.52 million b/d, versus 1.64 and 1.52 Saudi Arabian oil consumption in 2009 was 1.82 million b/d, versus consumption in 2009 was 5.94 million b/d, versus 5.76 and 5.30 million b/d in respectively 2008 and 2007. 1.65 and 1.52 million b/d in respectively 2008 and 2007. million b/d in respectively 2008 and 2007. Chart 17: OPEC Oil Consumption January 2004 - February 2010 Chart 18: Iran Oil Consumption January 2004 - February 2010 Chart 19: Saudi Arabia Oil Consumption Jan. 2004 - Feb. 2010 7 2.4 2.6 2.2 2.4 6 2.0 2.2 Million barrels per day 5 2.0 1.8 1.8 4 1.6 1.6 1.4 3 1.4 1.2 2 1.2 1.0 1.0 1 0.8 0.8 0.6 0 0.6 2004 2005 2006 2007 2008 2009 2010 0.4 0.4 Iran oil consumption (JODI) Saudi Arabia oil consumption (JODI) Iraq Venezuela UAE Saudi Arabia 0.2 0.2 Qatar Nigeria Libya Kuwait Iran Ecuador 0.0 0.0 Angola Algeria 12m rolling average 2004 2005 2006 2007 2008 2009 2010 2004 2005 2006 2007 2008 2009 2010 Source: Joint Oil Data Initiative Source: Joint Oil Data Initiative Source: Joint Oil Data Initiative Page 7
- 8. ASPO Netherlands OECD Oil Consumption OECD oil consumption North America oil consumption European Union oil consumption Oil consumption in OECD countries increased by 1.92 million b/d Oil consumption in North America increased by 686,000 b/d from Oil consumption in the European Union increased by 987,000 from January to February 2010. Resulting in a consumption level January to February 2010. Resulting in a consumption level of b/d from January to February 2010. Resulting in a consumption of 45.02 million b/d. Average OECD oil consumption in 2009 was 22.99 million b/d. Average oil consumption in North America in level of 14.42 million b/d according to JODI statistics. Average 43.92 million b/d, versus 46.10 and 47.68 million b/d in respectively 2009 was 22.51 million b/d, versus 23.50 and 24.72 million b/d in consumption in the European Union in 2009 was 13.6 million b/d, 2008 and 2007. respectively 2008 and 2007. versus 14.25 and 14.32 million b/d in respectively 2008 and 2007. Chart 20: OECD Oil Consumption January 2004 - February 2010 Chart 21: North America Oil Consumption Jan. 2004 - Feb. 2010 Chart 22: EU-27 Oil Consumption January 2004 - Feb. 2010 52.0 26.6 15.6 51.0 26.0 15.2 50.0 25.4 49.0 14.8 48.0 24.8 14.4 Million barrels per day 47.0 24.2 14.0 46.0 23.6 45.0 13.6 23.0 44.0 13.2 43.0 22.4 42.0 12.8 21.8 41.0 12.4 21.2 40.0 OECD oil consumption (JODI) North America oil consumption (JODI) EU-27 oil consumption (JODI) 20.6 12.0 39.0 38.0 20.0 11.6 2004 2005 2006 2007 2008 2009 2010 2004 2005 2006 2007 2008 2009 2010 2004 2005 2006 2007 2008 2009 2010 Source: Joint Oil Data Initiative Source: Joint Oil Data Initiative Source: Joint Oil Data Initiative Page 8
- 9. OECD Oil Consumption ASPO Netherlands United States oil consumption Mexico oil consumption Canada oil consumption Oil consumption in the US increasde by 827,000 b/d from January Oil consumption in Mexico increased by 108,000 b/d from January Oil consumption in Canada decreased by 248,000 b/d from to February 2010. Resulting in a consumption level of 19.36 million to February 2010. Resulting in a consumption level of 1.87 million January to February 2010. Resulting in a consumption level of b/d. Average consumption of oil in the US in 2009 was 18.68 b/d. Average oil consumption in Mexico in 2009 was 1.87 million 1.76 million b/d. Average consumption in Canada in 2009 was million b/d, versus 19.50 and 20.70 million b/d in respectively b/d, versus 1.95 and 1.94 million b/d in respectively 2008 and 1.96 million b/d, versus 2.06 and 2.08 million b/d in respectively 2008 and 2007. 2007. 2008 and 2007. Chart 23: US Oil Consumption January 2004 - February 2010 Chart 24: Mexico Oil Consumption Jan. 2004 - February 2010 Chart 25: Canada Oil Consumption January 2004 - Feb. 2010 22 2.3 2.3 21 2.2 2.2 2.1 20 2.1 Million barrels per day 2.0 19 2.0 1.9 18 1.9 1.8 17 1.8 1.7 16 1.7 Canada oil consumption (JODI) US oil consumption (JODI) 1.6 Mexico oil consumption (JODI) 15 1.5 1.6 2004 2005 2006 2007 2008 2009 2010 2004 2005 2006 2007 2008 2009 2010 2004 2005 2006 2007 2008 2009 2010 Source: Joint Oil Data Initiative Source: Joint Oil Data Initiative Source: Joint Oil Data Initiative Page 9
- 10. ASPO Netherlands OECD Oil Consumption France oil consumption Germany oil consumption Italy oil consumption Oil consumption in France increased by 198,000 b/d from January Oil consumption in Germany increased by 259,000 b/d from Oil consumption in Italy increased by 153,000 b/d from January to February 2010. Resulting in a consumption level of 1.94 million January to February 2010. Resulting in a consumption level of to February 2010. Resulting in a consumption level of 1.46 million b/d. Average consumption of oil in France in 2009 was 1.84 million 2.43 million b/d. Average oil consumption in Germany in 2009 was b/d. Average consumption in Italy in 2009 was 1.53 million b/d, b/d, versus 1.94 and 1.94 million b/d in respectively 2008 and 2.42 million b/d, versus 2.56 and 2.47 million b/d in respectively versus 1.60 and 1.67 million b/d in respectively 2008 and 2007. 2007. 2008 and 2007. Chart 26: France Oil Consumption January 2004 - February 2010 Chart 27: Germany Oil Consumption Jan. 2004 - February 2010 Chart 28: Italy Oil Consumption January 2004 - February 2010 2.3 3.0 2.2 2.9 2.1 2.2 2.8 2.0 2.1 2.7 1.9 Million barrels per day 2.6 1.8 2.0 2.5 1.7 1.9 2.4 1.6 2.3 1.5 1.8 2.2 1.4 1.7 2.1 1.3 2.0 1.2 1.6 France oil consumption (JODI) Germany oil consumption (JODI) Italy oil consumption (JODI) 1.9 1.1 1.5 1.8 1.0 2004 2005 2006 2007 2008 2009 2010 2004 2005 2006 2007 2008 2009 2010 2004 2005 2006 2007 2008 2009 2010 Source: Joint Oil Data Initiative Source: Joint Oil Data Initiative Source: Joint Oil Data Initiative Page 10
- 11. OECD Oil Consumption ASPO Netherlands Spain oil consumption United Kingdom oil consumption Poland oil consumption Oil consumption in Spain increased by 92,000 b/d from January Oil consumption in the United Kingdom decreased by 178,000 Oil consumption in Poland decreased by 15,000 from January to to February 2010. Resulting in a consumption level of 1.45 million b/d from January to February 2010. Resulting in a consumption February 2010. Resulting in a consumption level of 476,000 b/d. b/d. Average oil consumption in Spain in 2009 was 1.46 million level of 1.31 million b/d. Average oil consumption in the United Average consumption in Poland in 2009 was 530,000 b/d, versus b/d, versus 1.54 and 1.59 million b/d in respectively 2008 and Kingdom in 2009 was 1.57 million b/d, versus 1.61 and 1.67 million 527,000 and 507,000 b/d in respectively 2008 and 2007. 2007. b/d in respectively 2008 and 2007. Chart 29: Spain Oil Consumption January 2004 - February 2010 Chart 30: UK Oil Consumption Jan. 2004 - February 2010 Chart 31: Poland Oil Consumption January 2004 - February 2010 1.8 2.2 0.8 2.1 0.7 1.7 2.0 1.9 0.6 Million barrels per day 1.6 1.8 0.5 1.7 1.5 1.6 0.4 1.5 0.3 1.4 1.4 1.3 0.2 1.3 1.2 Spain oil consumption (JODI) UK oil consumption (JODI) 0.1 Poland oil consumption (JODI) 1.1 1.2 1.0 0.0 2004 2005 2006 2007 2008 2009 2010 2004 2005 2006 2007 2008 2009 2010 2004 2005 2006 2007 2008 2009 2010 Source: Joint Oil Data Initiative Source: Joint Oil Data Initiative Source: Joint Oil Data Initiative Page 11
- 12. ASPO Netherlands OECD Oil Consumption Netherlands oil consumption Japan oil consumption South Korea oil consumption Oil consumption in the Netherlands increased by 191,000 b/d Oil consumption in Japan increased by 253,000 b/d from January Oil consumption in South Korea decreased by 17,000 b/d from from January to February 2010 to a consumption level of 1.06 to February 2010. Resulting in a consumption level of 5.11 million January to February 2010. Resulting in a consumption level of million b/d. Average oil consumption in the Netherlands in 2009 b/d. Average oil consumption in Japan in 2009 was 4.43 million 2.34 million b/d. Average consumption in South Korea in 2009 was was 905,000 b/d, versus 945,000 and 920,0000 b/d in respectively b/d, versus 4.92 and 5.13 million b/d in respectively 2008 and 2.25 million b/d, versus 2.21 and 2.29 million b/d in respectively 2008 and 2007. 2007. 2008 and 2007. Chart 32: Netherlands Oil Consumption Jan. 2004 - Feb. 2010 Chart 33: Japan Oil Consumption Jan. 2004 - February 2010 Chart 34: South Korea Oil Consumption Jan. 2004 - Feb. 2010 1.2 7.0 3.0 6.5 2.8 1.1 6.0 2.6 Million barrels per day 1.0 5.5 2.4 0.9 5.0 2.2 4.5 2.0 0.8 4.0 1.8 0.7 Netherlands oil consumption (JODI) 3.5 Japan oil consumption (JODI) 1.6 South Korea oil consumption (JODI) 0.6 3.0 1.4 2004 2005 2006 2007 2008 2009 2010 2004 2005 2006 2007 2008 2009 2010 2004 2005 2006 2007 2008 2009 2010 Source: Joint Oil Data Initiative Source: Joint Oil Data Initiative Source: Joint Oil Data Initiative Page 12
- 13. Asia Oil Consumption ASPO Netherlands China oil consumption India oil consumption Taiwan oil consumption Oil consumption in China increased by 331,000 b/d from January Oil consumption in India increased by 268,000 b/d from January Oil consumption in Taiwan increased by 13,000 b/d from January to February 2010. Resulting in a consumption level of 8.75 million to February 2010. Resulting in a consumption level of 3.1 million to February 2010. Resulting in a consumption level of 1.07 million b/d according to JODI statistics. Average oil consumption in China b/d. Average oil consumption in India in 2009 was 2.85 million b/d, b/d. Average consumption in Taiwan in 2009 was 976,000 b/d, in 2009 was 8.05 million b/d, versus 6.92 and 7.29 million b/d in versus 2.60 and 2.43 million b/d in respectively 2008 and 2007. versus 978,000 and 958,000 b/d in respectively 2008 and 2007. respectively 2008 and 2007. Chart 35: China Oil Consumption January 2004 - February 2010 Chart 36: India Oil Consumption Jan. 2004 - February 2010 Chart 37: Taiwan Oil Consumption January 2004 - Feb. 2010 10.0 3.4 1.4 9.5 3.2 1.3 9.0 3.0 1.2 8.5 2.8 1.1 Million barrels per day 8.0 2.6 7.5 1.0 2.4 7.0 0.9 2.2 6.5 0.8 2.0 6.0 0.7 1.8 5.5 0.6 5.0 1.6 China oil consumption (JODI) India oil consumption (JODI) Taiwan oil consumption (JODI) 4.5 1.4 0.5 4.0 1.2 0.4 2004 2005 2006 2007 2008 2009 2010 2004 2005 2006 2007 2008 2009 2010 2004 2005 2006 2007 2008 2009 2010 Source: Joint Oil Data Initiative Source: Joint Oil Data Initiative Source: Joint Oil Data Initiative Page 13
- 14. ASPO Netherlands OECD Crude Oil Stocks OECD crude oil stocks OECD product stocks Europe crude oil stocks Industrial inventories of crude oil in the OECD in February 2010 Industrial product stocks in the OECD in February 2010 decreased Industrial inventories of crude oil in OECD Europe in February 2010 decreased to 972 million from 983 million barrels in January to 1441 million from 1468 million barrels in January according to decreased to 323 from 340 million barrels in January according to according to the latest IEA statistics. Current OECD crude oil the latest IEA Statistics. Current OECD product stocks are 35 million the latest IEA statistics. Current OECD Europe crude oil stocks are stocks are 7 million barrels higher than the five year average of barrels higher than the five year average of 1406 million barrels. In 13 million barrels lower than the five year average of 336 million 965 million barrels. In the March Oil Market Report of the IEA a the March Oil Market Report of the IEA a total stock level of 1447 barrels. In the March Oil Market Report of the IEA a total stock level total stock level of 979 million barrels was tabulated for January million barrels was tabulated for January which has been revised of 341 million barrels was tabulated for January which has been which has been revised upward to 983 million barrels in the April upward to 1468 million barrels in the April edition. revised downward to 340 million barrels in the April edition. edition. Chart 38: OECD Crude Oil Stocks January 2004 - February 2010 Chart 39: OECD Product Stocks January 2004 - February 2010 Chart 40: Europe Crude Oil Stocks January 2004 - February 2010 1200 1600 425 400 1100 1500 375 1000 1400 350 Million barrels 325 900 1300 300 800 1200 275 250 700 1100 OECD crude oil stocks (IEA) OECD product stocks (IEA) Europe crude oil stocks (IEA) 225 600 1000 200 2003 2004 2005 2006 2007 2008 2009 2010 2003 2004 2005 2006 2007 2008 2009 2010 2003 2004 2005 2006 2007 2008 2009 2010 Source: International Energy Agency Source: International Energy Agency Source: International Energy Agency Page 14
- 15. OECD Crude Oil Stocks ASPO Netherlands Europe product stocks Pacific crude oil stocks Pacific product stocks Industrial product stocks in OECD Europe in February 2010 Industrial inventories of crude oil in OECD Pacific in February 2010 Industrial product stocks in OECD Pacific in February 2010 decreased to 588 million from 600 million barrels in January decreased to a level of 154 million from 162 million barrels in remained stable at 170 million barrels from January according to according to the latest IEA statistics. Current OECD Europe product January according to the latest IEA statistics. Current OECD Pacific the latest IEA Statistics. Current OECD Pacific product stocks are stocks are 34 million barrels higher than the five year average of crude oil stocks are 14 million barrels lower than the five year 9 million barrels lower than the five year average of 179 million 554 million barrels. In the March Oil Market Report of the IEA a average of 168 million barrels. In the March Oil Market Report of barrels. In the March Oil Market Report of the IEA a total stock total stock level of 390 million barrels was tabulated for January the IEA a total stock level of 162 million barrels was tabulated for level of 168 million barrels was tabulated for January which has which has been revised upward to 600 million barrels in the April January which has been revised upward to 164 million barrels in been revised upward to 170 million barrels in the April edition. edition. the April edition. Chart 41: Europe Product Stocks January 2004 - February 2010 Chart 42: Pacific Crude Oil Stocks January 2004 - February 2010 Chart 43: Pacific Product Stocks January 2004 - February 2010 650 250 250 625 225 225 600 200 575 200 175 550 Million barrels 525 150 175 500 125 150 475 100 450 125 Europe product stocks (IEA) Pacific crude oil stocks (IEA) Pacific product stocks (IEA) 75 425 400 50 100 2003 2004 2005 2006 2007 2008 2009 2010 2003 2004 2005 2006 2007 2008 2009 2010 2003 2004 2005 2006 2007 2008 2009 2010 Source: International Energy Agency Source: International Energy Agency Source: International Energy Agency Page 15
- 16. ASPO Netherlands OECD Crude Oil Stocks North America crude oil stocks North America product stocks US gasoline stocks Industrial inventories of crude oil in OECD North America in Industrial product stocks in North America in February 2010 Gasoline stocks in the United States in March 2010 decreased to February 2010 increased to 495 million from 480 million barrels in decreased to 683 million from 698 million barrels in January 226 million from 231 million barrels in February according to the January according to the latest IEA statistics. Current OECD North according to the latest IEA Statistics. Current North American latest EIA Statistics. Current Gasoline stocks are 17 million barrels America crude oil stocks are 33 million barrels higher than the five product stocks are 9 million barrels higher than the five year higher than the five year average of 209 million barrels. year average of 462 million barrels. In the March Oil Market Report average of 674 million barrels. In the March Oil Market Report of of the IEA a total stock level of 474 million barrels was tabulated the IEA a total stock level of 690 million barrels was tabulated for for January which has been revised upward to 480 million barrels January which has been revised upward to 698 million barrels in in the April edition. the April edition. Chart 44: North America Crude Oil Stocks Jan. 2004 - Feb. 2010 Chart 45: North America Product Stocks Jan. 2004 - Feb. 2010 Chart 46: United States Gasoline Stocks Jan. 2004 - March 2010 600 800 300 575 275 550 750 525 250 500 700 475 225 Million barrels 450 650 425 200 400 600 175 375 350 550 150 325 300 North America crude oil stocks (IEA) 500 North America product stocks (IEA) US gasoline stocks (EIA) 125 275 250 450 100 2003 2004 2005 2006 2007 2008 2009 2010 2003 2004 2005 2006 2007 2008 2009 2010 2003 2004 2005 2006 2007 2008 2009 2010 Source: International Energy Agency Source: International Energy Agency Source: Energy Information Administration Page 16
- 17. Oil Imports & Exports ASPO Netherlands Mexico oil exports United Kingdom oil exports Norway oil exports Crude oil exports from Mexico decreased by 10,000 b/d from 2nd Crude oil exports from the United Kingdom decreased by 246,000 Oil exports from Norway increased by 130,000 b/d from 2nd qrt. qrt. 2009 to 3rd qrt. 2009 to a level of 1.32 million b/d. Average b/d from 2nd qrt. 2009 to 3rd qrt. 2009 to a level of 768,000 b/d. 2009 to 3rd qrt. 2009 to a level of 1.73 million b/d. Average oil oil export from Mexico in 2009 up to the 3rd qrt. was 1.35 million Average oil export from the United Kingdom in 2009 up to the export from Norway in 2009 up to the 3rd qrt. was 1.74 million b/d, versus 1.55, 1.85, and 2.04 million b/d in respectively 2008, 3rd qrt. was 886,000 b/d, versus 957,000 b/d, 1.02, and1.0 million b/d, versus 1.67, 1.97, and 2.17 million b/d in respectively 2008, 2007 and 2006. b/d in respectively 2008, 2007 and 2006. Since 2004 the United 2007 and 2006. Kingdom became a net importer of oil. Net imports were 387,000 b/d in 3rd qrt. 2009. Chart 47: Mexico oil exports 1st qrt. 2002 - 3rd qrt. 2009 Chart 48: UK oil exports 1st qrt. 2002 - 3rd qrt. 2009 Chart 49: Norway oil exports 1st qrt. 2002 - 3rd qrt. 2009 4.0 3.0 3.6 2.8 3.4 3.5 2.6 3.2 2.4 3.0 3.0 2.2 2.8 Million barrels per day 2.0 2.6 2.5 1.8 2.4 1.6 2.0 2.2 1.4 2.0 1.2 1.5 1.8 1.0 1.6 1.0 0.8 0.6 1.4 Liquids exports (IEA) Liquids exports (IEA) Liquids exports (IEA) 0.4 1.2 0.5 Liquids Production (IEA) Liquids Production (IEA) Liquids Production (IEA) 0.2 Liquids imports (IEA) 1.0 0.0 0.0 0.8 2002 2003 2004 2005 2006 2007 2008 2009 2002 2003 2004 2005 2006 2007 2008 2009 2002 2003 2004 2005 2006 2007 2008 2009 Source: International Energy Agency Source: International Energy Agency Source: International Energy Agency Page 17
- 18. ASPO Netherlands Oil Imports & Exports Denmark oil exports Australia oil exports Japan oil imports Oil exports from Denmark increased by 29,000 b/d from 2nd qrt. Oil exports from Australia increased by 14,000 b/d from 2nd qrt. Oil imports in Japan remained stable at 3.43 million b/d from 2nd to 3rd qrt. 2009 to a level of 212,000 b/d. Average oil export from to 3rd qrt. 2009 to a level of 255,000 b/d. Average oil export from qrt. to 3rd qrt. 2009. Average oil import in Japan in 2009 up to 3rd Denmark in 2009 up to 3rd qrt. was 187,000 b/d, versus,184,000, Australia in 2009 up to 3rd qrt. was 252,000 b/d, versus 270,000, qrt. was 3.58 million b/d, versus 4.12, 4.09 and 4.15 million b/d in 191,000 and 233,000 b/d in respectively 2008, 2007, and 2006. 252,000 b/d and 217,000 b/d in respectively 2008, 2007, and respectively 2008, 2007, and 2006. 2006. Chart 50: Denmark oil exports 1st qrt. 2002 - 3rd qrt. 2009 Chart 51: Australia oil exports 1st qrt. 2002 - 3rd qrt. 2009 Chart 52: Japan Oil Imports 1st qrt. 2002 - 3rd qrt. 2009 0.60 1.0 5.0 Liquids exports (IEA) Liquids exports (IEA) 0.55 0.9 Liquids Production (IEA) Liquids Production (IEA) 4.8 0.50 Liquids imports (IEA) 0.8 Liquids imports (IEA) 4.6 0.45 0.7 Million barrels per day 0.40 4.4 0.35 0.6 4.2 0.30 0.5 4.0 0.25 0.4 0.20 3.8 0.3 0.15 3.6 0.2 0.10 Liquids (IEA) 0.1 3.4 0.05 0.00 0.0 3.2 2002 2003 2004 2005 2006 2007 2008 2009 2002 2003 2004 2005 2006 2007 2008 2009 2002 2003 2004 2005 2006 2007 2008 2009 Source: International Energy Agency Source: International Energy Agency Source: International Energy Agency Page 18
- 19. Oil Imports & Exports ASPO Netherlands OECD oil imports United States oil imports OECD Europe oil imports Oil imports in the group of OECD countries increased by 395,000 Oil imports in the United States increased by 78,000 b/d from 2nd Oil imports from OECD Europe decreased by 14,000 b/d from 2nd million b/d from 2nd qrt. to 3rd qrt. 2009 to a level of 29.84 million qrt. to 3rd qrt. 2009 to a level of 10.64 million b/d. Average oil qrt. to 3rd qrt. 2009 to a level of 12.02 million b/d. Average oil b/d. Average oil import in OECD countries in 2009 up to 3rd qrt. import in the United States in 2009 up to 3rd qrt. was 10.68 million import in OECD Europe in 2009 up to 3rd qrt. was 12.01 million was 29.91 million b/d, versus 32.19, 32.47 and 32.7 million b/d in b/d, versus 11.43, 11.55 and 11.77 million b/d in respectively 2008, b/d, versus 12.98, 13.05 and 13.18 million b/d in respectively respectively 2008, 2007, and 2006. 2007, and 2006. 2008, 2007, and 2006. Chart 53: OECD Oil Imports 1st qrt. 2002 - 3rd qrt. 2009 Chart 54: USA Oil Imports 1st qrt. 2002 - 3rd qrt. 2009 Chart 55: OECD Europe Oil Imports 1st qrt. 2002 - 3rd qrt. 2009 34.0 13.0 14.0 33.5 12.5 13.5 33.0 12.0 32.5 Million barrels per day 13.0 11.5 32.0 31.5 11.0 12.5 31.0 10.5 12.0 30.5 10.0 30.0 Liquids (IEA) 11.5 Liquids (IEA) Liquids (IEA) 9.5 29.5 29.0 9.0 11.0 2002 2003 2004 2005 2006 2007 2008 2009 2002 2003 2004 2005 2006 2007 2008 2009 2002 2003 2004 2005 2006 2007 2008 2009 Source: International Energy Agency Source: International Energy Agency Source: International Energy Agency Page 19