

Recomendados
Más contenido relacionado
La actualidad más candente
La actualidad más candente (20)
Destacado
Destacado (8)
Similar a Oilwatch Monthly - January 2010
Similar a Oilwatch Monthly - January 2010 (20)
Más de Bob Lowery
Más de Bob Lowery (20)
Último
Último (20)
Oilwatch Monthly - January 2010
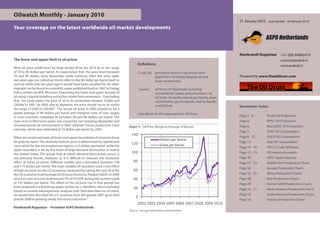
- 1. Oilwatch Monthly - January 2010 21 January 2010 - (next update: 18 February 2010) Your coverage on the latest worldwide oil market developments ASPO Netherlands Rembrandt Koppelaar +31 (0)6 44082419 The lower and upper limit to oil prices contact@peakoil.nl Definitions www.peakoil.nl Most oil price predictions by large analyst firms for 2010 lie in the range of 70 to 90 dollars per barrel. An expectation that the price level between Crude Oil, petroleum found in liquid and semi 70 and 85 dollars since November while continue. After the price spike liquid form including deepsea oil and Powered by www.theoildrum.com two years ago our collective minds refer to this 80 dollar per barrel level as lease condensates. normal, while only ten years ago it would have been uncalled for. An older example can be found in a scientific paper published back in 1987 in Energy Liquids, all forms of liquid fuels including Policy written by M.B. Morrison. Examining the lower and upper bounds of conventional, heavy, and extra heavy oil, oil using a typical Hotelling extraction model from economics. Concluding oil shale, oil sands, natural gas liquids, lease that “we could expect the price of oil to lie somewhere between $5/bbl and condensates, gas-to-liquids, coal-to-liquids, $20/bbl in 1987. By 2005, due to depletion, the price should rise to lie within and biofuels. Newsletter Index the range $15/bbl to $30/bbl.” The actual oil price in 2005 proved to be a global average of 48 dollars per barrel and marginal costs of new supply One Barrel of oil is equivalent to 159 litres in most countries nowadays lie between 60 and 80 dollars per barrel. The Page 2 - 4: World Oil Production main error in Morrisons paper was caused by not including deepwater and Page 5: OPEC Oil Production unconventional oil environment in their ‘ultimate’ future production costs Chart 1: Oil Price Weighed Average of Blends Page 6: Non-OPEC Oil Production estimate, which was estimated at 15 dollars per barrel by 2005. Page 7: OPEC Oil Consumption 140 When we revisit estimates of lower and upper boundaries of oil prices these Page 8 - 12: OECD Oil Consumption Dollars per Barrel lie quite far apart. The absolute bottom price is determined by operational Page 13: Asia Oil Consumption 120 Euros per Barrel costs which for the most expensive regions is 25 dollars per barrel, while the Page 14 - 16: OECD Crude Oil Stocks upper boundary is set by the onset of large demand destruction in mainly the United States. The actual limit at which demand destruction occurs is 100 Page 17 - 19: Oil Imports & exports not precisely known, however, as it is difficult to measure the economic Page 20: OPEC Spare Capacity effect of rising oil prices. Different studies give a boundary between 100 80 Page 21 - 23: Middle East Production Charts and 175 dollars per barrel. The main variable of causation used is the effect Page 24: Europe Production Charts of high oil prices on the US economy, measured by taking the cost of oil for 60 the US economy in percentage of US Gross Domestic Product (GDP). In 2008 Page 25 - 27: Africa Production Charts oil prices rose to a cost level around 7% of US GDP during the summer peak 40 Page 28: Asia Production Charts of 147 dollars per barrel. The effect of the oil price rise in that period has Page 29: Former USSR Production Charts been analyzed in a Brookings paper written by J. Hamilton, who concluded 20 Page 30 - 31: North America Production Charts based on several autoregression analyses that “had there been no oil shock, we would have described the U.S. economy from 4th quarter 2007 up to third Page 32: South America Production Charts 0 quarter 2008 as growing slowly, but not in a recession.” Page 33: Oceania Production Charts 2002 2003 2004 2005 2006 2007 2008 2009 2010 Rembrandt Koppelaar - President ASPO Netherlands Source: Energy Information Admistration
- 2. ASPO Netherlands World Oil Production World liquid fuels production World crude oil production World natural gas liquids production In December 2009 world production of all liquid fuels increased Latest figures from the Energy Information Administration (EIA) Natural Gas Liquids production from natural gas fields increased by 270,000 barrels per day from November according to the latest show that crude oil production including lease condensates by 95,000 b/d from September to October 2009 according to the fgures of the International Energy Agency (IEA). Resulting in increased by 592,000 b/d from September to October 2009. latest International Petroleum Monthly of the Energy Information total world liquid fuels production of 86.17 million b/d. Liquids Resulting in total production of crude oil including lease Administration (EIA). Resulting in a total NGL production of 8.22 production for November 2009 was revised downwards in the IEA condensates of 73.12 million b/d. million b/d. Oil Market Report of December from 85.94 to 85.9 million b/d. Average global liquid fuels production in 2009 was 84.97 versus 86.6 and 85.32 million b/d in 2008 and 2007. Chart 2: Liquids Production January 2004 - December 2009 Chart 3: Crude Oil Production January 2004 - October 2009 Chart 4: Liquids Production January 2004 - October 2009 90 76 8.4 8.2 75 88 8.0 74 7.8 Million barrels per day 86 7.6 73 84 7.4 72 7.2 82 71 7.0 Liquids (IEA) 6.8 80 70 Crude Oil (EIA) Natural Gas Liquids (EIA) Liquids (EIA) 6.6 78 69 6.4 2004 2005 2006 2007 2008 2009 2004 2005 2006 2007 2008 2009 2004 2005 2006 2007 2008 2009 Source: International Energy Agency & Energy Information Administration Source: Energy Information Administration Source: Energy Information Administration Page 2
- 3. World Oil Production ASPO Netherlands World conventional crude versus liquids production ratio World unconventional liquid fuels production World energy content from liquid fuels production Approximately 85% of world liquid fuels production in 2008 came In 2008 the biggest part of unconventional liquid fuels production In production statistics all liquid fuels are aggregated as total from conventional crude oil including lease condensates. The came from Natural Gas Liquids at 11% or 7.94 million b/d. ‘oil’ production while containing different amounts of energy remaining share of 15% was produced by unconventional sources Secondly, extra heavy crude and bitumen at 3.4% or 2.68 million per barrel produced. For example, a barrel of crude oil contains including Biofuels, Extra Heavy Oil, Tar Sands, Polar Oil and Natural b/d of which 1.27 million b/d from Canadian oil sands and 1.41 around 5.8 million British Thermal Units while a similar barrel of Gas Liquids. In absolute amounts unconventional production has million b/d from other sources. Thirdly, Biofuels at 1.8% or 1.45 natural gas liquids contains 4.2 million BTU. Conversion to BTU’s increased steadily, from 4 million b/d at the end of the 1970s, to million b/d. A and finally Polar Oil at a production rate of 840,000 shows that actual available energy worldwide in December 2009 approximately 12.9 mb/d in 2008, excluding lease condensates. b/d in 2008 or 1.1% of total liquids supply. was 3.3% lower than liquids statistics counted in barrels would suggest. Chart 5: World Crude and Liquids production 1938 - 2008 Chart 6: Unconventional Oil Production 1938 - 2008 Chart 7: World Production in BTU January 2003 - Dec. 2009 100 14 550 Liquids Biofuels Biofuels 90 X-Heavy crude (excl. Canada) Conventional crude 525 Natural Gas Liquids 12 Canadian Oil Sands 80 Polar Oil Crude Oil Natural Gas Liquids 500 70 10 Million barrels per day Trillion BTU per day 475 60 8 50 450 6 40 425 30 4 400 20 2 375 10 0 0 350 1938 1948 1958 1968 1978 1988 1998 2008 1938 1948 1958 1968 1978 1988 1998 2008 2003 2004 2005 2006 2007 2008 2009 Source: International Energy Agency & Energy Information Administration Source: EIA, EIA & CAPP Source: International Energy Agency Page 3
- 4. ASPO Netherlands World Oil Production World biofuels production IEA liquid fuels versus liquids excluding biofuels production EIA liquids versus IEA liquids excluding biofuels production Total world biofuel in December 2009 is estimated to be 1.79 Total liquid fuels production excluding biofuels in December 2009 Liquid fuels production figures published by the Energy million b/d based on statistics compiled from the Energy is estimated to be 84.34 million b/d, an increase of 217,000 b/d Information Administration in their International Petroleum Information Administration, the International Energy Agency and from November production according to the latest figures of the Monthly excludes biofuels produced in countries beside the the Brazilian ministry of Energy. With an estimated 753,000 b/d International Energy Agency. United States and Brazil. The remaining difference is caused from the United States, 610,000 b/d from Brazil and 430,000 b/d by discrepancies between natural gas liquids and Canadian from other countries. unconventional oil production. Chart 8: World Biofuels Production Jan. 2004 - December 2009 Chart 9: IEA Liquids comparison January 2004 - December 2009 Chart 10: EIA & EIA Liquids Comparison Jan. 2004 - Dec. 2009 2.0 90 88 1.8 87 88 1.6 86 1.4 86 85 Million barrels per day 1.2 84 84 1.0 83 82 0.8 82 0.6 80 81 0.4 80 Liquids excluding biofuels (IEA) Liquids excluding biofuels (IEA) 78 Biofuels (IEA) Liquids (IEA) Liquids (EIA) 0.2 79 0.0 76 78 2004 2005 2006 2007 2008 2009 2004 2005 2006 2007 2008 2009 2004 2005 2006 2007 2008 2009 Source: IEA, EIA, Brazilian Ministry of Energy Source: Energy Information Administration Source: Energy Information Administration Page 4
- 5. OPEC Oil Production ASPO Netherlands OPEC liquid fuels production OPEC crude oil production OPEC natural gas liquids production Total liquid fuels production in OPEC countries increased by Total crude oil production excluding lease condensates of the OPEC natural gas liquids remained stable from November to 70,000 b/d from November to December to a level of 34.21 million OPEC cartel increased by 80,000 b/d to a level of 29.05 million December 2009 at a level of 5.17 million b/d. Average OPEC b/d. Average liquid fuels production in 2009 was 33.7 million b/d, b/d, from November to December 2009, according to the latest natural gas liquids production in 2009 up to November was 5.0 versus 36.09 and 35.02 million b/d in respectively 2008 and 2007. available estimate of the IEA. Average crude oil production in million b/d, versus 4.66 and 4.55 million b/d in respectively 2008 All time high production of OPEC liquid fuels stands at 36.58 2009 was 28.7 million b/d, versus 31.43 and 30.37 million b/d in and 2007. million b/d reached in July 2008. respectively 2008 and 2007. Chart 11: OPEC Liquids Production Jan. 2004 - December 2009 Chart 12: OPEC Crude Oil Production Jan. 2004 - Dec. 2009 Chart 13: OPEC NGL Production January 2004 - December 2009 38 33 5.5 37 32 5.0 36 31 Million barrels per day 35 4.5 30 34 29 4.0 33 28 32 3.5 27 31 Liquids (IEA) Crude Oil (IEA) 3.0 Natural Gas Liquids (IEA) 30 Liquids (EIA) 26 Crude Oil (EIA) Natural Gas Liquids (EIA) 29 25 2.5 2004 2005 2006 2007 2008 2009 2004 2005 2006 2007 2008 2009 2004 2005 2006 2007 2008 2009 Source: International Energy Agency & Energy Information Administration Source: Energy Information Administration Source: Energy Information Administration Page 5
- 6. ASPO Netherlands Non-OPEC Oil Production Non-OPEC liquid fuels production Non-OPEC crude oil production Non-OPEC natural gas liquids production Total liquid fuels production excluding biofuels in Non-OPEC Total Non-OPEC crude oil production excluding lease condensates Non-OPEC natural gas liquids production increased by 61,000 from countries increased by 147,000 b/d from November to December increased by 542,000 b/d to a level of 42.11 million b/d, from September to October to a level of 3.42 million b/d. Average Non- 2009. Resulting in a production level of 50.17 million b/d September to October 2009, according to the latest available OPEC natural gas liquids production in 2009 up to October was according to the International Energy Agency. Average liquid estimate of the EIA. Average crude oil production in 2009 up to 3.39 million b/d, versus 3.65 and 3.79 million b/d in respectively fuels production in 2009 was 49.68 million b/d, versus 49.32 and October was 41.51 million b/d, versus 41.32 and 41.80 million b/d 2008 and 2007. 49.34 million b/d in respectively 2008 and 2007. in respectively 2008 and 2007. Chart 14: Non-OPEC Liquids Production Jan. 2004 - Dec. 2009 Chart 15: Non-OPEC Crude Oil Production Jan. 2004 - Oct. 2009 Chart 16: Non-OPEC NGL Production January 2004 - Oct. 2009 51 43.0 4.5 42.5 50 4.0 42.0 49 Million barrels per day 41.5 3.5 48 41.0 47 3.0 40.5 46 40.0 Liquids (IEA) 2.5 45 Crude oil (EIA) Natural Gas Liquids (EIA) Liquids (EIA) 39.5 44 39.0 2.0 2004 2005 2006 2007 2008 2009 2004 2005 2006 2007 2008 2009 2004 2005 2006 2007 2008 2009 Source: International Energy Agency & Energy Information Administration Source: Energy Information Administration Source: Energy Information Administration Page 6
- 7. OPEC Oil Consumption ASPO Netherlands OPEC oil consumption Iran oil consumption Saudi Arabia oil consumption Oil consumption in all OPEC oil producers combined decreased Oil consumption in Iran decreased by 10,000 b/d from September Oil consumption in Saudi Arabia decreased by 313,000 b/d from by 394,000 b/d from September to October. Resulting in to October 2009 to a level of 1.51 million b/d. Average Iranian oil September to October 2009 to a level of 1.75 million b/d. Average a consumption level of 5.89 million b/d. Average OPEC oil consumption in 2009 up to October was 1.51 million b/d, versus Saudi Arabian oil consumption in 2009 up to October was 1.85 consumption in 2009 up to October was 5.97 million b/d, versus 1.64 and 1.52 million b/d in respectively 2008 and 2007. million b/d, versus 1.65 and 1.52 million b/d in respectively 2008 5.76 and 5.30 million b/d in respectively 2008 and 2007. and 2007. Chart 17: OPEC Oil Consumption January 2004 - Oct. 2009 Chart 18: Iran Oil Consumption January 2004 - October 2009 Chart 19: Saudi Arabia Oil Consumption Jan. 2004 - Oct. 2009 7 2.4 2.6 2.2 2.4 6 2.0 2.2 Million barrels per day 5 2.0 1.8 1.8 4 1.6 1.6 1.4 3 1.4 1.2 2 1.2 1.0 1.0 1 0.8 0.8 0.6 0 0.6 2004 2005 2006 2007 2008 2009 0.4 0.4 Iran oil consumption (JODI) Saudi Arabia oil consumption (JODI) Iraq Venezuela UAE Saudi Arabia 0.2 0.2 Qatar Nigeria Libya Kuwait Iran Ecuador 0.0 0.0 Angola Algeria 12m rolling average 2004 2005 2006 2007 2008 2009 2004 2005 2006 2007 2008 2009 Source: Joint Oil Data Initiative Source: Joint Oil Data Initiative Source: Joint Oil Data Initiative Page 7
- 8. ASPO Netherlands OECD Oil Consumption OECD oil consumption North America oil consumption European Union oil consumption Oil consumption in OECD countries increased by 25,000 b/d from Oil consumption in North America increased by 319,000 b/d from Oil consumption in the European Union decreased by 625,000 September to October 2009. Resulting in a consumption level of September to October 2009. Resulting in a consumption level of b/d from September to October 2009. Resulting in a consumption 44.11 million b/d. Average OECD oil consumption in 2009 up to 22.84 million b/d. Average oil consumption in North America in level of 13.47 million b/d according to JODI statistics. Average October was 43.86 million b/d, versus 46.10 and 47.68 million b/d 2009 up to October was 22.50 million b/d, versus 23.50 and 24.72 consumption in the European Union in 2009 up to October was in respectively 2008 and 2007. million b/d in respectively 2008 and 2007. 13.6 million b/d, versus 14.25 and 14.32 million b/d in respectively 2008 and 2007. Chart 20: OECD Oil Consumption January 2004 - Oct. 2009 Chart 21: North America Oil Consumption Jan. 2004 - Oct. 2009 Chart 22: EU-27 Oil Consumption January 2004 - Oct. 2009 52.0 26.6 15.6 51.0 26.0 15.2 50.0 25.4 49.0 14.8 48.0 24.8 14.4 Million barrels per day 47.0 24.2 14.0 46.0 23.6 45.0 13.6 23.0 44.0 13.2 43.0 22.4 42.0 12.8 21.8 41.0 12.4 21.2 40.0 OECD oil consumption (JODI) North America oil consumption (JODI) EU-27 oil consumption (JODI) 20.6 12.0 39.0 38.0 20.0 11.6 2004 2005 2006 2007 2008 2009 2004 2005 2006 2007 2008 2009 2004 2005 2006 2007 2008 2009 Source: Joint Oil Data Initiative Source: Joint Oil Data Initiative Source: Joint Oil Data Initiative Page 8
- 9. OECD Oil Consumption ASPO Netherlands United States oil consumption Mexico oil consumption Canada oil consumption Oil consumption in the US increased by 421,000 b/d from Oil consumption in Mexico decreased by 132,000 b/d from Oil consumption in Canada increased by 30,000 b/d from September to October 2009. Resulting in a consumption level of September to October 2009. Resulting in a consumption level of September to October 2009. Resulting in a consumption level of 18.78 million b/d. Average consumption of oil in the US in 2009 1.93 million b/d. Average oil consumption in Mexico in 2009 up to 2.12 million b/d. Average consumption in Canada in 2009 up to up to September was 18.65 million b/d, versus 19.50 and 20.70 October was 1.88 million b/d, versus 1.95 and 1.94 million b/d in October was 1.97 million b/d, versus 2.06 and 2.08 million b/d in million b/d in respectively 2008 and 2007. respectively 2008 and 2007. respectively 2008 and 2007. Chart 23: US Oil Consumption January 2004 - October 2009 Chart 24: Mexico Oil Consumption Jan. 2004 - October 2009 Chart 25: Canada Oil Consumption January 2004 - Oct. 2009 22 2.3 2.3 21 2.2 2.2 2.1 20 2.1 Million barrels per day 2.0 19 2.0 1.9 18 1.9 1.8 17 1.8 1.7 16 1.7 Canada oil consumption (JODI) US oil consumption (JODI) 1.6 Mexico oil consumption (JODI) 15 1.5 1.6 2004 2005 2006 2007 2008 2009 2004 2005 2006 2007 2008 2009 2004 2005 2006 2007 2008 2009 Source: Joint Oil Data Initiative Source: Joint Oil Data Initiative Source: Joint Oil Data Initiative Page 9
- 10. ASPO Netherlands OECD Oil Consumption France oil consumption Germany oil consumption Italy oil consumption Oil consumption in France decreased by 60,000 b/d from Oil consumption in Germany decreased by 115,000 b/d from Oil consumption in Italy increased by 5,000 b/d from September September to October 2009. Resulting in a consumption level of September to October 2009. Resulting in a consumption level of to October 2009. Resulting in a consumption level of 1.59 million. 1.83 million b/d. Average consumption of oil in France in 2009 up 2.41 million b/d. Average oil consumption in Germany in 2009 up Average consumption in Italy in 2009 up to October was 1.53 to October was 1.83 million b/d, versus 1.94 and 1.94 million b/d to October was 2.44 million b/d, versus 2.56 and 2.47 million b/d million b/d, versus 1.60 and 1.67 million b/d in respectively 2008 in respectively 2008 and 2007. in respectively 2008 and 2007. and 2007. Chart 26: France Oil Consumption January 2004 - Oct. 2009 Chart 27: Germany Oil Consumption Jan. 2004 - Oct. 2009 Chart 28: Italy Oil Consumption January 2004 - October 2009 2.3 3.0 2.2 2.9 2.1 2.2 2.8 2.0 2.1 2.7 1.9 Million barrels per day 2.6 1.8 2.0 2.5 1.7 1.9 2.4 1.6 2.3 1.5 1.8 2.2 1.4 1.7 2.1 1.3 2.0 1.2 1.6 France oil consumption (JODI) Germany oil consumption (JODI) Italy oil consumption (JODI) 1.9 1.1 1.5 1.8 1.0 2004 2005 2006 2007 2008 2009 2004 2005 2006 2007 2008 2009 2004 2005 2006 2007 2008 2009 Source: Joint Oil Data Initiative Source: Joint Oil Data Initiative Source: Joint Oil Data Initiative Page 10
- 11. OECD Oil Consumption ASPO Netherlands Spain oil consumption United Kingdom oil consumption Poland oil consumption Oil consumption in Spain decreased by 26,000 b/d from September Oil consumption in the United Kingdom decreased by 106,000 Oil consumption in Poland decreased by 6,000 from September to October 2009. Resulting in a consumption level of 1.44 million b/d from September to October 2009. Resulting in a consumption to October 2009. Resulting in a consumption level of 594,000 b/d. Average oil consumption in Spain in 2009 up to October was level of 1.48 million b/d. Average oil consumption in the United b/d. Average consumption in Poland in 2009 up to October was 1.47 million b/d, versus 1.54 and 1.59 million b/d in respectively Kingdom in 2009 up to October was 1.48 million b/d, versus 1.61 530,000 b/d, versus 527,000 and 507,000 b/d in respectively 2008 2008 and 2007. and 1.67 million b/d in respectively 2008 and 2007. and 2007. Chart 29: Spain Oil Consumption January 2004 - Sept. 2009 Chart 30: UK Oil Consumption Jan. 2004 - September 2009 Chart 31: Poland Oil Consumption January 2004 - Sept. 2009 1.8 2.2 0.8 2.1 0.7 1.7 2.0 1.9 0.6 Million barrels per day 1.6 1.8 0.5 1.7 1.5 1.6 0.4 1.5 0.3 1.4 1.4 1.3 0.2 1.3 1.2 Spain oil consumption (JODI) UK oil consumption (JODI) 0.1 Poland oil consumption (JODI) 1.1 1.2 1.0 0.0 2004 2005 2006 2007 2008 2009 2004 2005 2006 2007 2008 2009 2004 2005 2006 2007 2008 2009 Source: Joint Oil Data Initiative Source: Joint Oil Data Initiative Source: Joint Oil Data Initiative Page 11
- 12. ASPO Netherlands OECD Oil Consumption Netherlands oil consumption Japan oil consumption South Korea oil consumption Oil consumption in the Netherlands decreased by 303,000 b/d Oil consumption in Japan increased by 178,000 b/d from Oil consumption in South Korea increased by 131,000 b/d from from September to October 2009 resulting in a consumption September to October 2009. Resulting in a consumption level of September to October 2009. Resulting in a consumption level of level of 676,000 b/d. Average oil consumption in the Netherlands 4.4 million b/d. Average oil consumption in Japan in 2009 up to 2.22 million b/d. Average consumption in South Korea in 2009 up in 2009 up to September was 873,000 b/d, versus 945,000 and October was 4.36 million b/d, versus 4.92 and 5.13 million b/d in to October was 2.23 million b/d, versus 2.21 and 2.29 million b/d 920,0000 b/d in respectively 2008 and 2007. Consumption figures respectively 2008 and 2007. in respectively 2008 and 2007. for September 2009 were increased from 713,000 b/d to 979,000 b/d in the latest JODI update. Chart 32: Netherlands Oil Consumption Jan. 2004 - Oct. 2009 Chart 33: Japan Oil Consumption Jan. 2004 - October 2009 Chart 34: South Korea Oil Consumption Jan. 2004 - Oct. 2009 1.2 7.0 3.0 6.5 2.8 1.1 6.0 2.6 Million barrels per day 1.0 5.5 2.4 0.9 5.0 2.2 4.5 2.0 0.8 4.0 1.8 0.7 Netherlands oil consumption (JODI) 3.5 Japan oil consumption (JODI) 1.6 South Korea oil consumption (JODI) 0.6 3.0 1.4 2004 2005 2006 2007 2008 2009 2004 2005 2006 2007 2008 2009 2004 2005 2006 2007 2008 2009 Source: Joint Oil Data Initiative Source: Joint Oil Data Initiative Source: Joint Oil Data Initiative Page 12
- 13. Asia Oil Consumption ASPO Netherlands China oil consumption India oil consumption Taiwan oil consumption Oil consumption in China increased by 127,000 b/d from Oil consumption in India increased by 103,000 b/d from Oil consumption in Taiwan remained stable from September to September to October 2009. Resulting in a consumption level September to October 2009. Resulting in a consumption level of October 2009 at a level of 990,000 b/d. Average consumption in of 8.98 million b/d according to JODI statistics. Average oil 2.82 million b/d. Average oil consumption in India in 2009 up to Taiwan in 2009 up to October was 973,000 b/d, versus 978,000 consumption in China in 2009 up to October was 8.06 million b/d, October was 2.84 million b/d, versus 2.60 and 2.43 million b/d in and 958,000 b/d in respectively 2008 and 2007. versus 6.92 and 7.29 million b/d in respectively 2008 and 2007. respectively 2008 and 2007. Chart 35: China Oil Consumption January 2004 - October 2009 Chart 36: India Oil Consumption Jan. 2004 - October 2009 Chart 37: Taiwan Oil Consumption January 2004 - October 2009 10.0 3.4 1.4 9.5 3.2 1.3 9.0 3.0 1.2 8.5 2.8 1.1 Million barrels per day 8.0 2.6 7.5 1.0 2.4 7.0 0.9 2.2 6.5 0.8 2.0 6.0 0.7 1.8 5.5 0.6 5.0 1.6 China oil consumption (JODI) India oil consumption (JODI) Taiwan oil consumption (JODI) 4.5 1.4 0.5 4.0 1.2 0.4 2004 2005 2006 2007 2008 2009 2004 2005 2006 2007 2008 2009 2004 2005 2006 2007 2008 2009 Source: Joint Oil Data Initiative Source: Joint Oil Data Initiative Source: Joint Oil Data Initiative Page 13
- 14. ASPO Netherlands OECD Crude Oil Stocks OECD crude oil stocks OECD product stocks Europe crude oil stocks Industrial inventories of crude oil in the OECD in November 2009 Industrial product stocks in the OECD in November 2009 remained Industrial inventories of crude oil in OECD Europe in November increased to 984 million from 967 million barrels in October stable at 1466 from October levels according to the latest IEA 2009 increased to 342 from 322 million barrels in October according to the latest IEA statistics. Current OECD crude oil Statistics. Current OECD product stocks are 64 million barrels according to the latest IEA statistics. Current OECD Europe crude stocks are 22 million barrels higher than the five year average of higher than the five year average of 1402 million barrels. In the oil stocks are 6 million barrels higher than the five year average of 962 million barrels. In the December Oil Market Report of the IEA November Oil Market Report of the IEA a total stock level of 1499 336 million barrels. In the December Oil Market Report of the IEA a total stock level of 968 million barrels was tabulated for October million barrels was tabulated for October which has been revised a total stock level of 329 million barrels was tabulated for October which has been revised downwards to 967 million barrels in the downwards to 1466 million barrels in the December edition. which has been revised downwards to 322 million barrels in the January edition. January edition. Chart 38: OECD Crude Oil Stocks January 2004 - October 2009 Chart 39: OECD Product Stocks January 2004 - October 2009 Chart 40: Europe Crude Oil Stocks January 2004 - October 2009 1200 1600 425 400 1100 1500 375 1000 1400 350 Million barrels 325 900 1300 300 800 1200 275 250 700 1100 OECD crude oil stocks (IEA) OECD product stocks (IEA) Europe crude oil stocks (IEA) 225 600 1000 200 2003 2004 2005 2006 2007 2008 2009 2003 2004 2005 2006 2007 2008 2009 2003 2004 2005 2006 2007 2008 2009 Source: International Energy Agency Source: International Energy Agency Source: International Energy Agency Page 14
- 15. OECD Crude Oil Stocks ASPO Netherlands Europe product stocks Pacific crude oil stocks Pacific product stocks Industrial product stocks in OECD Europe in November 2009 Industrial inventories of crude oil in OECD Pacific in November Industrial product stocks in OECD Pacific in November increased to 570 million from 566 million barrels in October 2009 decreased to a level of 164 million from 166 million barrels 2009 decreased to 177 million from 180 million barrels in according to the latest IEA statistics. Current OECD Europe product in October according to the latest IEA statistics. Current OECD Octoberaccording to the latest IEA Statistics. Current OECD Pacific stocks are 19 million barrels higher than the five year average of Pacific crude oil stocks are 6 million barrels lower than the five product stocks are 4 million barrels lower than the five year 551 million barrels. In the December Oil Market Report of the IEA year average of 170 million barrels. In the December Oil Market average of 181 million barrels. a total stock level of 573 million barrels was tabulated for October Report of the IEA a total stock level of 171 million barrels was which has been revised downwards to 566 million barrels in the tabulated for October which has been revised downwards to 166 December edition. million barrels in the January edition. Chart 41: Europe Product Stocks January 2004 - October 2009 Chart 42: Pacific Crude Oil Stocks January 2004 - October 2009 Chart 43: Pacific Product Stocks January 2004 - October 2009 650 250 250 625 225 225 600 200 575 200 175 550 Million barrels 525 150 175 500 125 150 475 100 450 125 Europe product stocks (IEA) Pacific crude oil stocks (IEA) Pacific product stocks (IEA) 75 425 400 50 100 2003 2004 2005 2006 2007 2008 2009 2003 2004 2005 2006 2007 2008 2009 2003 2004 2005 2006 2007 2008 2009 Source: International Energy Agency Source: International Energy Agency Source: International Energy Agency Page 15
- 16. ASPO Netherlands OECD Crude Oil Stocks North America crude oil stocks North America product stocks US gasoline stocks Industrial inventories of crude oil in OECD North America in Industrial product stocks in North America in November Gasoline stocks in the United States in November 2009 increased November 2009 remained stable at 474 million barrels from 2009 decreased to 719 million from 721 million barrels in to 211 million from 209 million barrels in October according to the October according to the latest IEA statistics. Current OECD North Octoberaccording to the latest IEA Statistics. Current North latest EIA Statistics. Current Gasoline stocks are 3 million barrels America crude oil stocks are 22 million barrels higher than the five American product stocks are 48 million barrels higher than the higher than the five year average of 208 million barrels. year average of 456 million barrels. In the December Oil Market five year average of 671 million barrels. In the December Oil Report of the IEA a total stock level of 474 million barrels was Market Report of the IEA a total stock level of 719 million barrels tabulated for October which has been revised upwards to 478 was tabulated for October which has been revised upwards to 721 million barrels in the January edition. million barrels in the January edition. Chart 44: North America Crude Oil Stocks Jan. 2004 - Nov. 2009 Chart 45: North America Product Stocks Jan. 2004 - Nov. 2009 Chart 46: United States Gasoline Stocks Jan. 2004 - Nov. 2009 600 800 300 575 275 550 750 525 250 500 700 475 225 Million barrels 450 650 425 200 400 600 175 375 350 550 150 325 300 North America crude oil stocks (IEA) 500 North America product stocks (IEA) US gasoline stocks (EIA) 125 275 250 450 100 2003 2004 2005 2006 2007 2008 2009 2003 2004 2005 2006 2007 2008 2009 2003 2004 2005 2006 2007 2008 2009 Source: International Energy Agency Source: International Energy Agency Source: Energy Information Administration Page 16
- 17. Oil Imports & Exports ASPO Netherlands Mexico oil exports United Kingdom oil exports Norway oil exports Oil exports from Mexico decreased by 172,000 b/d from 4th qrt. Oil exports from the United Kingdom decreased by 73,000 b/d Oil exports from Norway increased by 37,000 b/d from 4th qrt. 2008 to 1st qrt. 2009 to a level of 1.40 million b/d. Average oil 4th qrt. 2008 to 1st qrt. 2009 to a level of 876,000 b/d. Average 2008 to 1st qrt. 2009 to a level of 1.91 million b/d. Average oil export from Mexico in 2008 was 1.55 million b/d, versus 1.85 and oil export from the United Kingdom in 2008 was 957,000 b/d, export from Norway in 2008 was 1.67 million b/d, versus 1.97 and 2.04 million b/d in respectively 2007 and 2006. versus 1.02 and 1.00 million b/d in respectively 2007 and 2006. 2.17 million b/d in respectively 2007 and 2006. Since 2004 the United Kingdom became a net importer of oil. Net imports were 186,000 b’/d in 1st qrt. 2009. Chart 47: Mexico oil exports 1st qrt. 2002 - 1st qrt. 2009 Chart 48: UK oil exports 1st qrt. 2002 - 1st qrt. 2009 Chart 49: Norway oil exports 1st qrt. 2002 - 1st qrt. 2009 4.0 3.0 3.6 2.8 3.4 3.5 2.6 3.2 2.4 3.0 3.0 2.2 2.8 Million barrels per day 2.0 2.6 2.5 1.8 2.4 1.6 2.0 2.2 1.4 2.0 1.2 1.5 1.8 1.0 1.6 1.0 0.8 0.6 1.4 Liquids exports (IEA) Liquids exports (IEA) Liquids exports (IEA) 0.4 1.2 0.5 Liquids Production (IEA) Liquids Production (IEA) Liquids Production (IEA) 0.2 Liquids imports (IEA) 1.0 0.0 0.0 0.8 2002 2003 2004 2005 2006 2007 2008 2002 2003 2004 2005 2006 2007 2008 2002 2003 2004 2005 2006 2007 2008 Source: International Energy Agency Source: International Energy Agency Source: International Energy Agency Page 17
- 18. ASPO Netherlands Oil Imports & Exports Denmark oil exports Australia oil exports Japan oil imports Oil exports from Denmark decreased by 17,000 b/d from 4th qrt. Oil exports from Australia decreased by 47,000 b/d from 4th qrt. Oil imports in Japan decreased by 64,000 b/d from 4th qrt. 2008 2008 to 1st qrt. 2009 to a level of 167,000 b/d. Average oil export 2008 to 1st qrt. 2009 to a level of 260,000 b/d. Average oil export to 1st qrt. 2009 to a level of 3.87 million b/d. Average oil import in from Denmark in 2008 was 184,000 b/d, versus 191,000 and from Australia in 2008 was 270,000 b/d, versus 252,000 b/d and Japan in 2008 was 4.12 million b/d, versus 4.09 and 4.15 million 233,000 b/d in respectively 2007 and 2006. 217,000 b/d in respectively 2007 and 2006. b/d in respectively 2007 and 2006. Chart 50: Denmark oil exports 1st qrt. 2002 - 1st qrt. 2009 Chart 51: Australia oil exports 1st qrt. 2002 - 1st qrt. 2009 Chart 52: Japan Oil Imports 1st qrt. 2002 - 1st qrt. 2009 0.60 1.0 5.0 Liquids exports (IEA) Liquids exports (IEA) 0.55 0.9 Liquids Production (IEA) Liquids Production (IEA) 4.8 0.50 Liquids imports (IEA) 0.8 Liquids imports (IEA) 4.6 0.45 0.7 Million barrels per day 0.40 4.4 0.35 0.6 4.2 0.30 0.5 4.0 0.25 0.4 0.20 3.8 0.3 0.15 3.6 0.2 0.10 Liquids (IEA) 0.1 3.4 0.05 0.00 0.0 3.2 2002 2003 2004 2005 2006 2007 2008 2002 2003 2004 2005 2006 2007 2008 2002 2003 2004 2005 2006 2007 2008 Source: International Energy Agency Source: International Energy Agency Source: International Energy Agency Page 18
- 19. Oil Imports & Exports ASPO Netherlands OECD oil imports United States oil imports OECD Europe oil imports Oil imports in the group of OECD countries decreased by 1.60 Oil imports in the United States decreased by 661,000 b/d from 4th Oil imports from OECD Europe decreased by 854,000 b/d from 4th million b/d from 4th qrt. 2008 to 1st qrt. 2009 to a level of 30.43 qrt. 2008 to 1st qrt. 2009 to a level of 10.84 million b/d. Average oil qrt. 2008 to 1st qrt. 2009 to a level of 11.98 million b/d. Average million b/d. Average oil import in OECD countries in 2008 was import in the United States in 2008 was 11.43 million b/d, versus oil import in OECD Europe in 2008 was 12.98 million b/d, versus 32.19 million b/d, versus 32.47 and 32.7 million b/d in respectively 11.55 and 11.77 million b/d in respectively 2007 and 2006. 13.05 and 13.18 million b/d in respectively 2007 and 2006. 2007 and 2006. Chart 53: OECD Oil Imports 1st qrt. 2002 - 1st qrt. 2009 Chart 54: US Oil Imports 1st qrt. 2002 - 1st qrt. 2009 Chart 55: OECD Europe Oil Imports 1st qrt. 2002 - 1st qrt. 2009 34.0 13.0 14.0 33.5 12.5 13.5 33.0 12.0 32.5 Million barrels per day 13.0 11.5 32.0 31.5 11.0 12.5 31.0 10.5 12.0 30.5 10.0 30.0 Liquids (IEA) 11.5 Liquids (IEA) Liquids (IEA) 9.5 29.5 29.0 9.0 11.0 2002 2003 2004 2005 2006 2007 2008 2002 2003 2004 2005 2006 2007 2008 2002 2003 2004 2005 2006 2007 2008 Source: International Energy Agency Source: International Energy Agency Source: International Energy Agency Page 19