Assymetries in core_collapse_supernovae_from_maps_of_radioactive_ti_in_cassiopeia_a
•
1 recomendación•1,155 vistas

![RESEARCH LETTER
10
2.5 × 10⁻⁴
1
2 × 10⁻⁴
Spectrum (counts s–1 keV–1)
1.5 × 10⁻⁴
0.1
10–4
5 × 10⁻⁵
0.01
0
40
50
60
70
80
10–3
10–4
10–5
20
30
40
50
60
70
Energy (keV)
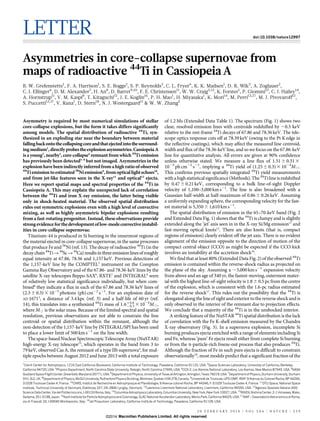
Fe is produced in close physical proximity to the 44Ti. Some correlation
would therefore be expected. The simplest explanation for the lack of
correlation is that much of the Fe-rich ejecta have not yet been penetrated by the reverse shock and therefore do not radiate in the X-ray
band. Whereas X-rays from 44Ti decay are produced by a nuclear
transition and directly trace the distribution of synthesized material,
the Fe X-ray emission results from an atomic transition and traces the
(mathematical) product of the Fe density and the density of shockheated electrons; without the hot electrons, the Fe will not be visible in
the X-rays. A possible explanation of our observations is that the bulk
of the Fe ejecta in Cas A have not yet been shock-heated, further
constraining models18–20 of the remnant as well as the total amount
5′
Figure 1 | The broadband hard-X-ray spectrum
of Cas A. Data from both telescopes over all
epochs are combined and shown as black data
points with 1s error bars. The spectra are shown
combined and rebinned for plotting purposes only.
Also shown are the best-fit continuum models for
a power law (blue) and a model that describes
electron cooling due to synchrotron losses (red).
The continuum fits were obtained using the
10–60-keV data and extrapolated to 79 keV with
the best-fit values for the continuum models
provided in Extended Data Table 2, although the
choice of continuum model does not significantly
affect the measurement of the lines (Methods).
When the continuum is extrapolated to 79 keV,
clearly visible line features (Extended Data Fig. 5)
appear near the 44Ti line energies. Inset: zoomed
region around the 44Ti lines showing the data and
the two models on a linear scale. The vertical green
lines are the rest-frame energies of the 44Ti lines
(67.86 and 78.36 keV). A significant shift of
,0.5 keV to lower energy is evident for both lines,
indicating a bulk line-of-sight velocity away from
the observer. Details of the data analysis, including
a discussion of the NuSTAR background features
(Extended Data Fig. 4), are given in Methods.
Extended Data Table 3 lists the parameters of the
best-fit Gaussian models of these features with
the error estimates described in Methods.
of Fe. An alternative explanation is that most of the Fe is already
shocked and visible, and that some mechanism decouples the production of 44Ti and Fe and produces the observed uncorrelated spatial map.
Unshocked or cool, dense material (material that either was never
heated or has already cooled after being shock-heated) might still be
visible in the optical or infrared spectral band. The Spitzer space telescope observes line emission from interior ejecta primarily in [Si II] but
it seems that there is not a significant amount of Fe present in these
regions21. However, if unshocked ejecta are of sufficiently low density
or have the wrong ionization states, then they will be invisible in the
infrared and optical. Low-density Fe-rich regions may in fact exist
interior to the reverse-shock radius as a result of inflation of the emitting material by radioactivity (the ‘nickel bubble’ effect22).
The concentration of Fe-rich ejecta inferred from maps in X-ray
atomic transitions is well outside the region where it is synthesized, and
not in the centre of the remnant interior to the reverse shock. This
observation has been used to suggest the operation of a strong instability similar to that proposed for SN 1993J23. The presence of a significant fraction of the 44Ti interior to the reverse shock and the implied
presence of interior ‘invisible’ iron requires this conclusion be revisited.
Figure 2 | A comparison of the spatial distribution of the 44Ti with the
known jet structure in Cas A. The image is oriented in standard astronomical
coordinates as shown by the compass in the lower left and spans just over 59 on
a side. The 44Ti observed by NuSTAR is shown in blue, where the data have
been smoothed using a top-hat function with a radius shown in the lower right
(dashed circle). The 44Ti is clearly resolved into distinct knots and is nonuniformly distributed and almost entirely contained within the central 10099
(Methods and Extended Data Fig. 2). Shown for context in green is the Chandra
ratio image of the Si/Mg band (data courtesy of NASA/CXC; Si/Mg ratio image
courtesy of J. Vink), which highlights the jet–counterjet structure, the centre
of the expansion of the explosion2 (yellow cross) and the direction of motion of
the compact object (white arrow). In contrast to the bipolar feature seen in the
spatial distribution of Si ejecta, which argues for fast rotation or a jet-like
explosion, the distribution of 44Ti is much less elongated and contains knots of
emission away from the jet axis. A reason for this may be that the Si originates in
the outer stellar layers and is probably highly influenced by asymmetries in the
circumstellar medium, unlike the 44Ti, which is produced in the innermost
layers near the collapsing core.
N
E
3 4 0 | N AT U R E | VO L 5 0 6 | 2 0 F E B R U A RY 2 0 1 4
©2014 Macmillan Publishers Limited. All rights reserved](data:image/gif;base64,R0lGODlhAQABAIAAAAAAAP///yH5BAEAAAAALAAAAAABAAEAAAIBRAA7)
Recomendados
Recomendados
Más contenido relacionado
La actualidad más candente
La actualidad más candente (20)
Destacado
Destacado (8)
Similar a Assymetries in core_collapse_supernovae_from_maps_of_radioactive_ti_in_cassiopeia_a
Similar a Assymetries in core_collapse_supernovae_from_maps_of_radioactive_ti_in_cassiopeia_a (20)
Más de Sérgio Sacani
Más de Sérgio Sacani (20)
Último
Último (20)
Assymetries in core_collapse_supernovae_from_maps_of_radioactive_ti_in_cassiopeia_a
- 1. LETTER doi:10.1038/nature12997 Asymmetries in core-collapse supernovae from maps of radioactive 44Ti in Cassiopeia A B. W. Grefenstette1, F. A. Harrison1, S. E. Boggs2, S. P. Reynolds3, C. L. Fryer4, K. K. Madsen1, D. R. Wik5, A. Zoglauer2, C. I. Ellinger6, D. M. Alexander7, H. An8, D. Barret9,10, F. E. Christensen11, W. W. Craig2,12, K. Forster1, P. Giommi13, C. J. Hailey14, A. Hornstrup11, V. M. Kaspi8, T. Kitaguchi15, J. E. Koglin16, P. H. Mao1, H. Miyasaka1, K. Mori14, M. Perri13,17, M. J. Pivovaroff12, S. Puccetti13,17, V. Rana1, D. Stern18, N. J. Westergaard11 & W. W. Zhang5 Asymmetry is required by most numerical simulations of stellar core-collapse explosions, but the form it takes differs significantly among models. The spatial distribution of radioactive 44Ti, synthesized in an exploding star near the boundary between material falling back onto the collapsing core and that ejected into the surrounding medium1, directly probes the explosion asymmetries. Cassiopeia A is a young2, nearby3, core-collapse4 remnant from which 44Ti emission has previously been detected5–8 but not imaged. Asymmetries in the explosion have been indirectly inferred from a high ratio of observed 44 Ti emission to estimated 56Ni emission9, from optical light echoes10, and from jet-like features seen in the X-ray11 and optical12 ejecta. Here we report spatial maps and spectral properties of the 44Ti in Cassiopeia A. This may explain the unexpected lack of correlation between the 44Ti and iron X-ray emission, the latter being visible only in shock-heated material. The observed spatial distribution rules out symmetric explosions even with a high level of convective mixing, as well as highly asymmetric bipolar explosions resulting from a fast-rotating progenitor. Instead, these observations provide strong evidence for the development of low-mode convective instabilities in core-collapse supernovae. Titanium-44 is produced in Si burning in the innermost regions of the material ejected in core-collapse supernovae, in the same processes that produce Fe and 56Ni (ref. 13). The decay of radioactive 44Ti (in the decay chain 44Ti R 44Sc R 44Ca) results in three emission lines of roughly equal intensity at 67.86, 78.36 and 1,157 keV. Previous detections of the 1,157-keV line by the COMPTEL5 instrument on the Compton Gamma Ray Observatory and of the 67.86- and 78.36-keV lines by the satellite X-ray telescopes Beppo-SAX6, RXTE7 and INTEGRAL8 were of relatively low statistical significance individually, but when combined8 they indicate a flux in each of the 67.86 and 78.36 keV lines of (2.3 6 0.3) 3 1025 photons (ph) cm22 s21. For an explosion date of 2 AD 1671 , a distance of 3.4 kpc (ref. 3) and a half-life of 60 yr (ref. 14), this translates into a synthesized 44Ti mass of 1:6z0:6 3 1024M[, {0:3 where M[ is the solar mass. Because of the limited spectral and spatial resolution, previous observations are not able to constrain the line centroid or spatial distribution within the remnant, although the non-detection of the 1,157-keV line by INTEGRAL/SPI has been used to place a lower limit of 500 km s21 on the line width. The space-based Nuclear Spectroscopic Telescope Array (NuSTAR) high-energy X-ray telescope15, which operates in the band from 3 to 79 keV, observed Cas A, the remnant of a type IIb supernova4, for multiple epochs between August 2012 and June 2013 with a total exposure of 1.2 Ms (Extended Data Table 1). The spectrum (Fig. 1) shows two clear, resolved emission lines with centroids redshifted by ,0.5 keV relative to the rest-frame 44Ti decays of 67.86 and 78.36 keV. The telescope optics response cuts off at 78.39 keV (owing to the Pt K edge in the reflective coatings), which may affect the measured line centroid, width and flux of the 78.36-keV line, and so we focus on the 67.86-keV line for quantitative analysis. All errors are given at 90% confidence unless otherwise stated. We measure a line flux of 1.51 6 0.31 3 1025 ph cm22 s21, implying a 44Ti yield of (1.25 6 0.3) 3 1024M[. This confirms previous spatially integrated 44Ti yield measurements with a high statistical significance (Methods). The 44Ti line is redshifted by 0.47 6 0.21 keV, corresponding to a bulk line-of-sight Doppler velocity of 1,100–3,000 km s21. The line is also broadened with a Gaussian half-width at half-maximum of 0.86 6 0.26 keV. Assuming a uniformly expanding sphere, the corresponding velocity for the fastest material is 5,350 6 1,610 km s21. The spatial distribution of emission in the 65–70-keV band (Fig. 2 and Extended Data Fig. 1) shows that the 44Ti is clumpy and is slightly extended along the ‘jet’ axis seen in in the X-ray Si/Mg emission11 and fast-moving optical knots12. There are also knots (that is, compact regions of emission) clearly evident off the jet axis. There is no evident alignment of the emission opposite to the direction of motion of the compact central object (CCO) as might be expected if the CCO kick involves an instability at the accretion shock16. We find that at least 80% (Extended Data Fig. 2) of the observed 44Ti emission is contained within the reverse-shock radius as projected on the plane of the sky. Assuming a ,5,000 km s21 expansion velocity from above and an age of 340 yr, the fastest-moving, outermost material with the highest line-of-sight velocity is 1.8 6 0.5 pc from the centre of the explosion, which is consistent with the 1.6-pc radius estimated for the reverse shock17. This rules out the possibility that the 44Ti is elongated along the line of sight and exterior to the reverse shock and is only observed in the interior of the remnant due to projection effects. We conclude that a majority of the 44Ti is in the unshocked interior. A striking feature of the NuSTAR 44Ti spatial distribution is the lack of correlation with the Fe K-shell emission measured by the Chandra X-ray observatory (Fig. 3). In a supernova explosion, incomplete Si burning produces ejecta enriched with a range of elements including Si and Fe, whereas ‘pure’ Fe ejecta result either from complete Si burning or from the a-particle-rich freeze-out process that also produces 44Ti. Although the fraction of Fe in such pure ejecta is difficult to constrain observationally18, most models predict that a significant fraction of the 1 Cahill Center for Astrophysics, 1216 East California Boulevard, California Institute of Technology, Pasadena, California 91125, USA. 2Space Sciences Laboratory, University of California, Berkeley, California 94720, USA. 3Physics Department, North Carolina State University, Raleigh, North Carolina 27695, USA. 4CCS-2, Los Alamos National Laboratory, Los Alamos, New Mexico 87545, USA. 5NASA Goddard Space Flight Center, Greenbelt, Maryland 20771, USA. 6Department of Physics, University of Texas at Arlington, Arlington, Texas 76019, USA. 7Department of Physics, Durham University, Durham ´ DH1 3LE, UK. 8Department of Physics, McGill University, Rutherford Physics Building, Montreal, Quebec H3A 2T8, Canada. 9Universite de Toulouse, UPS-OMP, IRAP, 9 Avenue du Colonel Roche, BP 44346, ´ 31028 Toulouse Cedex 4, France. 10CNRS, Institut de Recherche en Astrophysique et Planetologie, 9 Avenue colonel Roche, BP 44346, F-31028 Toulouse Cedex 4, France. 11DTU Space, National Space Institute, Technical University of Denmark, Elektrovej 327, DK-2800 Lyngby, Denmark. 12Lawrence Livermore National Laboratory, Livermore, California 94550, USA. 13Agenzia Spaziale Italiana (ASI) Science Data Center, Via del Politecnico snc, I-00133 Roma, Italy. 14Columbia Astrophysics Laboratory, Columbia University, New York, New York 10027, USA. 15RIKEN, Nishina Center, 2-1 Hirosawa, Wako, Saitama, 351-0198, Japan. 16Kavli Institute for Particle Astrophysics and Cosmology, SLAC National Accelerator Laboratory, Menlo Park, California 94025, USA. 17INAF – Osservatorio Astronomico di Roma, via di Frascati 33, I-00040 Monteporzio, Italy. 18Jet Propulsion Laboratory, California Institute of Technology, Pasadena, California 91109, USA. 2 0 F E B R U A RY 2 0 1 4 | VO L 5 0 6 | N AT U R E | 3 3 9 ©2014 Macmillan Publishers Limited. All rights reserved
- 2. RESEARCH LETTER 10 2.5 × 10⁻⁴ 1 2 × 10⁻⁴ Spectrum (counts s–1 keV–1) 1.5 × 10⁻⁴ 0.1 10–4 5 × 10⁻⁵ 0.01 0 40 50 60 70 80 10–3 10–4 10–5 20 30 40 50 60 70 Energy (keV) Fe is produced in close physical proximity to the 44Ti. Some correlation would therefore be expected. The simplest explanation for the lack of correlation is that much of the Fe-rich ejecta have not yet been penetrated by the reverse shock and therefore do not radiate in the X-ray band. Whereas X-rays from 44Ti decay are produced by a nuclear transition and directly trace the distribution of synthesized material, the Fe X-ray emission results from an atomic transition and traces the (mathematical) product of the Fe density and the density of shockheated electrons; without the hot electrons, the Fe will not be visible in the X-rays. A possible explanation of our observations is that the bulk of the Fe ejecta in Cas A have not yet been shock-heated, further constraining models18–20 of the remnant as well as the total amount 5′ Figure 1 | The broadband hard-X-ray spectrum of Cas A. Data from both telescopes over all epochs are combined and shown as black data points with 1s error bars. The spectra are shown combined and rebinned for plotting purposes only. Also shown are the best-fit continuum models for a power law (blue) and a model that describes electron cooling due to synchrotron losses (red). The continuum fits were obtained using the 10–60-keV data and extrapolated to 79 keV with the best-fit values for the continuum models provided in Extended Data Table 2, although the choice of continuum model does not significantly affect the measurement of the lines (Methods). When the continuum is extrapolated to 79 keV, clearly visible line features (Extended Data Fig. 5) appear near the 44Ti line energies. Inset: zoomed region around the 44Ti lines showing the data and the two models on a linear scale. The vertical green lines are the rest-frame energies of the 44Ti lines (67.86 and 78.36 keV). A significant shift of ,0.5 keV to lower energy is evident for both lines, indicating a bulk line-of-sight velocity away from the observer. Details of the data analysis, including a discussion of the NuSTAR background features (Extended Data Fig. 4), are given in Methods. Extended Data Table 3 lists the parameters of the best-fit Gaussian models of these features with the error estimates described in Methods. of Fe. An alternative explanation is that most of the Fe is already shocked and visible, and that some mechanism decouples the production of 44Ti and Fe and produces the observed uncorrelated spatial map. Unshocked or cool, dense material (material that either was never heated or has already cooled after being shock-heated) might still be visible in the optical or infrared spectral band. The Spitzer space telescope observes line emission from interior ejecta primarily in [Si II] but it seems that there is not a significant amount of Fe present in these regions21. However, if unshocked ejecta are of sufficiently low density or have the wrong ionization states, then they will be invisible in the infrared and optical. Low-density Fe-rich regions may in fact exist interior to the reverse-shock radius as a result of inflation of the emitting material by radioactivity (the ‘nickel bubble’ effect22). The concentration of Fe-rich ejecta inferred from maps in X-ray atomic transitions is well outside the region where it is synthesized, and not in the centre of the remnant interior to the reverse shock. This observation has been used to suggest the operation of a strong instability similar to that proposed for SN 1993J23. The presence of a significant fraction of the 44Ti interior to the reverse shock and the implied presence of interior ‘invisible’ iron requires this conclusion be revisited. Figure 2 | A comparison of the spatial distribution of the 44Ti with the known jet structure in Cas A. The image is oriented in standard astronomical coordinates as shown by the compass in the lower left and spans just over 59 on a side. The 44Ti observed by NuSTAR is shown in blue, where the data have been smoothed using a top-hat function with a radius shown in the lower right (dashed circle). The 44Ti is clearly resolved into distinct knots and is nonuniformly distributed and almost entirely contained within the central 10099 (Methods and Extended Data Fig. 2). Shown for context in green is the Chandra ratio image of the Si/Mg band (data courtesy of NASA/CXC; Si/Mg ratio image courtesy of J. Vink), which highlights the jet–counterjet structure, the centre of the expansion of the explosion2 (yellow cross) and the direction of motion of the compact object (white arrow). In contrast to the bipolar feature seen in the spatial distribution of Si ejecta, which argues for fast rotation or a jet-like explosion, the distribution of 44Ti is much less elongated and contains knots of emission away from the jet axis. A reason for this may be that the Si originates in the outer stellar layers and is probably highly influenced by asymmetries in the circumstellar medium, unlike the 44Ti, which is produced in the innermost layers near the collapsing core. N E 3 4 0 | N AT U R E | VO L 5 0 6 | 2 0 F E B R U A RY 2 0 1 4 ©2014 Macmillan Publishers Limited. All rights reserved
- 3. LETTER RESEARCH in the Cas A remnant. We simulate two explosions that represent the extremes of explosion asymmetry: a spherically symmetric explosion, and an explosion representing a fast-rotating progenitor with artificially induced bipolar asymmetry where the explosion velocity in a 30u half-angle cone near the rotation axis is increased by a factor of four relative to the rest of the ejecta. The simulated 44Ti maps (Extended Data Fig. 3) indicate that the level of observed non-uniformity in Cas A is far greater than what can be produced by the spherically symmetric explosion, and that the bipolar explosion (where the bulk of the fast 44 Ti remains within 30u of the rotation axis) cannot reproduce the observed off-axis 44Ti knots. This argues against fast-rotating progenitors as well as jet-like explosions, which are even more collimated than the bipolar explosions. The supernova is better described by an intermediate case, where the observed non-uniformity in the 44Ti is the result of a multimodal explosion such as those predicted in both low-mode Rayleigh–Taylor models29 and models including the standing accretion shock instability30. The Cas A remnant provides the first strong evidence that this low-mode convection must occur. METHODS SUMMARY A full description of the methods, including data analysis, background modelling, error estimates, and supernovae simulations can be found in Methods. Online Content Any additional Methods, Extended Data display items and Source Data are available in the online version of the paper; references unique to these sections appear only in the online paper. Figure 3 | A comparison of the spatial distribution of 44Ti with known Fe K-shell emission in Cas A. We reproduce the spatial distributions shown in Fig. 2 and add the 4–6-keV continuum emission (white) and the spatial distribution of X-ray-bright Fe (red) seen by Chandra (Fe distribution courtesy of U. Hwang). We find that the 44Ti does not follow the distribution of Fe K-shell X-ray emission, suggesting either that a significant amount of Fe remains unshocked and therefore does not radiate in the X-ray, or that the Fe/Ti ratio in the ejecta deviates from the expectation of standard nucleosynthesis models. Received 27 August; accepted 13 December 2013. 1. 2. 3. 4. The measured 44Ti line widths and distribution can directly constrain mixing in the supernova engine. As evidenced by SN 1987A, mixing due to Rayleigh–Taylor instabilities occurring between the explosion’s forward and reverse shocks (distinct from the remnant’s forward and reverse shocks) may be important in some types of supernova explosion24. Because 44Ti is a good spatial tracer of 56Ni in all established supernova models, we can compare the measured velocity width to that predicted for 56Ni by simulations. We find that the ,5,000 km s21 maximum velocity and the level of Doppler line broadening compares well with type IIb models including mixing25 and excludes models without the growth of large instabilities. The evidence for asymmetries in the supernova explosion mechanism has grown steadily over the past several decades. Asymmetries are implied by a number of observations26: the extensive mixing implied in nearby supernovae (for example SN 1987A), the high space velocities of neutron stars and the polarization of supernova emission. Although different external processes could separately explain each of these observations, it is generally assumed that the asymmetries arise in the explosion mechanism. A number of mechanisms have been proposed within the framework where the supernova engine is convectively enhanced27: asymmetric collapse, asymmetries caused by rotation and asymmetries caused by low-mode convection. Of these, rotation and low-mode convection have received the most attention. Rotation tends to produce bipolar explosions along the rotation axis where the ejecta velocities are two to four times greater along this axis28 than in the rest of the ejecta. Low-mode convection, including the standing accretion shock instability, will produce a bipolar explosion in fast-rotating stars, but is likely to produce higher-order modes in slowly rotating systems29. To improve our understanding of the nature of the observed 44Ti non-uniformity, we compare the observations with three-dimensional models of normal core-collapse supernovae using a progenitor designed to produce the high 44Ti/56Ni ratio needed to match the estimated yields 5. 6. 7. 8. 9. 10. 11. 12. 13. 14. 15. 16. 17. 18. 19. 20. 21. 22. 23. Magkotsios, G. et al. Trends in 44Ti and 56Ni from core-collapse supernovae. Astrophys. J. Suppl. Ser. 191, 66–95 (2010). Thorstensen, J. R., Fesen, R. A. & van den Bergh, S. The expansion center and dynamical age of the galactic supernova remnant Cassiopeia A. Astrophys. J. 122, 297–307 (2001). Reed, J. E., Hester, J. J., Fabian, A. C. & Winkler, P. F. The three-dimensional structure of the Cassiopeia A supernova remnant. I. The spherical shell. Astrophys. J. 440, 706–721 (1995). Krause, O. et al. The Cassiopeia A supernova was of type IIb. Science 320, 1195–1197 (2008). Iyudin, A. F. et al. COMPTEL observations of Ti-44 gamma-ray line emission from Cas A. Astron. Astrophys. 284, L1–L4 (1994). Vink, J. et al. Detection of the 67.9 and 78.4 keV lines associated with the radioactive decay of 44Ti in Cassiopeia A. Astrophys. J. 560, L79–L82 (2001). Rothschild, R. E. & Lingenfelter, R. E. Limits to the Cassiopeia A 44Ti line flux and constraints on the ejecta energy and the compact source. Astrophys. J. 582, 257–261 (2003). Renaud, M. et al. The signature of 44Ti in Cassiopeia A revealed by IBIS/ISGRI on INTEGRAL. Astrophys. J. 647, L41–L44 (2006). Nagataki, S., Hashimoto, M.-a., Sato, K., Yamada, S. & Mochizuki, Y. S. The high ratio of 44Ti/56Ni in Cassiopeia A and the axisymmetric collapse-driven supernova explosion. Astrophys. J. 492, L45–L48 (1998). Rest, A. et al. Direct confirmation of the asymmetry of the Cas A supernova with light echoes. Astrophys. J. 732, 3 (2011). Hwang, U. et al. A million second Chandra view of Cassiopeia A. Astrophys. J. 615, L117–L120 (2004). Fesen, R. A. et al. The expansion asymmetry and age of the Cassiopeia A supernova remnant. Astrophys. J. 645, 283–292 (2006). Woosley, S. E. & Weaver, T. A. The evolution and explosion of massive stars. II. Explosive hydrodynamics and nucleosynthesis. Astrophys. J. Suppl. Ser. 101, 181–235 (1995). Ahmad, I. et al. Improved measurement of the 44Ti half-life from a 14-year long study. Phys. Rev. C 74, 065803 (2006). Harrison, F. A. et al. The Nuclear Spectroscopic Telescope ARray (NuSTAR) highenergy X-ray mission. Astrophys. J. 770, 103 (2013). ¨ Wongwathanarat, A., Janka, H.-T. & Muller, E. Hydrodynamical neutron star kicks in three dimensions. Astrophys. J. 725, L106–L110 (2010). Gotthelf, E. V. et al. Chandra detection of the forward and reverse shocks in Cassiopeia A. Astrophys. J. 552, L39–L43 (2001). Hwang, U. & Laming, J. M. A. Chandra X-ray survey of ejecta in the Cassiopeia A supernova remnant. Astrophys. J. 746, 130 (2012). Chevalier, R. A. & Oishi, J. Cassiopeia A and its clumpy presupernova wind. Astrophys. J. 593, L23–L26 (2003). Hwang, U. & Laming, J. M. Where was the iron synthesized in Cassiopeia A? Astrophys. J. 597, 362–373 (2003). Isensee, K. et al. The three-dimensional structure of interior ejecta in Cassiopeia A at high spectral resolution. Astrophys. J. 725, 2059–2070 (2010). Li, H., McCray, R. & Sunyaev, R. A. Iron, cobalt, and nickel in SN 1987A. Astrophys. J. 419, 824–836 (1993). Shigeyama, T. et al. Theoretical light curves of Type IIb supernova 1993J. Astrophys. J. 420, 341–347 (1994). 2 0 F E B R U A RY 2 0 1 4 | VO L 5 0 6 | N AT U R E | 3 4 1 ©2014 Macmillan Publishers Limited. All rights reserved
- 4. RESEARCH LETTER 24. Hachisu, I., Matsuda, T., Nomoto, K. i. & Shigeyama, T. Nonlinear growth of Rayleigh-Taylor instabilities and mixing in SN 1987A. Astrophys. J. 358, L57–L61 (1990). 25. Nomoto, K. i., Iwamoto, K. & Suzuki, T. The evolution and explosion of massive binary stars and Type Ib-Ic-IIb-IIL supernovae. Phys. Rep. 256, 173–191 (1995). 26. Hungerford, A. L., Fryer, C. L. & Warren, M. S. Gamma-ray lines from asymmetric supernovae. Astrophys. J. 594, 390–403 (2003). 27. Janka, H.-T. Explosion mechanisms of core-collapse supernovae. Annu. Rev. Nucl. Part. Sci. 62, 407–451 (2012). 28. Fryer, C. L. & Heger, A. Core-collapse simulations of rotating stars. Astrophys. J. 541, 1033–1050 (2000). 29. Fryer, C. L. & Young, P. A. Late-time convection in the collapse of a 23 M[ star. Astrophys. J. 659, 1438–1448 (2007). 30. Blondin, J. M., Mezzacappa, A. & DeMarino, C. Stability of standing accretion shocks, with an eye toward core-collapse supernovae. Astrophys. J. 584, 971–980 (2003). Author Contributions B.W.G.: reduction and modelling of the NuSTAR Cas A observations, interpretation, manuscript preparation. F.A.H.: NuSTAR principal investigator, observation planning, interpretation of results and manuscript preparation. S.E.B.: interpretation, manuscript review. S.P.R.: interpretation, manuscript preparation and review. C.L.F.: interpretation of results, manuscript review. K.K.M.: observation planning, data analysis, manuscript review. D.R.W.: background modelling, data analysis, manuscript review. A.Z.: background modelling, manuscript review. C.I.E.: supernova simulations, manuscript review. H.A.: image deconvolution, manuscript review. T.K.: detector modelling, data analysis, manuscript review. H.M., V.R., P.H.M.: detector production, response modelling, manuscript review. M.J.P.: optics calibration, manuscript review. S.P., M.P.: analysis software, calibration, manuscript review. K.F.: observation planning. F.E.C.: optics production and calibration, manuscript review. W.W.C.: optics and instrument production and response, observation planning, manuscript review. C.J.H.: optics production and response, interpretation, manuscript review. J.E.K.: optics production and response, manuscript review. N.J.W.: manuscript review, calibration. W.W.Z.: optics production and response, manuscript review. D.M.A., D.B., P.G., A.H., V.M.K., D.S.: science planning, manuscript review. Acknowledgements This work was supported by NASA under grant no. NNG08FD60C, and made use of data from the Nuclear Spectroscopic Telescope Array (NuSTAR) mission, a project led by Caltech, managed by the Jet Propulsion Laboratory and funded by NASA. We thank the NuSTAR operations, software and calibration teams for support with execution and analysis of these observations. Author Information Reprints and permissions information is available at www.nature.com/reprints. The authors declare no competing financial interests. Readers are welcome to comment on the online version of the paper. Correspondence and requests for materials should be addressed to B.W.G. (bwgref@srl.caltech.edu) or F.A.H. (fiona@srl.caltech.edu). 3 4 2 | N AT U R E | VO L 5 0 6 | 2 0 F E B R U A RY 2 0 1 4 ©2014 Macmillan Publishers Limited. All rights reserved
- 5. LETTER RESEARCH METHODS Observations and preliminary data reduction. Cas A was observed by NuSTAR during August and November of 2012 and March and June of 2013 for a total of over 1.2 Ms of exposure (Extended Data Table 1). We reduced the NuSTAR data with the NuSTAR data analysis software (NuSTARDAS) version 1.2.0 and NuSTAR CALDB version 20130509. The NuSTARDAS pipeline software and associated CALDB files are fully HEASARC ftool compatible and are written and maintained jointly by the ASI Science Data Center (ASDC, Italy) and the NuSTAR Science Operations Center (SOC, USA). The NuSTARDAS pipeline generates good time intervals, which are time ranges for each observation that exclude periods when the source is occulted by the Earth and when the satellite is transiting the South Atlantic anomaly, which is a region of high particle background. The default ‘depth cut’ is applied to reduce the internal background at high energies. Background estimation and modelling. Cas A is a bright, extended source, and so there are no regions in the field of view of the telescope that can be used to estimate directly the background in the source region. Instead we model the background and produce background images and spectra. The NuSTAR background is well described by a non-focused cosmic X-ray background (CXB) component, which dominates at low energies (,20 keV), a focused CXB component and an internal background, composed of a continuum along with many lines due to radioactive decay in the instrument and fluorescence from the CsI shield, which dominates at higher energies31 (.20 keV). Long NuSTAR deep-field observations from the Extended Chandra Deep Field South and Cosmological Evolution Survey observations were used to determine the spatial variation of the CXB across each focal plane and the relative strength of the internal background for each detector. Typically, background regions free from source counts are used to determine the normalization of the CXB components and the internal background component (including the relative strengths of the internal background lines that may show some long-term variation related to activation in the instrument and spacecraft). We use the normalizations of the various components to produce background images and to predict the background spectrum anywhere on the detector (for example in the source region). In the case of Cas A, we add an additional phenomenological model to account for the redistribution of source counts into the background regions via the wings of the point spread function (Extended Data Fig. 4). Background spectra are generated for the source region for each observation epoch (excluding the contribution from the phenomenological model) using the fakeit command in XSPEC with the exposure set to be the same as for the source exposure. This results in a Poisson-distributed realization of the background spectrum in the source region for each observation. We address the implications of this below. Background images are produced for the 65–70-keV band using the normalization of the internal background (the CXB is negligible in this band) and the known detector-to-detector amplitude variation. The background images produced by our model account for spatial variations in diffuse components as well as focal plane efficiency variations. We combine the background images, weighting them by the effective exposure. There is both Pt and W in the multilayer coatings on the optics, which could give rise to a source-dependent fluorescence lines near the 44Ti lines for sources with spectra that extend above the Pt K edge. However, we do not see fluorescence lines appearing in the spectra of targets used for the calibration of the optics, such as bright X-ray binaries or the Crab Nebula. We infer that any fluorescence from the multilayer coatings is too diffuse to observe. Spatial distribution of the 44Ti in Cas A. To generate the significance maps, we convolve the mosaicked counts image and the accompanying background image with a top-hat function of radius 2099 (8 image pixels). We calculate the probability of detecting the observed number of counts or higher from a Poisson fluctuation in the background. A region containing source counts would then have a low Poisson probability of being a random fluctuation in the background32. For the Cas A 44Ti image, we generate contours at probability levels of 2.7 3 1023 and 6.3 3 1025, corresponding to background fluctuations of 3s and 4s (Extended Data Fig. 1). In the 65–70-keV band, we find 5,721 counts interior to 15099, whereas our background model predicts 4,780 counts. This constitutes a 13.6s deviation from the expected background, constituting a highly significant detection. However, this detection cannot distinguish between any continuum or line contribution over this band. The significance of the line is discussed below. To estimate the radial distribution of the 44Ti, we compute the number of counts contained in annuli with successively larger radii measured from the optical centre of the remnant33 (right ascension, 23 h 23 min 27.77 s; declination, 1586 489 49.499; J2000), hereafter referred to as the centre of the remnant. We do the same operation with the background images to determine the expected background. After subtracting the background, we find that more than 80% of the enclosed flux lies within 10099 of the centre of the remnant (Extended Data Fig. 2). The effects of the optics point spread function and the vignetting (the loss of effective area as a function of off-axis angle in the optics) on the radial distribution are not included here. Both of these effects depend on the (unknown) intrinsic source distribution, but neither should be strong enough to alter the statement that a majority of the photons are found inside 10099. Spectroscopy. We extracted a 12099-radius region centred on the optical centre of Cas A. We extracted source spectra, ARFs and RMFs for each observation using the nuproducts FTOOL with the ‘extended source’ option. All ten spectra (five epochs and two focal plane modules (FPMs)) were simultaneously fitted in XSPEC. Because of the low number of source counts, we use the ‘W-stat’ as the fit statistic in XSPEC and Pearson’s x2 as the test statistic. The background subtraction method is described below. Previous hard-X-ray observations of Cas A have shown that the hard-X-ray continuum can be described either by the ‘powerlaw’ or ‘srcut’ standard spectral model in XSPEC. We make a slight modification to the standard srcut model to account for the softer radio-frequency photon index found in Cas A (0.77 (ref. 34) compared with 0.5, which is typical for srcut). A detailed analysis of the underlying hard-X-ray continuum is beyond the scope of this paper and will be addressed in future work, but here we must determine how the choice of continuum model affects the estimates of the 44Ti lines. To do this, we first fit both models to the spectra over a 15–60-keV band pass. In this range, the Poisson fluctuations of the background are negligible, and so we use a single realization of the background spectrum. To compare the continuum models, we use the ‘goodness’ command in XSPEC to generate 1,000 realizations of the model parameters based on the covariance matrix and compute the test statistic for each of these model realizations. On average, 50% of the model realizations should produce test statistic values greater than the best-fit test statistic value. If many (more than 50%) of the simulated spectra produce fits with test statistic values less than our best-fit model, then we may reject the model. Because we are not attempting a physically motivated model, but rather a good description of the continuum, we do not constrain the srcut normalization (which is given in flux at 1 GHz, typically constrained from radio observations). However, for completeness we also include a constrained srcut model with the normalization at 1 GHz fixed to be 2,720 Jy to match the value used by previous authors35. This value is the 1-GHz flux at epoch 197734, although the decay rate of Cas A’s 1-GHz flux, of 0.6% to 0.7% per year36, gives a 1-GHz flux in 2013 of about 2,300 Jy. The best-fit continuum parameters are given in Extended Data Table 2. The power-law model is a good fit to the continuum data and produces a better fit than 50% of the realizations, whereas the best-fit srcut model provides a better fit than only 10% of the realizations. This suggests that we should reject the srcut model. The constrained srcut model is rejected for similar reasons, and so we do not include either of these continuum models in our analysis below. A detailed analysis of the continuum models and their spatial dependence will be undertaken in a subsequent paper. To fit the line parameters, we extend the fit range to 79 keV and observe significant spectral features where we expect the 44Ti lines (Extended Data Fig. 5). We add two emission lines to the continuum model using the ‘gauss’ XSPEC model. This roughly corresponds to a spatially uniform, isotropically expanding sphere of ejecta, which we acknowledge may not be the best representation of the actual distribution. Detailed spatially resolved spectroscopy will be performed in future work using additional future observations of Cas A. The 78.36-keV 44Ti X-ray line is near the Pt absorption edge at 78.395 keV in the optics31, making the observed line intensity extremely sensitive to any Doppler shift in the line centroid. To account for possible bias in the fits, we use three test cases: (1) two Gaussian model components with the line widths, redshifts and normalizations tied together; (2) two independent Gaussian model components to data extending to 79 keV; and (3) a single Gaussian model to the 68-keV line, ignoring the counts above 72 keV. We discuss these three cases below. As stated above, our background models are limited by Poisson statistics. If the background were featureless (that is, a smooth continuum) over this region, this would not affect our line fits. However, because of the background line structure near 65, 67, and 75 keV (Extended Data Fig. 4, inset), Poisson fluctuations in the background can affect the best-fit parameters of the line shape, centroid and flux. We marginalize over this effect by generating 1,000 realizations of the background for each FPM and for each epoch and finding the best-fit continuum and line parameters. We estimate our measurement and the uncertainty in the measurement as follows. The distributions of fits over the 1,000 background realizations describe the variation of best-fit parameters due to Poisson background fluctuations, and so we take the mean value of each distribution to be the best estimate of the parameter. For each background realization, our ability to constrain each parameter is derived by traversing x2 (or C-stat in this case) space by varying the fit parameters according to the covariance matrix, which is driven by the uncertainties in the ©2014 Macmillan Publishers Limited. All rights reserved
- 6. RESEARCH LETTER Poisson-distributed source and background spectra. We adopt the mean 90% ‘fit’ errors as the uncertainties on our measurement. Case (1) produces lines that are systematically shifted to lower energy (higher redshift) and higher flux. This points to a mismatch between the estimated effect of the high-energy cut-off estimated in the optics response files and the actual effect of the Pt absorption. Any assumed relation between the lines (that is, fixing their widths, relative centroids or relative fluxes as we have done in case (1)) will be incorrect when compared with the data. Because both case (2) and case (3) produce nearly identical results for the 68-keV line parameters, we choose case (2) as our model of choice in the main text and report only the fit values for the 68-keV line below. Results for all three models are given in Extended Data Table 3 along with the 90% statistical errors. For case (2), this represents an 8s detection. The NuSTAR effective area has a residual uncertainty of ,10% over the 60– 80-keV band pass, which we add in quadrature to our (larger) statistical errors in the summary below. If 44Ti is ionized to He-like states or beyond, the electron-capture rate is reduced and the mean lifetime can increase. However, our image analysis above indicates that most of the 44Ti is within the reverse shock and at low ionization. Even if most of it were already shocked, a detailed calculation37 has shown that the current ionization state is very unlikely to be as high as required for a substantial impact on the lifetime. After combining the statistical and systematic errors, we find a line flux (90% error range) at 68 keV of (1.51 6 0.31) 3 1025 ph s21 cm22, which corresponds to an initial 44Ti synthesized mass of (1.25 6 0.3) 3 1024M[. The line is shifted with respect to its rest-frame energy of 67.86 keV and is observed at 67.39 6 0.21 keV, corresponding to a bulk line-of-sight Doppler velocity of 2,050 6 950 km s21. The line is also broadened with a Gaussian half-width at half-maximum of 0.86 6 0.26 keV. Assuming a uniform sphere, then a half-width at half-maximum divided by 0.71 describes the fastest moving material, and so the width of the line corresponds to a maximum line-of-sight velocity of to 5,350 6 1,650 km s21. We caution, however, that this interpretation is sensitive to the assumptions about the distribution of the ejecta, but this does place reasonable limits on how fast the ejecta could be moving along the line of sight. If we assume a distance of 3.4 kpc and an age of 340 yr, the farthest the ejecta could be along the line of sight is 1.8 6 0.5 pc. If the reverse shock is described by a spherical shell then its 10099 radius translates into a radial extent of 1.6 pc, and so the bulk of the 44Ti is within the reverse shock. Constraints on the supernova engine. One constraint on the explosion engine is the total 44Ti yield. 44Ti is produced in Si burning in the innermost ejecta of corecollapse supernovae38 and the total yield, as well as the 44Ti/56Ni ratio is sensitive to the stellar profile and explosion energy. The 44Ti/56Ni ratio differs for different progenitors and explosion strengths, and although the high value of this ratio suggests asymmetric explosions, it is not a direct probe of the asymmetry. The spatial distribution of the 44Ti is a much stronger tracer of the explosion asymmetry. In general, the 44Ti spatial distribution traces that of 56Ni. However, there are a few basic aspects of 44Ti production that argue that, if anything, 44Ti should be produced farther out and at greater velocities than 56Ni. First, there are high-density conditions (that might occur in the innermost ejecta) where 56Ni is produced and 44Ti is produced at a low rate34, arguing that the 44Ti/56Ni should be lowest in the innermost ejecta. In addition, at low densities, 44Ti can be produced in partial Si burning where the 56Ni yield is low, producing a high 44Ti/56Ni ratio. However, these effects tend to be small in most supernovae, and so we assume in the main text that the 44Ti is a good tracer of the 56Ni yield and that the maps of the Ti distribution can directly constrain the asymmetry in the supernova engine. To compare our 44Ti distributions with explosion models, we ran two simulations of Cas A (using a 23M[ binary progenitor with an explosion energy of 2 3 1051 erg; ref. 39) using the SNSPH code40,41: a symmetric explosion and a bimodal explosion with a fourfold increase along the jet axis to match the expectations of normal rotating models. Extended Data Fig. 3 shows the contour profiles of the 44Ti yield for these two explosions. Although the symmetric simulation includes extensive Rayleigh–Taylor mixing, it is unable to reproduce the observed non-uniformity in the observed 44Ti distribution. Similarly, the off-axis 44Ti argues against the extreme asymmetries produced by both fast-rotating progenitors as well as jet supernova engines for Cas A, and argue for the presence of higher-order modes in the explosion. With the rise of the ‘collapsar’ engine for c-ray bursts42, alternate core-collapse supernova engines invoking jets produced by magnetic fields have also been studied and suggested to explain remnants such as Cas A43,44. These jet-driven explosions produce extreme bimodal asymmetries and are similarly disfavoured by our results. As neither the spherically symmetric nor the strongly asymmetric explosion reproduces all of the observed properties of the 44Ti spatial distribution, the progenitor of the Cas A remnant was most probably between these two extremes: a mildly asymmetric explosion developing low-mode convection. 44 31. Harrison, F. A. et al. The Nuclear Spectroscopic Telescope ARray (NuSTAR) high-energy X-ray mission. Astrophys. J. 770, 103 (2013). 32. Georgakakis, A., Nandra, K., Laird, E. S., Aird, J. & Trichas, M. A new method for determining the sensitivity of X-ray imaging observations and the X-ray number counts. Mon. Not. R. Astron. Soc. 388, 1205–1213 (2008). 33. Thorstensen, J. R., Fesen, R. A. & van den Bergh, S. The expansion center and dynamical age of the galactic supernova remnant Cassiopeia A. Astrophys. J. 122, 297–307 (2001). 34. Baars, J. W. M., Genzel, R., Pauliny-Toth, I. I. K. & Witzel, A. The absolute spectrum of CAS A - an accurate flux density scale and a set of secondary calibrators. Astron. Astrophys. 61, 99–106 (1977). 35. Renaud, M. et al. The signature of 44Ti in Cassiopeia A revealed by IBIS/ISGRI on INTEGRAL. Astrophys. J. 647, L41–L44 (2006). 36. Reichart, D. E. & Stephens, A. W. The fading of supernova remnant Cassiopeia A from 38 MHz to 16.5 GHz from 1949 to 1999 with new observations at 1405 MHz. Astrophys. J. 537, 904–908 (2000). 37. Laming, J. M. in Solar and Galactic Composition (ed. Wimmer-Schweingruber, R. F.) 411–416 (AIP, 2001). 38. Magkotsios, G. et al. Trends in 44Ti and 56Ni from core-collapse supernovae. Astrophys. J. Suppl. Ser. 191, 66–95 (2010). 39. Young, P. A. et al. Constraints on the progenitor of Cassiopeia A. Astrophys. J. 640, 891–900 (2006). 40. Fryer, C. L., Rockefeller, G. & Warren, M. S. SNSPH: a parallel three-dimensional smoothed particle radiation hydrodynamics code. Astrophys. J. 643, 292–305 (2006). 41. Ellinger, C. I., Rockefeller, G., Fryer, C. L., Young, P. A. & Park, S. First simulations of core- collapse supernovae to supernova remnants with SNSPH. Preprint at http:// arxiv.org/abs/1305.4137 (2013). 42. Woosley, S. E. Gamma-ray bursts from stellar mass accretion disks around black holes. Astrophys. J. 405, 273–277 (1993). 43. Laming, J. M., Hwang, U., Radics, B., Lekli, G. & Takacs, E. The polar regions of Cassiopeia A: the aftermath of a gamma-ray burst? Astrophys. J. 644, 260–273 (2006). 44. Wheeler, J. C. & Akiyama, S. Asymmetric supernovae and gamma-ray bursts. New Astron. Rev. 54, 183–190 (2010). ©2014 Macmillan Publishers Limited. All rights reserved
- 7. LETTER RESEARCH Extended Data Figure 1 | The background-subtracted image of Cas A in the 65–70-keV band containing the 68-keV 44Ti line showing the significance of the 44Ti knots. The data have been smoothed with a 2099-radius top-hat function (dashed circle) and are shown with 3s and 4s significance contours (green). In addition to the features shown in Fig. 1, here we also show locations of the forward (R < 15099) and reverse (R < 10099) shocks17 (white dashed circles), for context. The 44Ti clearly resolves into several significantly identified clumps that are non-uniformly distributed around the centre of expansion. ©2014 Macmillan Publishers Limited. All rights reserved
- 8. RESEARCH LETTER Extended Data Figure 2 | The radial profile of the 44Ti emission. We collect each photon in annular bins of increasing radius in the plane of the sky without any spatial smoothing. a, Radial profile of the 44Ti data in the 65–70-keV band (black) and the radial profile expected from the background images (red), scaled by the area of each annulus and shown in units of counts per square arcsec. b, Background-subtracted radial profile. c, Percentage of enclosed flux in annuli of increasing radii as observed on the plane of the sky. All error bars are 1s. ©2014 Macmillan Publishers Limited. All rights reserved
- 9. LETTER RESEARCH Extended Data Figure 3 | Simulated 44Ti intensity contours for a symmetric explosion and a bipolar explosion. The vertical line shows a 49 scale (note the different spatial scale between the symmetric (left) and bipolar (right) explosions). The non-uniformities in the observed 44Ti spatial distribution rule out the purely symmetric explosion, even with extensive mixing. Similarly, the presence of 44Ti away from the jet axis argues against the rapidly rotating progenitor that produced the bipolar explosion. We therefore argue that the explosion that produced Cas A is somewhere between these two extremes and that this is the first clear example of a low-mode convection explosion. ©2014 Macmillan Publishers Limited. All rights reserved
- 10. RESEARCH LETTER Extended Data Figure 4 | The background spectral model fit for one of the Cas A epochs. Shown are the data from the background regions (black points with 1s error bars included but not visible), the instrumental background (green), the CXB components (blue, dashed is the focused CXB component), the phenomenological ‘source’ model (magenta) and the total background model (red). Inset, background spectrum near the 44Ti emission lines showing the features that we model. The broad lines at 65 and 75 keV are probably neutron-capture emission features, and the narrow line near 67 keV is an internal activation line in the CdZnTe detectors. See Methods for more details. ©2014 Macmillan Publishers Limited. All rights reserved
- 11. LETTER RESEARCH Extended Data Figure 5 | The significant signals observed in the spectrum near 68 and 78 keV. Top, the black points (1s error bars) are the data shown after the background model spectrum has been subtracted from the source data. The red continuum is the best-fit power-law continuum over the 20–80-keV band pass. Bottom, the contribution to the C-stat statistics for each spectral bin. The large signals near 68 and 78 keV (the 44Ti emission lines) suggest that an additional spectral component is required. See Methods for details. ©2014 Macmillan Publishers Limited. All rights reserved
- 12. RESEARCH LETTER Extended Data Table 1 | List of observations used in this analysis Start and stop dates are given, as is the effective exposure of each observation. The exposure has been corrected for the period during which the source was occulted by the Earth, periods during which the instrument was not taking data and for the rate-dependent dead time, when the instrument was processing events and not sensitive to new incident photons. ©2014 Macmillan Publishers Limited. All rights reserved
- 13. LETTER RESEARCH Extended Data Table 2 | Best-fit continuum parameters Results for the considered continuum models. Error ranges for the parameters are given at the 90% level. ©2014 Macmillan Publishers Limited. All rights reserved
- 14. RESEARCH LETTER Extended Data Table 3 | Results from spectral analysis Results for all three spectral models for the 44Ti emission are given with 90% error estimates from the background Monte Carlo analysis. Errors are the statistical estimates from the fit parameters and do not include the systematic uncertainties in the NuSTAR effective area. ©2014 Macmillan Publishers Limited. All rights reserved