SlideShare una empresa de Scribd logo
1 de 4
FINDING AREAS FOR Z AND USING Z IN FINDING X GIVEN AREA USING EXCEL


                       FINDING AREAS FOR Z
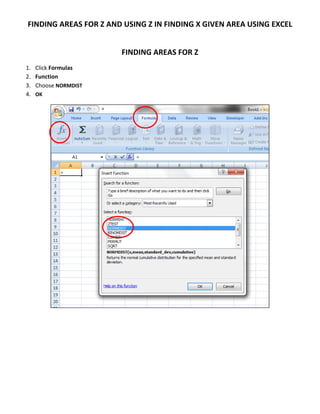
1.   Click Formulas
2.   Function
3.   Choose NORMDIST
4.   OK
5.   Type the value of x in the X box
6.   Type the value of the mean in the Mean box
7.   Type the value of the standard deviation in the Standard_dev box
8.   In the Cumulative box type true


9. Notice the results are for the area from the far left of the distribution up to X. If you are interested in
   the area between the mean and X, you will need to subtract .500 from the cumulative area.
USING Z IN FINDING X GIVEN AREA USING EXCEL
1.   Click Formulas
2.   Function
3.   Choose NORMINV
4.   OK
5. Type the probability value in the Probability box
6. Type the mean value into the Mean box
7. Type the standard deviation into the Standard_dev box


8. Notice the results are for the area from the far left of the distribution up to X. If you are interested in
   the area between the mean and X, you will need to subtract the cumulative area from .500.

Más contenido relacionado

Más de Sandra Nicks

Simple random sample using excel
Simple random sample using excelSimple random sample using excel
Simple random sample using excel
Sandra Nicks
 
Calculating binomial probabilities using excel
Calculating binomial probabilities using excelCalculating binomial probabilities using excel
Calculating binomial probabilities using excel
Sandra Nicks
 
Creating frequency distribution table, histograms and polygons using excel an...
Creating frequency distribution table, histograms and polygons using excel an...Creating frequency distribution table, histograms and polygons using excel an...
Creating frequency distribution table, histograms and polygons using excel an...
Sandra Nicks
 
Creating frequency distribution tables and histograms using excel analysis to...
Creating frequency distribution tables and histograms using excel analysis to...Creating frequency distribution tables and histograms using excel analysis to...
Creating frequency distribution tables and histograms using excel analysis to...
Sandra Nicks
 
Aron chpt 1 ed (1)
Aron chpt 1 ed (1)Aron chpt 1 ed (1)
Aron chpt 1 ed (1)
Sandra Nicks
 
Aronchpt3correlation
Aronchpt3correlationAronchpt3correlation
Aronchpt3correlation
Sandra Nicks
 
Calculating a correlation coefficient and scatter plot using excel
Calculating a correlation coefficient and scatter plot using excelCalculating a correlation coefficient and scatter plot using excel
Calculating a correlation coefficient and scatter plot using excel
Sandra Nicks
 

Más de Sandra Nicks (20)

Newletter v 2.1
Newletter v 2.1Newletter v 2.1
Newletter v 2.1
 
Night owl
Night owlNight owl
Night owl
 
Simple random sample using excel
Simple random sample using excelSimple random sample using excel
Simple random sample using excel
 
Chap015
Chap015Chap015
Chap015
 
Chap010
Chap010Chap010
Chap010
 
Chap009
Chap009Chap009
Chap009
 
Chap007
Chap007Chap007
Chap007
 
Calculating binomial probabilities using excel
Calculating binomial probabilities using excelCalculating binomial probabilities using excel
Calculating binomial probabilities using excel
 
Chap008
Chap008Chap008
Chap008
 
Chap006
Chap006Chap006
Chap006
 
Chap004
Chap004Chap004
Chap004
 
Creating frequency distribution table, histograms and polygons using excel an...
Creating frequency distribution table, histograms and polygons using excel an...Creating frequency distribution table, histograms and polygons using excel an...
Creating frequency distribution table, histograms and polygons using excel an...
 
Creating frequency distribution tables and histograms using excel analysis to...
Creating frequency distribution tables and histograms using excel analysis to...Creating frequency distribution tables and histograms using excel analysis to...
Creating frequency distribution tables and histograms using excel analysis to...
 
Chap005
Chap005Chap005
Chap005
 
Chap003
Chap003Chap003
Chap003
 
Chap004
Chap004Chap004
Chap004
 
Chap002
Chap002Chap002
Chap002
 
Aron chpt 1 ed (1)
Aron chpt 1 ed (1)Aron chpt 1 ed (1)
Aron chpt 1 ed (1)
 
Aronchpt3correlation
Aronchpt3correlationAronchpt3correlation
Aronchpt3correlation
 
Calculating a correlation coefficient and scatter plot using excel
Calculating a correlation coefficient and scatter plot using excelCalculating a correlation coefficient and scatter plot using excel
Calculating a correlation coefficient and scatter plot using excel
 

Último

Jual Obat Aborsi Hongkong ( Asli No.1 ) 085657271886 Obat Penggugur Kandungan...
Jual Obat Aborsi Hongkong ( Asli No.1 ) 085657271886 Obat Penggugur Kandungan...Jual Obat Aborsi Hongkong ( Asli No.1 ) 085657271886 Obat Penggugur Kandungan...
Jual Obat Aborsi Hongkong ( Asli No.1 ) 085657271886 Obat Penggugur Kandungan...
ZurliaSoop
 

Último (20)

Holdier Curriculum Vitae (April 2024).pdf
Holdier Curriculum Vitae (April 2024).pdfHoldier Curriculum Vitae (April 2024).pdf
Holdier Curriculum Vitae (April 2024).pdf
 
Food safety_Challenges food safety laboratories_.pdf
Food safety_Challenges food safety laboratories_.pdfFood safety_Challenges food safety laboratories_.pdf
Food safety_Challenges food safety laboratories_.pdf
 
TỔNG ÔN TẬP THI VÀO LỚP 10 MÔN TIẾNG ANH NĂM HỌC 2023 - 2024 CÓ ĐÁP ÁN (NGỮ Â...
TỔNG ÔN TẬP THI VÀO LỚP 10 MÔN TIẾNG ANH NĂM HỌC 2023 - 2024 CÓ ĐÁP ÁN (NGỮ Â...TỔNG ÔN TẬP THI VÀO LỚP 10 MÔN TIẾNG ANH NĂM HỌC 2023 - 2024 CÓ ĐÁP ÁN (NGỮ Â...
TỔNG ÔN TẬP THI VÀO LỚP 10 MÔN TIẾNG ANH NĂM HỌC 2023 - 2024 CÓ ĐÁP ÁN (NGỮ Â...
 
On_Translating_a_Tamil_Poem_by_A_K_Ramanujan.pptx
On_Translating_a_Tamil_Poem_by_A_K_Ramanujan.pptxOn_Translating_a_Tamil_Poem_by_A_K_Ramanujan.pptx
On_Translating_a_Tamil_Poem_by_A_K_Ramanujan.pptx
 
Micro-Scholarship, What it is, How can it help me.pdf
Micro-Scholarship, What it is, How can it help me.pdfMicro-Scholarship, What it is, How can it help me.pdf
Micro-Scholarship, What it is, How can it help me.pdf
 
How to Create and Manage Wizard in Odoo 17
How to Create and Manage Wizard in Odoo 17How to Create and Manage Wizard in Odoo 17
How to Create and Manage Wizard in Odoo 17
 
Wellbeing inclusion and digital dystopias.pptx
Wellbeing inclusion and digital dystopias.pptxWellbeing inclusion and digital dystopias.pptx
Wellbeing inclusion and digital dystopias.pptx
 
Python Notes for mca i year students osmania university.docx
Python Notes for mca i year students osmania university.docxPython Notes for mca i year students osmania university.docx
Python Notes for mca i year students osmania university.docx
 
Towards a code of practice for AI in AT.pptx
Towards a code of practice for AI in AT.pptxTowards a code of practice for AI in AT.pptx
Towards a code of practice for AI in AT.pptx
 
80 ĐỀ THI THỬ TUYỂN SINH TIẾNG ANH VÀO 10 SỞ GD – ĐT THÀNH PHỐ HỒ CHÍ MINH NĂ...
80 ĐỀ THI THỬ TUYỂN SINH TIẾNG ANH VÀO 10 SỞ GD – ĐT THÀNH PHỐ HỒ CHÍ MINH NĂ...80 ĐỀ THI THỬ TUYỂN SINH TIẾNG ANH VÀO 10 SỞ GD – ĐT THÀNH PHỐ HỒ CHÍ MINH NĂ...
80 ĐỀ THI THỬ TUYỂN SINH TIẾNG ANH VÀO 10 SỞ GD – ĐT THÀNH PHỐ HỒ CHÍ MINH NĂ...
 
Graduate Outcomes Presentation Slides - English
Graduate Outcomes Presentation Slides - EnglishGraduate Outcomes Presentation Slides - English
Graduate Outcomes Presentation Slides - English
 
How to Give a Domain for a Field in Odoo 17
How to Give a Domain for a Field in Odoo 17How to Give a Domain for a Field in Odoo 17
How to Give a Domain for a Field in Odoo 17
 
Sensory_Experience_and_Emotional_Resonance_in_Gabriel_Okaras_The_Piano_and_Th...
Sensory_Experience_and_Emotional_Resonance_in_Gabriel_Okaras_The_Piano_and_Th...Sensory_Experience_and_Emotional_Resonance_in_Gabriel_Okaras_The_Piano_and_Th...
Sensory_Experience_and_Emotional_Resonance_in_Gabriel_Okaras_The_Piano_and_Th...
 
Sociology 101 Demonstration of Learning Exhibit
Sociology 101 Demonstration of Learning ExhibitSociology 101 Demonstration of Learning Exhibit
Sociology 101 Demonstration of Learning Exhibit
 
Jual Obat Aborsi Hongkong ( Asli No.1 ) 085657271886 Obat Penggugur Kandungan...
Jual Obat Aborsi Hongkong ( Asli No.1 ) 085657271886 Obat Penggugur Kandungan...Jual Obat Aborsi Hongkong ( Asli No.1 ) 085657271886 Obat Penggugur Kandungan...
Jual Obat Aborsi Hongkong ( Asli No.1 ) 085657271886 Obat Penggugur Kandungan...
 
Understanding Accommodations and Modifications
Understanding  Accommodations and ModificationsUnderstanding  Accommodations and Modifications
Understanding Accommodations and Modifications
 
How to Manage Global Discount in Odoo 17 POS
How to Manage Global Discount in Odoo 17 POSHow to Manage Global Discount in Odoo 17 POS
How to Manage Global Discount in Odoo 17 POS
 
This PowerPoint helps students to consider the concept of infinity.
This PowerPoint helps students to consider the concept of infinity.This PowerPoint helps students to consider the concept of infinity.
This PowerPoint helps students to consider the concept of infinity.
 
Jamworks pilot and AI at Jisc (20/03/2024)
Jamworks pilot and AI at Jisc (20/03/2024)Jamworks pilot and AI at Jisc (20/03/2024)
Jamworks pilot and AI at Jisc (20/03/2024)
 
NO1 Top Black Magic Specialist In Lahore Black magic In Pakistan Kala Ilam Ex...
NO1 Top Black Magic Specialist In Lahore Black magic In Pakistan Kala Ilam Ex...NO1 Top Black Magic Specialist In Lahore Black magic In Pakistan Kala Ilam Ex...
NO1 Top Black Magic Specialist In Lahore Black magic In Pakistan Kala Ilam Ex...
 

Finding areas for z using excel

  • 1. FINDING AREAS FOR Z AND USING Z IN FINDING X GIVEN AREA USING EXCEL FINDING AREAS FOR Z 1. Click Formulas 2. Function 3. Choose NORMDIST 4. OK
  • 2. 5. Type the value of x in the X box 6. Type the value of the mean in the Mean box 7. Type the value of the standard deviation in the Standard_dev box 8. In the Cumulative box type true 9. Notice the results are for the area from the far left of the distribution up to X. If you are interested in the area between the mean and X, you will need to subtract .500 from the cumulative area.
  • 3. USING Z IN FINDING X GIVEN AREA USING EXCEL 1. Click Formulas 2. Function 3. Choose NORMINV 4. OK
  • 4. 5. Type the probability value in the Probability box 6. Type the mean value into the Mean box 7. Type the standard deviation into the Standard_dev box 8. Notice the results are for the area from the far left of the distribution up to X. If you are interested in the area between the mean and X, you will need to subtract the cumulative area from .500.