SlideShare una empresa de Scribd logo
1 de 36
Descargar para leer sin conexión
Gold Demand Trends
First quarter 2012
 May 2012                                                                                          www.gold.org


Overview
First quarter global gold demand totalled                                                          Contents

1,097.6 tonnes worth an estimated                                                                  Overview
                                                                                                   Turkey: a reawakening
                                                                                                                                       02
                                                                                                                                       04
US$59.7bn. Demand in the jewellery and                                                             Global gold market –

technology sectors declined in response to                                                         first quarter 2012 review
                                                                                                     Jewellery
                                                                                                                                       12
                                                                                                                                       13
higher average prices, outweighing a rise                                                            Technology                        15

in demand for ETFs and similar products.                                                             Investment                        16
                                                                                                     Official sector                   19
Central banks remained significant net                                                               Supply                            20

purchasers of gold, albeit to a lesser extent                                                      Gold demand statistics              22

than in Q1 2011. Read more…                                                                          Historical data for gold demand
                                                                                                   Appendix
                                                                                                                                       28
                                                                                                                                       29


Turkey: a reawakening                                Global gold market –                          Contributors
Turkey has long played a key role in the             first quarter 2012 review                     Eily Ong
global gold market. We look at the history                                                         eily.ong@gold.org
                                                     A year-on-year decline in gold demand
behind the Turkish gold market, as well as           partly reflects the strength of the Q1 2011   Louise Street
recent developments and the likely impact            base period, particularly in the investment   louise.street@gold.org
these will have on future demand for gold.           sector. Gold supply was 5% above
Read more…                                                                                         Johan Palmberg
                                                     year-earlier levels due to modest growth      johan.palmberg@gold.org
                                                     in mine production and recycling.
                                                     Read more…                                    Juan Carlos Artigas
                                                                                                   juancarlos.artigas@gold.org
                                                                                                   Marcus Grubb
Gold demand by category in tonnes and the gold price (US$/oz)                                      Managing Director, Investment
Tonnes, US$/oz                                                                                     marcus.grubb@gold.org
1,800
1,600
1,400
1,200
1,000
  800
  600
  400
  200
    0
 -200
      Q1’09          Q3’09          Q1’10         Q3’10         Q1’11      Q3’11        Q1’12
        Jewellery          Technology       Investment
        Official sector purchases           London PM fix (US$/oz)

Source: LBMA, Thomson Reuters GFMS, World Gold Council
Overview

At 1,097.6 tonnes, first quarter global gold demand was
5% below the near-record levels seen in Q1 2011. With
average prices materially higher than the same quarter in
2011, this equated to a value of US$59.7bn, 16% higher
year-on-year. Demand for gold in the jewellery and technology
sectors declined in response to US$ prices that were, on
average over the quarter, 22% above year-earlier levels.
Growth in the investment sector was led by an increase in
demand for ETFs and similar products, although demand for
gold bars and coins moderated in comparison with the
exceptionally strong result in Q1 2011. Central banks made a
solid contribution to demand, albeit lower than the very
strong net inflows of Q1 2011.


ETFs and similar products were the beneficiary of solid inflows       However, high local prices and the fact that there are fewer
during the quarter, as investors almost completely reversed the       auspicious days in the Hindu calendar will likely keep a lid on
net profit-taking of Q1 2011 with 51.4 tonnes of net demand.          jewellery demand in this key market.
Active buying interest during the first two months of the quarter
                                                                      Gold demand in China expanded to record levels in the first
tailed off during March as the gold price stabilised within a range
                                                                      quarter of 2012. Total consumer demand in China bucked the
and investors responded by moving to the sidelines.
                                                                      global trend by surging 10% to reach a new quarterly high of
India’s gold market experienced a disruptive quarter, with legal      255.2 tonnes. Further growth is expected: investors remain
and regulatory developments culminating in a well-publicised          wary of high inflation rates; and property market restrictions
national strike among jewellers. Demand in both the jewellery         continue to drive demand for gold among investors seeking
and investment sectors was affected as consumers and the              access to real assets. Jewellery continues to reap the benefits
trade sought to digest the implications of a change to the tax        of rising income levels, however, we forecast that demand will
treatment of gold. Weakness and volatility in the rupee gold          remain on a more moderate growth path as the market matures
price added to consumers’ reluctance to increase their volume         and economic growth decelerates.
purchases of gold. The second quarter is likely to see something
of a normalisation of investment demand as consumers adjust
to higher import taxes and bullion dealers rebuild their stocks.


Gold Demand Trends | First quarter 2012
As predicted in previous issues of Gold Demand Trends,
investment demand in the European markets remained strong,          Important note
within the higher range established since the onset of the global
economic crisis. Despite negative year-on-year comparisons          Effective from this issue of Gold Demand Trends, our
for investment demand in the region, consumers are sustaining       data model has been adapted to incorporate official sector
demand for gold bars and coins at considerably higher levels        purchases as an element of gold demand. We are confident
than has historically been the norm. We expect this to continue,    that net purchasing of gold by the official sector is now an
particularly as demand begins to take root and flourish in some     established trend, which is likely to remain in place for the
of the smaller, satellite markets in the region.                    foreseeable future. The data series ‘Official sector sales’
                                                                    has therefore been removed as a negative element of the
Central banks continued to buy gold; net purchases recorded         supply table.
during the quarter amounted to 80.8 tonnes, accounting
for around 7% of global gold demand. Central banks from a
diverse group of countries added to the overall gold holdings
of the official sector, with a number of banks making sizable
purchases. Diversification requirements and growth in the
foreign exchange reserves of a number of countries point
towards a continuation of this trend.


                                                                                                                              02 _03
Turkey: a reawakening

Turkey is an important gold market, both in terms of global
gold exports and local demand. Today the country’s gold
jewellery demand is ranked fifth in the world and it is the
eighth largest market for retail investment at 63.8 tonnes
and 72.9 tonnes respectively. Its gold jewellery exports
contributed nearly US$1.8bn to Turkey’s trade balance
last year.

We believe around 5,000 tonnes of gold (worth US$271.8bn or                  Gold demand in Turkey is expected to continue its recovery
TRY476.5bn)1 has been accumulated in homes in Turkey. It is                  path, with particular strength in investment, aided by various
also one of the top-ranked markets for gold consumption                      new developments in the country’s gold industry such as
intensity, at 2.1 gram (gm) per capita, behind countries such as             campaign initiatives by government targeting gold jewellery as
United Arab Emirates (UAE) of 7.0gm and Hong Kong of 2.3gm                   collateral and various gold investments and savings products
in 2011.                                                                     promotion in Turkey.
Turkey’s total gold demand rose 32.6% to reach 143 tonnes                    Traditionally, gold is seen as both an adornment and an
in 2011, although this level is only around half of the peak of              investment vehicle in the local community. According to a recent
249.3 tonnes achieved in 2007. The sharp decline in Turkish gold             government report on the Turkish jewellery trade, Anatolia, an
demand from 2008 to 2009 was due to the impact of the global                 eastern region of Turkey, is a place where jewellery has been
financial crisis, local recessionary pressures and slow economic             produced for 5,000 years and which houses the oldest jewellery
growth in the country.                                                       art in history.2 Today there are about 5,000 gold producers and
                                                                             35,000 retail outlets in the country.


Chart 1: Turkey gold demand in tonnes and the gold price in TRY/oz
Tonnes                                                                                                                                 TRY/oz
300                                                                                                                                     3,500


                                                                                                                                        3,000
250


                                                                                                                                        2,500
200

                                                                                                                                        2,000
150
                                                                                                                                        1,500

100
                                                                                                                                        1,000


 50
                                                                                                                                        500


  0                                                                                                                                     0
           2002       2003          2004           2005          2006          2007          2008      2009        2010         2011
         Investment     Jewellery          Gold (TRY/oz)

Source: LBMA, Thomson Reuters Datastream, Thomson Reuters GFMS, World Gold Council


1 Values are calculated based on Q1 2012 London PM fix average gold prices of US$1,690.57.
2 The Republic of Turkey Ministry of Economy’s Gold Jewellery Report, 2012. See www.economy.gov.tr


Gold Demand Trends | First quarter 2012
Istanbul is the centre for gold jewellery production, although          Gold remained top Turkish investment choice
production in Ankara and Izmir is also extensive. The Grand             In 2011, for the first time, gold investment in Turkey accounted
Bazaar, constructed in 1461, with its surrounding areas, is             for the lion’s share of the country’s total consumer demand.
still the heart of the Turkish gold jewellery sector. More than         The sector accounted for nearly 51% of domestic consumer
500 years later, a complex in Istanbul called “Kuyumcukent” in          gold demand compared to an average 29% share from 2006
Turkish (or known as “The Goldsmiths’ City”) also began to              to 2010, inclusive.
produce gold jewellery. Currently, Kuyumcukent is the largest
                                                                        The gold price has risen in all major currencies in recent years; in
integrated goldsmith centre in the world and has around
                                                                        Turkish lira terms the price increased 216% between May 2007
2,500 production units and shops.
                                                                        and April 2012. Much of this increase was on the back of
Before 1983, exporting gold jewellery was prohibited in Turkey.         concerns regarding the european sovereign debt crisis as Turkey
This ban was lifted in 1983 although gold bullion imports were          is a major trading partner in the region. Inflationary pressures
still prohibited. Two years later, the Turkish Central Bank (TCMB)      and lacklustre performance of other financial assets contributed
gained the right to import gold. Further deregulation of the            to the rise. Turkish retail investment in gold coins and bars rose
Turkish gold market ended the TCMB’s monopoly with the                  substantially from 40.5 tonnes in 2010 to 72.9 tonnes in 2011
amendments to decree No.32 concerning the Protection of the             (up 80% year-on-year). We expect this level of investment
Value of Turkish currency in 1993. These measures fully                 demand to rise further despite recent gold price performance.
liberalised the gold market, resulting in the rapid growth of
the sector.
The establishment of the Istanbul Gold Exchange (IGE) in 1995
was a key event in channelling gold into the financial system, by
allowing gold trading within one organised market. The authority
to import gold was given to members of the IGE in addition to
TCMB, allowing local gold prices to fall into line with
international gold prices. In February 2002, the Istanbul Gold
Refinery (IGR) started its gold recycling and bullion fabrication
operations and is one of the key players in the Turkish gold
investment sector.


Chart 2: Turkey gold demand by sector (%)
%                                                                                                                                    TRY/oz
100                                                                                                                                   3,500

 90
                                                                                                                                       3,000
 80

 70                                                                                                                                    2,500

 60
                                                                                                                                       2,000
 50
                                                                                                                                       1,500
 40

 30                                                                                                                                    1,000

 20
                                                                                                                                       500
 10

  0                                                                                                                                    0
        2002         2003          2004           2005       2006         2007        2008         2009         2010          2011
      Investment       Jewellery          Gold (TRY/oz)

Source: LBMA, Thomson Reuters Datastream, Thomson Reuters GFMS, World Gold Council


                                                                                                                                       04 _05
Gold’s unique properties as an asset, its relative safety and                   tools has drawn the attention of investors, with men also now
liquidity, and its diversification properties (such as low volatility           showing an interest in participating in gold coin or bar
and low or negative correlations to other main financial assets),               investment. 2011 witnessed an overall record-high coin demand
have ensured that it has remained a popular investment vehicle                  over the last decade reaching 58.9 tonnes, up 65.4% or 23
in Turkey. A recent annual survey by MasterCard Worldwide on                    tonnes year-on-year. Gold bar investment also reached a new
the spending and saving habits in Turkey showed that gold                       peak at 14 tonnes, up 218% or 10 tonnes year-on-year in 2011.
remained one of the top investment options for local investors
                                                                                Recently, there have been many gold banking products created
(at 23%) behind real estate (25%), as both asset classes are
                                                                                to meet the increasing domestic demand for more gold related
believed by the local investors to be safer and to provide greater
                                                                                instruments. People are being encouraged to use the banking
returns than bank deposits.
                                                                                system for their gold investment transactions to draw private
In the past the only way to invest in gold apart from jewellery                 holdings, what are known as “under-the-pillow” savings in to
was by purchasing gold coins. These coins come in various                       the economy.
denominations, with weights of between 1.75 grams and
36.0 grams. Gold coin purchases used to be the most popular
method of investment and women were the primary gold
investors. The recent increase in the variety of gold investment


Chart 3: Gold in various key currencies (4 May 2007=100)
Index level
400


350


300


250


200


150


100


 50
05/2007                      05/2008                           05/2009                       05/2010                05/2011
           Turkish lira    euro             Chinese renminbi         Indian rupee          US dollar

Source: LBMA, Thomson Reuters Datastream, World Gold Council


                                        Performance %*                                 Volatility %*                       Correlation
                                  5 years        3 years        1 year       5 years        3 years    1 year    5 years       3 years     1 year
 Gold                              143%             89%           13%           21%            17%      21%         1.00          1.00      1.00
 ISE 100                            36%            116%           -8%           31%            26%      26%         0.04          0.11       0.14
 ISE 30                             31%            105%           -9%          33%             27%      28%         0.05          0.10       0.13
 ESTX50                            -43%             10%           -17%         28%             24%      29%         0.02          0.18       0.16
 S&P 500                             -3%            64%            6%           24%            19%      21%         0.03          0.29      0.22
 DJIA                                5%             63%            7%          22%             17%      20%         0.00          0.28      0.23
 DFM                                -57%             2%            6%          32%             27%      19%        -0.03          0.05       0.12

*Annualised returns and standard deviations of weekly log returns; data to 30 March 2012. Note: ISE 100 = Istanbul Stock Exchange 100,
 ISE 30 = Istanbul Stock Exchange 30, ESTX50= Euro Stoxx 50, S&P 500 = Standard & Poor’s 500 Index, DJIA = Dow Jones Industrial Average,
 DFM = Dubai Financial Market.
Source: Bloomberg, World Gold Council


Gold Demand Trends | First quarter 2012
With the increase in focus on the various attributes of gold            which is an exchange traded fund (ETF) incorporated in Turkey
generated by the global financial crisis, banks realised a need to      where the fund invests in physical gold that is stored at the IGE.
diversify their retail gold investment product offerings. The           According to the IGE, demand for ETF gold-backed funds
development of new products started with gold accounts,                 increased from 8.2 tonnes in 2010 to 15.8 tonnes in 2011 with a
where retail investors would accumulate gold in their accounts          total value of US$0.8bn.
usually physically backed but not allocated. One of the most
                                                                        ATM-related physical gold purchasing is also a big development
important aspects that made gold investment very attractive is
                                                                        in Turkey, which has been the first country globally to adopt the
that 24-carat gold transactions are tax-free and the physical
                                                                        concept. This is a new and exciting trend that will be followed
delivery of these accounts would be with a small built-in
                                                                        more closely as it gains universal acceptance.
commission. Now there are about 18 different gold investment
instruments available in Turkey and Kuveyt Turk Bank is the bank        Gold investment in Turkey is expected to remain strong. The
that has the most diversified range of products.                        new local campaigns aimed at promoting gold products are
                                                                        expected to increase investment demand for Turkish gold bullion
The range of products on offer today vary from funds to gold
                                                                        and bars. Where gold coin and bars used to be the small
deposit accounts, gold cheques, gold credits (bank lending
                                                                        investors’ route to investing in gold, now Turkish banks have
facilities for members of the jewellery trade), gold transfers
                                                                        followed suit with a new and improved range of products
(a facility for transferring gold between bank accounts), gold
                                                                        enabling access to gold. It is estimated that banks in the country
gram accounts, and protected capital gold backed gold funds.
                                                                        are holding US$8.2bn worth of gold-related deposit accounts
Currently, it is estimated that total gold deposits in the banking
                                                                        and US$1.0bn worth of gold-related investment funds.
sector have reached approximately TRY14.3bn.
Apart from physical gold accumulation accounts, the most
popular tool amongst investors in the gold banking system is the
Istanbul Gold B Type Gold Exchange Traded Funds (GLDTR),


Chart 4: Turkish bar and coin demand in tonnes and the gold price (TRY/oz)
Tonnes                                                                                                                              TRY/oz
70                                                                                                                                   3,500


60                                                                                                                                    3,000


50                                                                                                                                    2,500


40                                                                                                                                    2,000


30                                                                                                                                   1,500


20                                                                                                                                   1,000


10                                                                                                                                    500


 0                                                                                                                                    0
         2002           2003        2004       2005         2006          2007        2008         2009        2010          2011
     Bar        Coins          Gold (TRY/oz)

Source: Thomson Reuters GFMS, LBMA, Thomson Reuters Datastream, World Gold Council


                                                                                                                                     06_07
Jewellery demand on road to recovery                                    Turkish consumers regard gold jewellery as representing an
The impact of the global financial crisis saw Turkey’s gold             investment as well as serving an ornamental purpose. The
jewellery demand fall 51% in 2009 to 75.2 tonnes. Since then,           Turkish woman starts her love affair with gold jewellery at a
its jewellery industry has broadly stabilised, despite higher           young age when she is taught by her mother that this is her
prices, as consumers appear to have adjusted their price                wealth preservation asset. However, she does not get to truly
expectations. It is interesting to highlight that its jewellery         enjoy the depth of this love affair until she begins earning her
demand per capita has doubled from its low at 0.4 gram in 2009          own income or gets married. This cycle starts with 14K that is
to 0.8 gram in 2011. Domestic gold jewellery demand recovered           gifted by her parents and then graduates to 18K or 22K jewellery
from 67.4 tonnes in 2010 to 70.1 tonnes in 2011 (up 3.6%                depending on her socio-economic status and geographic
year-on-year).                                                          location. The need to show off heavier, more expensive gold
                                                                        pieces does not start until marriage and thus the younger
Turkey has three main carat (K) orientations – 14K (also
                                                                        generation usually prefers lighter pieces (such as necklaces and
described as fantasy pieces and heavily designed as pieces for
                                                                        bracelets) of 14K.
daily wear); 18K (the second most popular carat only used with
diamonds and precious stones with designs varying from very             Gold jewellery is perceived as a value symbol (embodying both
modern to highly oriental or Ottoman pieces); and 22K (very             financial and emotional values) for the Turkish bride, and as part
traditional and only used in weddings or as a method of saving).        of the tradition a bride has a right to ask for wedding and gold
A recent survey conducted by the World Gold Council in 2011             jewelleries, all of which will belong to her. Wedding jewellery
revealed that Atasay, Altinba and Koçak Gold are the most               traditions and rituals differ from place to place. Eastern parts of
recognised Turkish gold brands. These were also the first brands        Turkey rely more heavily on yellow gold and authentic pieces
to launch gold jewellery advertising campaigns in                       than does the western part of the country.
the country.


Chart 5: Gold jewellery demand per capita in Turkey and the gold price (TRY/oz)
Gram per capita                                                                                                                      TRY/oz
1.0                                                                                                                                   3,500

0.9
                                                                                                                                       3,000
0.8

0.7                                                                                                                                    2,500

0.6
                                                                                                                                       2,000
0.5
                                                                                                                                       1,500
0.4

0.3                                                                                                                                    1,000

0.2
                                                                                                                                       500
0.1

0.0                                                                                                                                    0
        2002          2003          2004           2005      2006         2007        2008         2009         2010          2011
      Jewellery demand per capita          Gold (TRY/oz)

Source: LBMA, Thomson Reuters Datastream, Thomson Reuters GFMS, World Gold Council


Gold Demand Trends | First quarter 2012
Today the trend among the younger generation has shifted to                      exports in 2011. According to Ministry of Economy data, the
bracelets made of fabric where the centre piece is gold; or 14K                  main markets for Turkish gold jewellery exports are UAE, Iraq,
necklaces with engraved names. In the aftermath of the global                    Kazakhstan, Russia, USA, Lithuania, Germany, Italy and
economic crisis, consumers became more prudent, preferring                       Northern Africa.
22K pieces in light of the rise in gold prices. Although the local
                                                                                 Turkey imported on average around 111.3 tonnes between 2007
market tried to offer lower carat such as 8K, it has been
                                                                                 and 2011. Its gold imports have been steadily recovering since
considered among consumers to be an unwise choice and the
                                                                                 they fell to 38 tonnes in 2009 (or US$11.9bn) in line with the
attempted move to lower caratage ended in failure. Even 14K
                                                                                 decline in consumer demand when the global crisis struck in
has lost some market share to 22K jewellery. Jewellers
                                                                                 2008/09, based on Turkey’s Ministry of Economy and IGE data.
managed to mitigate the higher gold price and tighter customer
                                                                                 In 2010, a significant improvement was witnessed due to
budget by producing the same design with a lower weight;
                                                                                 higher gold demand with a total of 42 tonnes or US$16.5bn of
for example, a 22K 45-50 gram bangle will be produced as a
                                                                                 gold imports and in 2011 that number rose by 37.7 tonnes to
30 gram piece but with same feature design.
                                                                                 79.7 tonnes (US$40.3bn).3 IGE forecasts around 70 tonnes of
The Turkish gold jewellery industry also enjoys high volumes of                  gold will be imported in 2012.4
sales to foreigners visiting Turkey. According to the Export
Promotion Centre of Turkey, exports and sales made to tourists
in the domestic market together constitute 70% of the
industry’s total output. Exports of gold jewellery are a very
important part of the Turkish economy. According to data from
the Istanbul Minerals and Metals Exporters’ Associations
(IMMIB), gold represented almost 85% of total Turkish jewellery


Chart 6: Turkish gold jewellery exports in US$mn, gold imports in tonnes and the gold price in US$/oz (index 2002=100)
Index level
600


500


400


300


200


100


  0
          2002           2003            2004          2005           2006            2007        2008         2009           2010           2011
         Turkey gold jewellery exports          Turkey gold imports          Gold (US$/oz)

Source: Istanbul Gold Exchange, LBMA, Ministry of Economy, World Gold Council


3 Values are calculated using the average 2009, 2010 and 2011 London PM fix gold price of US$972.35, US$1,224.52 and US$ 1,571.52 respectively.
4 Thomson Reuters GFMS, 5 October 2011.


                                                                                                                                                  08_09
As described in the previous section, the Turkish government             Domestic supply continues to fall
started a new campaign initiative aimed at bringing ‘under-the-          Turkey’s total gold supply from domestic mine production and
pillow’ savings into the economy, by enabling gold jewellery to          recycled gold peaked in 2009 at 231.8 tonnes, since when it has
be used as collateral and reducing the margin of loss suffered by        declined sharply. Supply fell significantly by 29% year-on-year to
the consumer when selling jewellery. The certified jeweller will         98.6 tonnes in 2011, compared to 139.1 tonnes recorded in 2010
give a certificate to the customer who can go to the bank and            due to recycled gold.
open a bank account with the certificate. For example, a woman
                                                                         During 2011, Turkey’s recycled gold volumes were down by
could place her gold bangles as collateral into the custody of a
                                                                         nearly 39% year-on-year to 74 tonnes. This hefty reduction of
jeweller who then provides a gold certificate. The gold
                                                                         48.0 tonnes occurred in the face of the average annual Turkish
certificate could be used to open a gold-linked savings account.
                                                                         lira gold price rising over 33.7%, illustrating that recycling
This gives the jeweller the ability to store the gold while placing
                                                                         activity is not a pure function of the gold price. The decline in
the funds in a bank account. If she wants to retrieve one of her
                                                                         the supply of recycled gold is reflective of a number of factors,
bangles at a later date, she can obtain a certificate of payment
                                                                         including a decline in near-market supplies, expectations of
from the bank, which she provides to her jeweller, who will
                                                                         further price rises and a recovery in the global, and domestic,
return the item. The jeweller will get a small percentage of
                                                                         economic environment. The recent reduction in supply of gold
service and the bank will support the jeweller by offering
                                                                         from recycling has more than offset the rise in domestic mine
credit support.
                                                                         production of 7.5 tonnes.


Chart 7: Turkish gold supply in tonnes and the gold price (TRY/oz)
Tonnes                                                                                                                                TRY/oz
250                                                                                                                                    3,500


                                                                                                                                       3,000
200

                                                                                                                                       2,500

150
                                                                                                                                       2,000


                                                                                                                                       1,500
100

                                                                                                                                       1,000

 50
                                                                                                                                       500


  0                                                                                                                                    0
           2002            2003          2004     2005            2006    2007         2008         2009         2010         2011
         Mine production          Recycled gold   Gold (TRY/oz)

Source: LBMA, Thomson Reuters Datastream, Thomson Reuters GFMS, World Gold Council


Gold Demand Trends | First quarter 2012
Turkey’s gold mine production has risen for seven consecutive                   Since the start of the year, Turkey has reported an increase of
years, hitting a new record high at 24.6 tonnes in 2011 (up 43%                 14.3 tonnes to its official gold holdings, raising the total to
year-on-year) compared to 17.1 tonnes in 2010. However, the                     209.6 tons. The increase helped push Turkey’s gold as a
country may need to increase imports to meet further recovery                   percentage of total reserves from 6% at the beginning of 2011
in Turkish gold demand and declining recycled gold flows.                       to 12% at the end of March 2012.
Central bank official gold holdings increase                                    Outlook
According to the International Monetary Fund (IMF), the Turkish                 Recent developments in the Turkish gold industry are likely to
central Bank (Türkiye Cumhuriyet Merkez Bankasi or TCMB)                        have positive longer-term implications for this important market.
increased its gold reserves by 79 tonnes to 195.3 tonnes during                 Gold as an asset class has performed impressively over the past
2011, from 116.1 tonnes the year prior.                                         decade, both in Turkey and internationally. The new initiatives
                                                                                from the local government and commercial banks reinforce our
In order to strengthen the build-up of gold reserves and to
                                                                                view that there is huge potential for gold investment to increase
provide flexibility in the Turkish banking system’s liquidity
                                                                                among Turkish consumers, in a market with tight domestic
management, TCMB announced in October 2011 that up to
                                                                                supply and where gold plays a vital role in the Turkish culture.
10% of the reserve requirements maintained for Turkish lira
liabilities would be allowed to be maintained as “standard gold”.
As of the end of March 2012, the TCMB increased the amount
of gold that could qualify for reserves to 20%.5


Chart 8: Turkish central bank gold reserves
Tonnes                                                                                                                                                       %
250                                                                                                                                                          12


                                                                                                                                                             10
200


                                                                                                                                                              8
150

                                                                                                                                                              6

100
                                                                                                                                                              4


 50
                                                                                                                                                              2


  0                                                                                                                                                           0
           2002          2003            2004            2005        2006           2007           2008           2009           2010               2011
         Gold reserves          Gold as % of total reserves (rhs)

Note: Gold has been added to Turkey’s balance sheet as a result of a new policy accepting gold in its reserve requirements from commercial banks.
Please see this link for information on this policy action http://www.tcmb.gov.tr/yeni/announce/2011/ANO2011-50.htm
Source: IMF IFS, World Gold Council


5 Türkiye Cumhuriyet Merkez Bankasi, see http://www.tcmb.gov.tr/yeni/eng/


                                                                                                                                                           10_11
Global gold market –
first quarter 2012 review
First quarter gold demand of 1,097.6 tonnes, while in line with       Consumer demand in India was relatively weak in the first
the average of the preceding eight quarters, was 5% down on           quarter compared with the year earlier period. Weakness and
Q1 2011. Reduced levels of demand for gold in the jewellery,          volatility in the rupee resulted in elevated local prices while
technology and official sectors more than offset growth in gold       consumers struggled to digest a rise in import taxes on gold
investment demand.                                                    and the introduction of an excise duty on gold jewellery which
                                                                      prompted jewellers country-wide to strike. After the end of
The value measure of gold demand was 16% higher year-on-
                                                                      the quarter, and in response to the strike, the government
year at US$59.7bn, 11% below the record from Q3 2011 of
                                                                      announced that the excise duty would be withdrawn.
US$67.1bn. The average gold price of US$1,690.57 was 22%
                                                                      Investment demand saw the largest decline – down 46%
higher than the average of Q1 2011. In value terms, virtually all
                                                                      to 55.6 tonnes – while jewellery demand fell by 19% to
sectors of gold demand posted year-on-year increases, with the
                                                                      152.0 tonnes.
exception of physical bar demand, which was broadly flat, and
the official sector, where purchasing activity was below              Gold demand in China was boosted by the local New Year
Q1 2011’s exceptional levels.                                         holiday to a record 255.2 tonnes, making it the largest consumer
                                                                      market during the quarter. Although the pace of growth in
Investment demand was the only sector of the gold market to
                                                                      demand is slowing, gold continues to benefit from rising income
register year-on-year growth in the first quarter, which was led
                                                                      levels, increasing urbanisation, economic growth and the high
by solid demand for ETFs and similar products. Inflows into
                                                                      inflation environment.
the sector of 51.4 tonnes almost cancelled out the 62.1 tonnes
of net outflows in Q1 2011. Demand for medals and imitation           The official sector remained a net purchaser of gold, to the tune
coins, which is dominated by Indian demand, grew by 7%,               of 80.8 tonnes in Q1 2011. As discussed in the note on page 3
although remained very modest at 26.6 tonnes.                         of the report, we have moved official sector purchases to be a
                                                                      component of demand in our tables, reflecting our belief that
The other areas of investment demand were unable to sustain
                                                                      official sector activity has undergone a secular shift. Purchases
the lofty levels seen in Q1 2011, a time when bar and coin
                                                                      by central banks in the first quarter were widespread, with a
investment surged on increasing inflation concerns in a number
                                                                      number of banks making significant purchases.
of countries, Europe’s sovereign debt crisis and the unfolding
of events in the Middle East which quickly snowballed into the        At 107.7 tonnes, demand for gold used in technology, dentistry
‘Arab Spring’. Demand for gold bars and coins, at 260.0 tonnes        and other industrial applications was down by 7% compared
and 51.3 tonnes respectively, was nevertheless very robust in a       with year-earlier levels. This segment of the market was
longer-term context.                                                  affected by higher gold prices, fragile consumer demand in
                                                                      many key markets, swollen inventories and substitution losses.
OTC investment and stock flows were very moderately negative
in the first quarter, showing net outflows of 18.6 tonnes             In terms of the supply of gold to the market, the first quarter
compared with considerably larger net outflows of 151.1 tonnes        saw modest growth in mine production to 673.8 tonnes, which
in the corresponding period of 2011 (which echoed activity in         was slightly offset by a halving of (already minimal) levels of
ETFs during that time). The minimal net level of activity is partly   producer hedging, to just 5.0 tonnes. The supply of gold from
reflective of the sideways range within which the gold price          recycling activity was up 11% year-on-year to 391.5 tonnes,
established itself during the quarter, which gave investors in        taking total supply to 1,070.3 tonnes, representing a 5%
these sectors reason to pause, consolidate and await the next         increase on Q1 2011.
move in the gold price.
Demand in the jewellery sector of 519.8 tonnes was down 6%
year-on-year, largely in response to higher price levels. However,
the fact that the quarterly average price was 22% higher
suggests that demand for jewellery remains relatively price
inelastic. In US dollar terms, the value of jewellery demand grew
by 14% to a record US$28.3bn. Weakness was concentrated
in India, a number of Middle Eastern markets and Europe,
while a number of markets, primarily China, Russia and Egypt,
generated growth.


Gold Demand Trends | First quarter 2012
Jewellery                                                         That these developments occurred at a time of high and volatile
                                                                  local gold prices was a further dampener to demand. It can,
Jewellery demand in the first quarter totalled 519.8 tonnes,      however, be argued that demand could have been considerably
down 6% from Q1 2011, which was a strong quarter. On a value      weaker in light of such a negative environment. The prospect of
basis, demand was up 14% to a record high of US$28.3bn as         the Akshaya Tritiya (AT) festival on 24 April was seen to cushion
consumers allocated an increased level of spending to gold        demand to some extent. A large number of consumers typically
jewellery. When considered in a historical context, demand        plan and make their auspicious purchases for AT well ahead of
during Q1 2012 proved rather resilient; the 5-year average of     the festival (particularly if prices are widely expected to rise)
first quarter jewellery demand was 496.2 tonnes, 5% below this    and reports suggest that the bulk of consumers had bought in
quarter’s performance.                                            the first six weeks of the quarter, well ahead of the disruption
                                                                  caused by the budget announcement and strikes. Additionally,
Looking at jewellery demand across the individual markets,
                                                                  the numbers reflect the fact that retailer inventories were built
demand was weaker year-on-year in all but six countries with
                                                                  up to a certain extent during the strike as retail outlets were
India largely responsible for the decline.
                                                                  closed to consumers. It is likely that this impact will reverse
Demand for gold jewellery in India, of 152.0 tonnes, was          to some extent in the second quarter, as the supply chain
weakened by a number of factors during the first quarter. The     readjusts following the three week shutdown. While the higher
19% year-on-year decline in demand was, however, somewhat         import taxes may overshadow the market in the near term,
more muted a response than had been expected in light of          the fundamentals of Indian demand remain largely positive.
the adverse events that beset the market during the quarter.      Anecdotal reports suggest that demand for AT on 23 and
Demand value increased by 10% year-on-year to a record high       24 April was brisk, which was at least partially explained by
of Rs414.8bn.                                                     the release of pent-up demand following the strike. However,
                                                                  continued weakness and volatility in the rupee would limit
As a picture of deteriorating national finances emerged, the
                                                                  demand, given the impact on local gold prices.
Indian government took a number of steps aimed at reducing
its current account deficit. Having doubled customs duty on       China dominated the jewellery market in the first quarter.
standard gold (to 2% of the imported value) in January, the       Demand of 156.6 tonnes was 8% higher year-on-year and
government used the Union Budget in March to announce a           accounted for 30% of global jewellery demand and placed China
further doubling of these duties to 4%, while also widening       as the largest jewellery market for the third consecutive quarter.
the net to double the duty on non-standard gold and gold          The local currency value measure of demand reached a record
jewellery to 10%. Additionally, an effective 0.3% excise duty     RMB53.7bn, 26% higher year-on-year.
was imposed on branded as well as unbranded gold jewellery,
                                                                  Rising income levels and the Chinese New Year festivities
with jewellers being asked to collect tax at source on all gold
                                                                  helped to drive the growth in demand, which was concentrated
purchases above Rs.200,000.
                                                                  in the 24-carat, pure gold jewellery segment, while demand for
The announcement of these measures sparked a country-wide         K-gold (18K) slipped.
strike among jewellers, which lasted for three weeks from
                                                                  The pace of growth in Chinese gold jewellery demand has
16 March, ending on 6 April after the Finance Minister gave
                                                                  slowed considerably in the last couple of quarters, largely
assurance that the government would consider their demand to
                                                                  due to a deceleration in the Tier 1 and Tier 2 (larger) cities as
abolish the proposed excise duty. In early May, the government
                                                                  the exceptional growth rates of recent quarters proved to be
announced that the excise duty would be withdrawn, thereby
                                                                  unsustainable. It is likely that demand will continue to grow at
avoiding a resumption of the strike. While a number of national
                                                                  the more moderate rates of increase seen in recent quarters,
branded firms (such as Tanishq, Reliance and Gitanjali) did not
                                                                  mirroring the economic scenario in China. However, new
participate, the strike adversely impacted jewellery demand at
                                                                  measures introduced as of 15 April to halve import rates on gold
the retail level.
                                                                  jewellery may help in stimulating domestic demand by reducing
                                                                  the competitive tax advantage of Hong Kong, which sees
                                                                  considerable buying of gold by mainland Chinese tourists.


                                                                                                                               12 _13
Taiwanese jewellery demand increased by 9% year-on-year,           Year-on-year declines in demand across the Middle East region
equating to a minor volume increase of 0.2 tonnes, to              were largely explained by the rise in price over the same
2.0 tonnes. The growth was explained by a strong wedding           period. Double-digit declines were seen everywhere except
season, Chinese New Year gifting and gifts for babies born         Egypt, where demand was up 14% year-on-year. However,
so far during this auspicious Year of the Dragon. The 24 carat     the comparison is being made on the basis of an exceptionally
segment of the market benefited from the demand growth,            weak Q1 2011, when the outbreak of civil unrest decimated
while lower carat, more fashion-oriented gold was                  demand. The year-on-year growth reflected a certain amount
relatively soft.                                                   of re-stocking after inventories had been run down in
                                                                   previous quarters.
Expectations for the second quarter in Taiwan are mixed,
as demand is expected to be hampered by significant                Demand in Saudi Arabia dropped 17% to 10.5 tonnes as
power and gasoline price increases, while looser regulations       higher prices prompted consumers to shift towards lower-carat,
applied to mainland Chinese travellers is likely to encourage      lighter weight items. In some cases, retailers ceased to stock
tourist demand.                                                    21 carat items altogether. Demand among the Other Gulf group
                                                                   of countries weakened by 16% year-on-year to 4.4 tonnes for
Demand in Hong Kong slipped by 12% from the very robust
                                                                   similar reasons, with reports suggesting a notable shift to silver
levels seen in Q1 2011, although in absolute terms the market
                                                                   jewellery in Kuwait.
remains small at 6.4 tonnes. A decline in Chinese tourist
numbers in January and February contributed to this decline, as    In Dubai, demand fell 17% to 16.4 tonnes in spite of a
did persistent rainy weather during this period. Nevertheless,     reasonably successful shopping festival and robust tourist
March saw signs of a pick-up as the weather improved and           demand, as demand for 22 carat gold jewellery slumped among
mainland tourist numbers increased.                                the expat Indian population.

Markets in the neighbouring south East Asian region, with the      Consumers in Turkey generated 15.9 tonnes of demand for gold
exception of Indonesia, witnessed a weaker quarter compared        jewellery, 16% down on year-earlier levels. Translating this into
with Q1 2011 – an effect that was largely price-related.           value terms, demand was worth TL1.6bn 16% higher year-on-
                                                                   year but below the record levels from Q3 2011. The weakness
In Vietnam, jewellery demand slipped 10% to 5.0 tonnes as
                                                                   in demand volume was concentrated in the first two months of
a year-on-year increase in the local currency price of gold
                                                                   the quarter as near-record local prices combined with extreme
discouraged jewellery demand among consumers already
                                                                   adverse weather conditions to squeeze demand. A recovery
battling high levels of inflation. Demand is likely to moderate
                                                                   in March failed to reverse the weakness from January and
further over coming months as consumers in the urban youth
                                                                   February however, and this is reflected in Turkish import data
bracket prefer lower carat items and consumers take time to
                                                                   which show a sharp (50%) decline for January and February.
adjust to prevailing high prices.
                                                                   18-carat diamond jewellery has increasingly been the focus
Jewellery demand in Thailand fell by 8% year-on-year, in
                                                                   for manufactures and retailers, given the considerably higher
response to higher gold prices, although the decline in absolute
                                                                   margins generated by these items compared with the margins
terms (from 1.8 to 1.7 tonnes) was marginal.
                                                                   on plain 14-carat gold jewellery. Although on the face of it
Consumers in Indonesia demonstrated that they are becoming         this shift to higher carat could be viewed as positive for gold
more accustomed to gold at higher price levels, with demand for    volumes, the higher weight of gold used in 18-carat pieces was
gold jewellery up 9% year-on-year at 10.9 tonnes. The numbers      more than cancelled out by the smaller number of items sold.
were also reflective of stock replenishment by retailers after     In the 14-carat segment, gold weights have also been affected
consumers had been active buyers at Chinese New Year.              by a shift to lower weight pieces and full wedding sets being
                                                                   replaced with half sets.
Consumers in South Korea reacted to higher gold prices by
shifting to silver and lower-carat gold items, resulting in a
20% decline in gold jewellery demand to 4.0 tonnes.


Gold Demand Trends | First quarter 2012
Russia was one of the strongest performing gold jewellery             Technology
markets of the quarter, generating 28% year-on-year growth
in demand, which reached 20.4 tonnes. Although this partly            In the first quarter of 2012, demand for gold in the Technology
reflects stockbuilding activity among the trade, demand               sector decreased by 7% year-on-year to 107.7 tonnes. Much of
increased against a backdrop of historically low inflation,           the weakness can be attributed to high gold prices, although
GDP growth, improving consumer confidence and real wage               the uncertainty surrounding European financial markets also
growth. Gold remains the most popular metal of choice among           contributed. Demand in the electronics sector weakened by
Russian jewellery consumers, particularly demand mid-price            6% year-on-year, with a slowdown in consumer demand,
range items. Rose gold is gaining in popularity, as are gem-set       over-stocking and substitution losses accounting for much of
pieces, particularly with black or dark gemstones. An increasing      the decline. A drop of 8% in the other industrial and decorative
proportion of Russia’s gold jewellery imports have been coming        category was largely a response to higher prices. Demand for
from Turkey in recent months.                                         gold used in dental applications was down 7% year-on-year, due
                                                                      to ongoing substitution to lower cost alternatives.
High gold prices continued to erode demand in the western
markets, particularly in the US and Italy, both of which markets      The volume of gold used in electronics was down 6% year-
experienced double-digit declines. Although economic data             on-year at 75.4 tonnes. Global economic difficulties again
are showing tentative signs of improvement in the US, high            generated strong head winds for the industry, pushing
gold prices at a time of surging petrol prices and still-cautious     consumer sentiment lower and delivering a slowdown in
consumer confidence took their toll on gold jewellery demand          fabrication in some segments. Fabrication of semi conductors
in the first quarter. Demand fell 10% to 17.6 tonnes, just half the   remained under pressure as European economies were largely
36.5 tonne Q1 average for the period Q1 2006 – Q1 2011. The           stagnant and the lack of an obvious recovery had a contagion
value measure of demand increased by 10% year-on-year to              effect on other markets. According to the Semiconductor
US$958.2mn.                                                           Industry Association (SIA), worldwide semiconductor sales
                                                                      were US$69.9bn in the first quarter of 2012 (the latest
In Italy, demand slid 14% to 3.5 tonnes as the negative
                                                                      available data), a decline of 8% over sales of US$75.9bn in the
economic environment took its toll. Consumers responded to
                                                                      corresponding period of 2011.
an increasing tax burden, stubborn inflation, negative consumer
sentiment and the increasing impact of austerity measures by          The migration to cheaper alternatives in the bonding wire
tightening their purse strings and, consequently, reducing their      segment accounted for much of the decline in this segment
demand for gold jewellery.                                            and is likely to continue over the coming year. However, there
                                                                      were some positive areas of development in Q1, with strong
UK consumers reacted similarly to the high gold price, reducing
                                                                      consumer demand for wireless products such as mobile phones
their demand for gold jewellery by 4% to 3.0 tonnes. In a
                                                                      and media tablets boosting demand. Similarly, a rise in end-use
reflection of this, hallmarking activity slumped; the weight of
                                                                      by the auto sector has also benefited demand, even though
gold items being hallmarked fell almost 9% in the first quarter
                                                                      production volumes in Europe remained under severe pressure.
compared with the same period in 2011.
                                                                      Further growth within the NAND flash memory market also
                                                                      helped offset losses elsewhere, thanks to major sales drivers
                                                                      such as ultrabooks equipped with solid-state-drives (SSD
                                                                      – an alternative to traditional hard drives that is built out of
                                                                      semiconductors) and smart phones.


                                                                                                                                  14 _15
Looking briefly at individual markets reveals a mixed set of           Investment
outcomes. Japanese output slipped 8% for the period while
significant double digit declines were recorded in both South          First quarter gold investment demand (all demand for gold bars,
Korea and Taiwan, with migration to copper wire central to these       coins and ETFs and similar products) grew by 13% year-on-year
outcomes. Importantly, not all markets recorded year-on-year           to 389.3 tonnes. In US dollar terms, this equated to a demand
declines. Stronger economic growth in the domestic market              value of US$21.2bn, 13% below the previous quarter but 38%
boosted US demand, pushing gold offtake in this segment                higher year-on-year. An increase in demand for both ETFs and
higher by 7% year-on-year while China also recorded a rise,            medals/imitation coins were partly offset by declines in demand
although a weaker export market restricted growth for the              for physical bars and coins: the net result was that investment
period to 3%.                                                          demand was 45.8 tonnes higher than Q1 2011.

Demand from the “other industrial and decorative” (OID)                Adding in the OTC investment and stock flows category of
segment was also under significant pressure in Q1, dropping            investment (which captures investment in the over-the-counter
8% year-on-year to 21.8 tonnes. Much of the decline was due            market and stock movements as well as being a statistical
to losses in price sensitive areas, notably gold used in jari thread   residual) results in total investment of 370.7 tonnes in Q1,
in India and the electro-forming of jewellery in Italy. Not all        compared with 192.4 tonnes in Q1 2011. The value of total
segments in this diverse group suffered losses, however, with          investment was US$20.2bn, an increase of 135% over Q1 2011.
the demand for plating salts (chiefly gold potassium cyanide)
                                                                       First quarter demand for ETFs and similar products totalled
in many countries registering healthy gains. The above two
                                                                       51.4 tonnes, equivalent to a value of US$2.8bn. This compares
countries, for example, saw respective gains here from the
                                                                       favourably with the first quarter of 2011, when the sector saw
costume jewellery and luxury accessory sectors. In China,
                                                                       net outflows of 62.1 tonnes, outflows which were largely
healthy demand for gold used in plating salts (predominantly
                                                                       reversed by the demand of the most recent quarter. The bulk of
for the production of electroplated giftware) fed through to the
                                                                       first quarter demand was generated in January and February,
country enjoying a 2% rise in total OID fabrication for the period.
                                                                       when the sector witnessed reasonable inflows. March was
In the dental sector, demand declined by 7% year-on-year               broadly flat however, as the gold price became established in a
to 10.5 tonnes. This sector has been under severe pressure             range and profit-taking pressures were neutralised by modest
since the late 1990s, with long term losses the result of steady       new investment.
substitution to other materials, chiefly base metals (cobalt-
                                                                       The net impact of OTC investment and stock flows was a small
chrome amalgams) and ceramics. Price has been the main
                                                                       negative: 18.6 tonnes of disinvestment. This compares with
culprit for this secular decline as consumers have looked to
                                                                       much larger net outflows of 151.1 tonnes in the first quarter
cheaper alternatives, with offtake in this segment slumping
                                                                       of 2011. The modest size of the outflows from this sector
almost 30% in the last five years as gold prices have risen
                                                                       is reflective of the fact that the gold price established itself
significantly over this time. First quarter losses were heaviest
                                                                       within something of a sideways range in the closing weeks of
in Europe, as the fragile economic environment exacerbated
                                                                       the quarter, pulled in varying directions by early signs of US
matters through, for example, the reported postponing of dental
                                                                       economic recovery, the implications for US monetary policy,
work being carried out.
                                                                       a slowdown of Chinese growth and continued rumblings in
                                                                       Europe. Investors, uncertain how to interpret these varying
                                                                       indicators, largely chose to consolidate their positions and
                                                                       instead await the next significant market development/gold
                                                                       price move.


Gold Demand Trends | First quarter 2012
Demand for gold bars and coins of 337.9 tonnes was 17% below            In terms of retail investors in India, gross purchases of gold
the first quarter of 2011. In value terms, demand of US$18.4bn          coins remained firm, indicating solid demand at the household
was slightly higher year-on-year, up 2%. The tonnage decline in         level, although a portion of these purchases would have been
this category was largely the result of a year–on-year drop in bar      made with the intention of converting to jewellery in future.
demand, which at 260.0 tonnes was 59.0 tonnes (18%) lower               Nonetheless, the atmosphere of uncertainty combined with gold
than the year-earlier period. This negative comparison largely          price volatility related to rupee weakness served to keep a lid on
reflects the exceptional level of demand seen in Q1 2011, which         investment demand during the quarter. Larger scale investors
– at 319.1 tonnes – was the second highest quarter on record            generally stayed on the sidelines during the quarter, with some
for physical bar demand. Similarly, the 17% year-on-year drop in        profit-taking evident, awaiting dips in the price to provide
official coin demand reflects the strength of demand in Q1 2011.        buying opportunities.
In value terms, demand for bars and coins was more or less
                                                                        Expectations are for Indian investment to recover during the
stable; physical bar demand worth US$14.1bn was 1% below
                                                                        current quarter as the market adjusts to the new legislation and
Q1 2011 while official coin demand was marginally higher, up
                                                                        tax structure, particularly if prices dip. One notable development
1% at US$2.8bn.
                                                                        of the Indian market has been the increased take-up of ETFs.
Considered in the context of the last five years, first quarter         The introduction of another new gold ETF in India during the
demand for gold bars and official gold coins was robust;                quarter takes the total number to 12. This reaffirms the growing
demand of 51.3 tonnes was slightly above the 5-year average             interest in the sector of the market and marks a shift in the
for official coins of 50.7 tonnes, while physical bar demand was        buying patterns of urban consumers who realise that gold is an
well above its 5-year average of 171.5 tonnes. Demand for bars          essential foundation to a portfolio.
and coins during the first quarter of last year was stimulated by
                                                                        In China, investment demand at the consumer level jumped
a confluence of factors including Middle Eastern unrest, a spike
                                                                        13% year-on-year to reach a quarterly record of 98.6 tonnes.
in European sovereign debt concerns and heightened inflation
                                                                        Purchases related to Chinese New Year stimulated growth, with
concerns in a number of countries.
                                                                        commercial banks and department stores heavily promoting
Demand for medals and imitation coins, a segment dominated              products such as commemorative bars and coins to mark the
by India, countered some of the losses in bars and coins.               auspicious Year of the Dragon. Investor concerns over inflation
Demand here increased by 7% year-on-year to 26.6 tonnes. In             and awareness of the need for wealth preservation fuelled the
value terms, demand was 31% higher at a record US$1.4bn.                growth, as did enduring positive price expectations. The value
                                                                        measure of demand surged to a new high of RMB33.8bn, 32%
Investment demand in India was down 46% from year-
                                                                        above the previous record from Q1 2011 of RMB25.7bn.
earlier levels at 55.6 tonnes. In value terms, the year-on-year
comparison moderates slightly to a decline of 27%, with                 Going forward, investment demand in China will depend
demand worth Rs151.7bn. While this seems to indicate a large            to some extent on price expectations, together with the
drop in investment in India, it is worth clarifying the definition of   performance of alternative assets such as real estate and the
consumer bar and coin demand. In addition to investment and             domestic stock market. Although inflation is expected to ease,
profit-taking by consumers, the net investment flows captured           it remains under close watch by investors at large.
at a country level will include stocking and de-stocking by
                                                                        Investment demand in Taiwan gained 23% over year-earlier
wholesalers. The 47.4 tonne decline in investment in India from
                                                                        levels, although demand in absolute terms remained small at
Q1 2011 is partly reflective of considerable stock depletion by
                                                                        1.6 tonnes. The value measure of demand staged a more
bullion dealers. Given the uncertainty surrounding the potential
                                                                        dramatic 50% increase to US$87.0mn. Gross profit-taking was
impact on the gold market of the increases to import taxes
                                                                        muted and solid demand for the Bank of Taiwan Gold Passbooks
and excise duties, bullion dealers preferred to wait until the
                                                                        was reported. While the second quarter is expected to be fairly
disruption caused by this and the jeweller’s strike had dissipated
                                                                        subdued, demand is seen picking up again in the latter half
before rebuilding their inventories of gold bars.
                                                                        of the year.


                                                                                                                                     16_17
In Hong Kong, demand for gold bars and coins was up 11% at         Indonesian consumers increased their demand for gold bars
0.5 tonnes, worth US$27.2mn. Chinese New Year underpinned          and coins by 11% year-on-year. Investment demand totalled
demand.                                                            5.9 tonnes, the second highest quarter for thirty years and
                                                                   worth a record value of US$320.7mn. Buying was seen on
In Japan, gross selling back of existing holdings outweighed
                                                                   dips as Indonesian investors expressed their trust in gold as a
new investment again in the first quarter, but net disinvestment
                                                                   savings vehicle. Investment demand in South Korea gained
was a very modest -3.4 tonnes compared with -5.5 tonnes
                                                                   10% year-on-year, although volumes were slight at 1.1 tonnes.
the year-earlier. Market conditions were quiet during the
quarter, trading volumes were reported to be low and Japanese      Thailand was alone among the East Asian countries in
investors seemed to be in a ‘wait and see’ mode with regards to    experiencing a decline in demand for gold bars and coins.
their price expectations.                                          Demand was 29% weaker year-on-year at 20.8 tonnes.
                                                                   However, 20.8 tonnes of investment demand is well above
Investment demand across the rest of the Asian region was,
                                                                   longer term average demand in Thailand. Average quarterly
for the most part, higher than the same period the year earlier,
                                                                   demand from Q1 2003 – Q4 2007, prior to the global crisis, was
Thailand being the only exception. Other markets in the region
                                                                   just 3.1 tonnes. For the period Q1 2008 to Q4 2011, average
generated double-digit growth.
                                                                   quarterly demand increased to 12.8 tonnes. Investors continue
The region’s strongest-performing market was Vietnam, where        to hold their conviction that gold prices will rise further and
the volume of investment grew 41% year-on-year. Demand             buying is seen on dips, but this is met with profit-taking activity
of 20.0 tonnes was worth a value of US$1.1bn, 72% up on            at higher price levels.
Q1 2011. The government issued a Decree, to take effect on
                                                                   Investment demand in the Middle Eastern region staged
25 May, which recognised the legal ownership of gold bars
                                                                   something of a recovery in the first quarter. Demand for the
by organisations and individuals, although the trading of gold
                                                                   region totalled 9.0 tonnes, up 18% over the same period in
tael bars are limited only to commercial banks and licensed
                                                                   2011. For the most part, profit-taking dried up among large-scale
gold companies and gold used for transactions is banned. The
                                                                   investors across the region; however, it continues to be viewed
Decree provided gold bar traders with a six month window
                                                                   as a solid medium-to-long term investment and lower price
in which to finalise procedures for obtaining gold bar trading
                                                                   levels are likely to extract higher levels of demand. Egypt
certificates or instead switch to the production and trading of
                                                                   (0.6 tonnes) and Saudi Arabia (4.6 tonnes) generated the
gold jewellery. The State Bank of Vietnam announced that the
                                                                   strongest growth, with respective growth rates of 34% and
purpose of the Decree was to ‘remedy shortcomings in gold bar
                                                                   24% year-on-year. Growth in the UAE (3.0 tonnes) and Other
management, create a legal foundation to reorganise the gold
                                                                   Gulf countries (0.9 tonnes) was more moderate, at 9% and
market and tackle speculation and illegal trading’. The central
                                                                   13% year-on-year respectively.
bank will assume a monopoly on the production, import and
export of gold bars when the Decree comes into effect later this   Investment demand in Turkey totalled 15.2 tonnes in the first
month (May 2012).                                                  quarter, a decline of 12% from year-earlier levels. Measured in
                                                                   local currency, the value of demand was 22% higher at TL1.5bn.
Price expectations are likely to be a key driver of demand over
                                                                   Viewed on a month-by-month basis, activity throughout the
the coming months as government measures to curb inflation
                                                                   quarter was mixed. January saw a sharp decline in demand,
have started to take effect, feeding through to a significant
                                                                   largely due to January 2011 having been exceptionally strong for
reduction in CPI, thereby reducing the urgency among
                                                                   coin demand. Demand levels remained quiet in February before
consumers to purchase gold as an inflation hedge. However, the
                                                                   jumping in March as local prices dipped, prompting a surge in
measures taken by the government to stabilise the gold market
                                                                   coin minting. Price expectations among Turkish investors are
may lead to increased flows of gold through unofficial channels.
                                                                   mixed, but the heavy promotion of gold investment products by
                                                                   commercial banks and the continued popularity of gold deposit
                                                                   accounts suggest that the prospects are for firm levels of
                                                                   demand over the coming quarters.


Gold Demand Trends | First quarter 2012
Demand for gold bars and coins in the US amounted to                Official sector
13.6 tonnes, a drop of 32% year-on-year. Lower levels of
demand for gold eagle and buffalo coins from the US mint            Purchases by central banks and official sector institutions (now
reflected the weaker investment environment and two-way             a component of demand within our data series – please see
activity was noted in this market as some investors chose to        the “Important note” on page 3), amounted to 80.8 tonnes
take profits on some of the holdings that had been built up         during the first quarter of the year. The majority of these
over the preceding four years. The value of demand was down         purchases were made during the final month of the quarter,
17% year-on-year at US$739.2mn.                                     with momentum picking up in March after a fairly subdued start
                                                                    to the year. The year-on-year comparison shows a 41% decline
On the face of it, the data seem to show that European markets      in net purchases, which reflects the exceptional level of net
had a disappointing quarter for investment, with year-on-year       demand (137.0 tonnes) that took place during Q1 2011, largely
declines seen across the board, with the exception of France,       the result of considerable purchases by Mexico of around
which managed another quarter of modest net investment.             93 tonnes.
However, the quarter was being compared with Q1 2011, a
period which saw outstanding levels of investment across the        Consistent with its trend of continued purchases, Russia’s
region as European sovereign debt concerns were fuelled by          central bank bought around 16.5 tonnes in March after selling
Ireland’s bailout package, while the gathering pace of Middle       almost 4 tonnes in February for the purposes of minting coins.
Eastern unrest also stimulated demand.                              Russia’s gold reserves now amount to 895.7 tonnes, accounting
                                                                    for just under 10% of total reserves.
Since the third quarter of 2008 investment demand in European
markets has undergone a step-change, establishing itself within     Mexico continued to add to its gold reserves in the first quarter,
significantly higher ranges compared with pre-crisis levels.        reporting purchases of 16.8 tonnes in March. Mexico’s reserves,
While the levels of demand seen in the recent quarter may sit       which now stand at 122.6 tonnes, have been bolstered by
at the lower level of these new ranges, they are nonetheless        more than 115 tonnes since the beginning of 2011 and currently
well above the average quarterly levels that prevailed prior to     account for 4% of total reserves. Mexico confirmed after
the Lehman collapse, indicative of a sustained level of investor    its purchases last year that it was acquiring gold in line with
interest at relatively high levels.                                 prudent diversification principles of reserve management.

In Germany demand of 21.3 tonnes was 44% weaker year-on-            Purchases by Kazakhstan’s central bank gathered momentum
year as investors did not purchase gold with the same urgency       during the quarter, totalling 14.2 tonnes over the period. The
as in Q1 2011 when they were motivated by global geo-political      central bank’s governor announced in September that, starting
concerns and euro area difficulties. The decline in the value       in January this year, the bank planned to buy the country’s
of investment demand (worth €882.9mn) was a slightly more           entire gold bullion output over ‘the next two or three years’ to
moderate -28%. Switzerland registered a similar quarter, with       reduce its exposure to the US dollar. In 2011, mine production
investment demand 28% lower year-on-year at 20.2 tonnes,            in Kazakhstan was 36.7 tonnes of gold, making it the twentieth
a robust result in a historical context. Demand was valued at       largest producer globally.
CHF1.0bn, 14% lower year-on-year.                                   The Philippines also made net purchases throughout the quarter.
German-speaking countries experienced the most sizeable             Although IMF information for March is not available, information
year-on-year declines, reflecting the fact that these are more      on the central bank’s website is indicative of a sizeable purchase
‘mature’ gold investment markets which grew at a rapid pace         during the month. The central bank buys domestically produced
in the immediate aftermath of the global crisis. Some of the        gold, which it either sells or adds to official reserves.
smaller, EU accession countries, however, are still relatively      Other central banks contributing to the 81 tonnes of demand
under-developed in terms of gold investment and continued           in the first quarter include Belarus (+5 tonnes), Ukraine
growth in these markets was the reason for the more muted           (+1.2 tonnes) and Tajikistan (+0.2 tonnes).
decline in the ‘Other Europe’ category. Demand here was
14% below year-earlier levels at 18.5 tonnes, equivalent in value
terms to €764.8mn which was 9% higher relative to Q1 2011.


                                                                                                                                 18_19
Recent IMF data also show that Argentina increased its               Supply
reserves by around 7.0 tonnes in September 2011, the first
increase in its gold reserves for seven years, taking its total      The supply of gold from mine production, producer hedging and
holdings to 61.7 tonnes.                                             recycling activity totalled 1,070.3 tonnes in the second quarter,
                                                                     increasing by 5% year-on-year. An increase in mine production
Central bank sales were virtually non-existent during the quarter.
                                                                     was partially offset by a decline in net producer hedging to
Signatories to the third Central Bank Gold Agreement have
                                                                     virtually non-existent levels, resulting in a 2% increase in
almost ceased sales of their gold, with occasional small sales
                                                                     total mine supply. Supply from recycled gold increased by
announced as related to the sale of gold coins.
                                                                     39.5 tonnes during the quarter (+11%) to 391.5 tonnes.
As was the case last quarter, the 80.8 tonnes of purchases
                                                                     First quarter mine production of 673.8 tonnes of gold was 3%
made during Q1 are exclusive of the 14.3 tonnes of net
                                                                     above Q1 2011, representing a volume increase of 20.6 tonnes.
additions to Turkey’s gold reserves. These additions are the
                                                                     The bulk of the additional supply was the result of new projects
result of a policy change under which the central bank will allow
                                                                     coming on stream and/or the continued ramping up of projects
commercial banks to hold a certain proportion of their reserve
                                                                     that entered production from 2009/10 onwards. These projects
requirements in the form of ‘standard gold’, in order that the
                                                                     were spread across the globe and the result was a continuation
banks may use their gold to improve liquidity. Up to 20% of
                                                                     of the pattern from 2011, in which a diverse range of countries
reserve requirements for Turkish lira liabilities and 100% of
                                                                     contributed positively to global growth, while only a small
reserve requirements for precious metal deposit accounts, may
                                                                     number of countries generated lower levels of production.
now be held in the form of ‘standard gold’. The announcement
of this change is available on the Turkish central bank’s website    On the positive side, Goldcorp’s Penasquito mine in Mexico
at: http://www.tcmb.gov.tr/yeni/eng/                                 continued to ramp up production at its sulphide ore processing
                                                                     plant, which commenced in September 2010. Staying in the
For more information on the recent policy changes at the
                                                                     Latin American region, Chile’s Esperanza copper-gold mine
Turkish central bank, please see our Focus piece on page 4
                                                                     (jointly owned by Antofagasta and Marubeni) also continued to
of the report.
                                                                     increase production after being brought online
The trend, which has been established in recent years, of net        in late 2010/early 2011.
central bank gold buying looks set to extend further this year
                                                                     Increased production in Canada was largely from Osisko’s
as the main driving factors remain in place. The rapid growth of
                                                                     Canadian Malartic deposit, which poured first gold in April 2011.
foreign exchange reserves in a number of expanding economies
has required many central banks to increase gold holdings in         In Kazakhstan, production continued to ramp up at Altyntau
order to maintain the ratio of gold to their foreign exchange        Kokshetau, which completed its first year of production in
reserves. While, for other countries, central bank concerns with     mid-2011.
the dominance of the euro and US dollar and their respective
                                                                     Eldorado gold’s Efemçukuru mine in Turkey, which achieved
health as international reserves, has prompted a renewed focus
                                                                     commercial production in December 2011, contributed
on diversifying reserve assets.
                                                                     to growth in that country, as did a continued ramping up
                                                                     of production at Çöpler, which completed its first year of
                                                                     production in December 2011.


Gold Demand Trends | First quarter 2012
Gdt q1 2012
Gdt q1 2012
Gdt q1 2012
Gdt q1 2012
Gdt q1 2012
Gdt q1 2012
Gdt q1 2012
Gdt q1 2012
Gdt q1 2012
Gdt q1 2012
Gdt q1 2012
Gdt q1 2012
Gdt q1 2012
Gdt q1 2012
Gdt q1 2012
Gdt q1 2012

Más contenido relacionado

La actualidad más candente

SAC October 2011 Corporate Presentation
SAC October 2011 Corporate PresentationSAC October 2011 Corporate Presentation
SAC October 2011 Corporate Presentationsoamsilver
 
South American Silver Q1, 2011 Corporate Presentation
South American Silver Q1, 2011 Corporate PresentationSouth American Silver Q1, 2011 Corporate Presentation
South American Silver Q1, 2011 Corporate Presentationsoamsilver
 
Fortuna Silver September Investor Presentation
Fortuna Silver September Investor PresentationFortuna Silver September Investor Presentation
Fortuna Silver September Investor PresentationCompany Spotlight
 
Q2 2012 results presentation conf call
Q2 2012 results presentation conf callQ2 2012 results presentation conf call
Q2 2012 results presentation conf callAgnico Eagle Mines
 
SAC June 3 2011 Presentation
SAC June 3 2011 PresentationSAC June 3 2011 Presentation
SAC June 3 2011 Presentationsoamsilver
 
Fortuna Silver Mines August Investor Presentation
Fortuna Silver Mines August Investor PresentationFortuna Silver Mines August Investor Presentation
Fortuna Silver Mines August Investor PresentationCompany Spotlight
 
SAC November 2011 Corporate Presentation
SAC November 2011 Corporate PresentationSAC November 2011 Corporate Presentation
SAC November 2011 Corporate Presentationsoamsilver
 
South American Silver Q2, 2011 Corporate Presentation
South American Silver Q2, 2011 Corporate PresentationSouth American Silver Q2, 2011 Corporate Presentation
South American Silver Q2, 2011 Corporate Presentationsoamsilver
 
South American Silver Corp.
South American Silver Corp.South American Silver Corp.
South American Silver Corp.soamsilver
 
Mediterranean Resources Corporate Presentation 13
Mediterranean Resources Corporate Presentation 13Mediterranean Resources Corporate Presentation 13
Mediterranean Resources Corporate Presentation 13Company Spotlight
 
Med resourcescorppresentation aug13
Med resourcescorppresentation aug13Med resourcescorppresentation aug13
Med resourcescorppresentation aug13Company Spotlight
 
Sac presentation january 24, 2011
Sac presentation january 24, 2011Sac presentation january 24, 2011
Sac presentation january 24, 2011soamsilver
 
SAC September 2011 Corporate Presentation
SAC September 2011 Corporate PresentationSAC September 2011 Corporate Presentation
SAC September 2011 Corporate Presentationsoamsilver
 

La actualidad más candente (17)

SAC October 2011 Corporate Presentation
SAC October 2011 Corporate PresentationSAC October 2011 Corporate Presentation
SAC October 2011 Corporate Presentation
 
Med resmay13pres
Med resmay13presMed resmay13pres
Med resmay13pres
 
Med resapr13pres
Med resapr13presMed resapr13pres
Med resapr13pres
 
South American Silver Q1, 2011 Corporate Presentation
South American Silver Q1, 2011 Corporate PresentationSouth American Silver Q1, 2011 Corporate Presentation
South American Silver Q1, 2011 Corporate Presentation
 
Fortuna Silver September Investor Presentation
Fortuna Silver September Investor PresentationFortuna Silver September Investor Presentation
Fortuna Silver September Investor Presentation
 
Q2 2012 results presentation conf call
Q2 2012 results presentation conf callQ2 2012 results presentation conf call
Q2 2012 results presentation conf call
 
SAC June 3 2011 Presentation
SAC June 3 2011 PresentationSAC June 3 2011 Presentation
SAC June 3 2011 Presentation
 
Fortuna Silver Mines August Investor Presentation
Fortuna Silver Mines August Investor PresentationFortuna Silver Mines August Investor Presentation
Fortuna Silver Mines August Investor Presentation
 
SAC November 2011 Corporate Presentation
SAC November 2011 Corporate PresentationSAC November 2011 Corporate Presentation
SAC November 2011 Corporate Presentation
 
South American Silver Q2, 2011 Corporate Presentation
South American Silver Q2, 2011 Corporate PresentationSouth American Silver Q2, 2011 Corporate Presentation
South American Silver Q2, 2011 Corporate Presentation
 
Med resmay13pres
Med resmay13presMed resmay13pres
Med resmay13pres
 
South American Silver Corp.
South American Silver Corp.South American Silver Corp.
South American Silver Corp.
 
Mediterranean Resources Corporate Presentation 13
Mediterranean Resources Corporate Presentation 13Mediterranean Resources Corporate Presentation 13
Mediterranean Resources Corporate Presentation 13
 
Med resourcescorppresentation aug13
Med resourcescorppresentation aug13Med resourcescorppresentation aug13
Med resourcescorppresentation aug13
 
Med resjun13pres
Med resjun13presMed resjun13pres
Med resjun13pres
 
Sac presentation january 24, 2011
Sac presentation january 24, 2011Sac presentation january 24, 2011
Sac presentation january 24, 2011
 
SAC September 2011 Corporate Presentation
SAC September 2011 Corporate PresentationSAC September 2011 Corporate Presentation
SAC September 2011 Corporate Presentation
 

Similar a Gdt q1 2012

Capital Exploration Boom in West africa
Capital Exploration Boom in West africaCapital Exploration Boom in West africa
Capital Exploration Boom in West africaOM B
 
Investors Guide to the Gold Market (2).pdf
Investors Guide to the Gold Market (2).pdfInvestors Guide to the Gold Market (2).pdf
Investors Guide to the Gold Market (2).pdfJakeCompton2
 
South American Silver Corporate Presentation
South American Silver Corporate PresentationSouth American Silver Corporate Presentation
South American Silver Corporate Presentationsoamsilver
 
Sac may 4 2011 presentation
Sac may 4 2011 presentationSac may 4 2011 presentation
Sac may 4 2011 presentationsoamsilver
 
Sac may 4 2011 presentation
Sac may 4 2011 presentationSac may 4 2011 presentation
Sac may 4 2011 presentationsoamsilver
 
South American Silver Q2, 2011 Corporate Presentation
South American Silver Q2, 2011 Corporate PresentationSouth American Silver Q2, 2011 Corporate Presentation
South American Silver Q2, 2011 Corporate Presentationsoamsilver
 
South American Silver Q2, 2011 Corporate Presentation
South American Silver Q2, 2011 Corporate PresentationSouth American Silver Q2, 2011 Corporate Presentation
South American Silver Q2, 2011 Corporate Presentationsoamsilver
 
Qnb group has gold lost its appeal
Qnb group has gold lost its appealQnb group has gold lost its appeal
Qnb group has gold lost its appealQNB Group
 
Silver Recycling Volumes Forecast to Stagnate Over The Next Three Years — Eve...
Silver Recycling Volumes Forecast to Stagnate Over The Next Three Years — Eve...Silver Recycling Volumes Forecast to Stagnate Over The Next Three Years — Eve...
Silver Recycling Volumes Forecast to Stagnate Over The Next Three Years — Eve...Chris Helweg
 
newmont mining 2005_Annual_Report
newmont mining 2005_Annual_Reportnewmont mining 2005_Annual_Report
newmont mining 2005_Annual_Reportfinance37
 
Gold rep2012
Gold rep2012Gold rep2012
Gold rep2012lincolnxs
 
Gold, Gold ETF and gold FoF - a perspective!
Gold, Gold ETF and gold FoF -  a perspective!Gold, Gold ETF and gold FoF -  a perspective!
Gold, Gold ETF and gold FoF - a perspective!Dhuraivel Gunasekaran
 
World gold council gold-investor report- 1st q 2013
World gold council   gold-investor report- 1st q 2013World gold council   gold-investor report- 1st q 2013
World gold council gold-investor report- 1st q 2013Hochleitner Marine
 
30% of MMO Players Buy or Sell Gold
30% of MMO Players Buy or Sell Gold30% of MMO Players Buy or Sell Gold
30% of MMO Players Buy or Sell Goldpleasure16
 
Why gold is different from other assets
Why gold is different from other assetsWhy gold is different from other assets
Why gold is different from other assetsHochleitner Marine
 
Why gold is different from other assets
Why gold is different from other assetsWhy gold is different from other assets
Why gold is different from other assetsHochleitner Marine
 
Prospects of Gems and Jewellery Export in India
Prospects of Gems and Jewellery Export in IndiaProspects of Gems and Jewellery Export in India
Prospects of Gems and Jewellery Export in Indiapaperpublications3
 
Глобальная горнодобывающая промышленность: бои «без перчаток»
Глобальная горнодобывающая промышленность: бои «без перчаток»Глобальная горнодобывающая промышленность: бои «без перчаток»
Глобальная горнодобывающая промышленность: бои «без перчаток»PwC Russia
 

Similar a Gdt q1 2012 (20)

Gold Demand Trends Q2 2015
Gold Demand Trends Q2 2015Gold Demand Trends Q2 2015
Gold Demand Trends Q2 2015
 
Capital Exploration Boom in West africa
Capital Exploration Boom in West africaCapital Exploration Boom in West africa
Capital Exploration Boom in West africa
 
Investors Guide to the Gold Market (2).pdf
Investors Guide to the Gold Market (2).pdfInvestors Guide to the Gold Market (2).pdf
Investors Guide to the Gold Market (2).pdf
 
South American Silver Corporate Presentation
South American Silver Corporate PresentationSouth American Silver Corporate Presentation
South American Silver Corporate Presentation
 
Sac may 4 2011 presentation
Sac may 4 2011 presentationSac may 4 2011 presentation
Sac may 4 2011 presentation
 
Sac may 4 2011 presentation
Sac may 4 2011 presentationSac may 4 2011 presentation
Sac may 4 2011 presentation
 
South American Silver Q2, 2011 Corporate Presentation
South American Silver Q2, 2011 Corporate PresentationSouth American Silver Q2, 2011 Corporate Presentation
South American Silver Q2, 2011 Corporate Presentation
 
South American Silver Q2, 2011 Corporate Presentation
South American Silver Q2, 2011 Corporate PresentationSouth American Silver Q2, 2011 Corporate Presentation
South American Silver Q2, 2011 Corporate Presentation
 
Qnb group has gold lost its appeal
Qnb group has gold lost its appealQnb group has gold lost its appeal
Qnb group has gold lost its appeal
 
Silver Recycling Volumes Forecast to Stagnate Over The Next Three Years — Eve...
Silver Recycling Volumes Forecast to Stagnate Over The Next Three Years — Eve...Silver Recycling Volumes Forecast to Stagnate Over The Next Three Years — Eve...
Silver Recycling Volumes Forecast to Stagnate Over The Next Three Years — Eve...
 
newmont mining 2005_Annual_Report
newmont mining 2005_Annual_Reportnewmont mining 2005_Annual_Report
newmont mining 2005_Annual_Report
 
Gold rep2012
Gold rep2012Gold rep2012
Gold rep2012
 
Gold, Gold ETF and gold FoF - a perspective!
Gold, Gold ETF and gold FoF -  a perspective!Gold, Gold ETF and gold FoF -  a perspective!
Gold, Gold ETF and gold FoF - a perspective!
 
Resource Opportunities March 2009 1
Resource Opportunities March 2009 1Resource Opportunities March 2009 1
Resource Opportunities March 2009 1
 
World gold council gold-investor report- 1st q 2013
World gold council   gold-investor report- 1st q 2013World gold council   gold-investor report- 1st q 2013
World gold council gold-investor report- 1st q 2013
 
30% of MMO Players Buy or Sell Gold
30% of MMO Players Buy or Sell Gold30% of MMO Players Buy or Sell Gold
30% of MMO Players Buy or Sell Gold
 
Why gold is different from other assets
Why gold is different from other assetsWhy gold is different from other assets
Why gold is different from other assets
 
Why gold is different from other assets
Why gold is different from other assetsWhy gold is different from other assets
Why gold is different from other assets
 
Prospects of Gems and Jewellery Export in India
Prospects of Gems and Jewellery Export in IndiaProspects of Gems and Jewellery Export in India
Prospects of Gems and Jewellery Export in India
 
Глобальная горнодобывающая промышленность: бои «без перчаток»
Глобальная горнодобывающая промышленность: бои «без перчаток»Глобальная горнодобывающая промышленность: бои «без перчаток»
Глобальная горнодобывающая промышленность: бои «без перчаток»
 

Último

Introducing the Analogic framework for business planning applications
Introducing the Analogic framework for business planning applicationsIntroducing the Analogic framework for business planning applications
Introducing the Analogic framework for business planning applicationsKnowledgeSeed
 
Types of Cyberattacks - ASG I.T. Consulting.pdf
Types of Cyberattacks - ASG I.T. Consulting.pdfTypes of Cyberattacks - ASG I.T. Consulting.pdf
Types of Cyberattacks - ASG I.T. Consulting.pdfASGITConsulting
 
WSMM Technology February.March Newsletter_vF.pdf
WSMM Technology February.March Newsletter_vF.pdfWSMM Technology February.March Newsletter_vF.pdf
WSMM Technology February.March Newsletter_vF.pdfJamesConcepcion7
 
20200128 Ethical by Design - Whitepaper.pdf
20200128 Ethical by Design - Whitepaper.pdf20200128 Ethical by Design - Whitepaper.pdf
20200128 Ethical by Design - Whitepaper.pdfChris Skinner
 
Memorándum de Entendimiento (MoU) entre Codelco y SQM
Memorándum de Entendimiento (MoU) entre Codelco y SQMMemorándum de Entendimiento (MoU) entre Codelco y SQM
Memorándum de Entendimiento (MoU) entre Codelco y SQMVoces Mineras
 
Onemonitar Android Spy App Features: Explore Advanced Monitoring Capabilities
Onemonitar Android Spy App Features: Explore Advanced Monitoring CapabilitiesOnemonitar Android Spy App Features: Explore Advanced Monitoring Capabilities
Onemonitar Android Spy App Features: Explore Advanced Monitoring CapabilitiesOne Monitar
 
Darshan Hiranandani [News About Next CEO].pdf
Darshan Hiranandani [News About Next CEO].pdfDarshan Hiranandani [News About Next CEO].pdf
Darshan Hiranandani [News About Next CEO].pdfShashank Mehta
 
WSMM Media and Entertainment Feb_March_Final.pdf
WSMM Media and Entertainment Feb_March_Final.pdfWSMM Media and Entertainment Feb_March_Final.pdf
WSMM Media and Entertainment Feb_March_Final.pdfJamesConcepcion7
 
Environmental Impact Of Rotary Screw Compressors
Environmental Impact Of Rotary Screw CompressorsEnvironmental Impact Of Rotary Screw Compressors
Environmental Impact Of Rotary Screw Compressorselgieurope
 
Guide Complete Set of Residential Architectural Drawings PDF
Guide Complete Set of Residential Architectural Drawings PDFGuide Complete Set of Residential Architectural Drawings PDF
Guide Complete Set of Residential Architectural Drawings PDFChandresh Chudasama
 
Appkodes Tinder Clone Script with Customisable Solutions.pptx
Appkodes Tinder Clone Script with Customisable Solutions.pptxAppkodes Tinder Clone Script with Customisable Solutions.pptx
Appkodes Tinder Clone Script with Customisable Solutions.pptxappkodes
 
How Generative AI Is Transforming Your Business | Byond Growth Insights | Apr...
How Generative AI Is Transforming Your Business | Byond Growth Insights | Apr...How Generative AI Is Transforming Your Business | Byond Growth Insights | Apr...
How Generative AI Is Transforming Your Business | Byond Growth Insights | Apr...Hector Del Castillo, CPM, CPMM
 
Fordham -How effective decision-making is within the IT department - Analysis...
Fordham -How effective decision-making is within the IT department - Analysis...Fordham -How effective decision-making is within the IT department - Analysis...
Fordham -How effective decision-making is within the IT department - Analysis...Peter Ward
 
Planetary and Vedic Yagyas Bring Positive Impacts in Life
Planetary and Vedic Yagyas Bring Positive Impacts in LifePlanetary and Vedic Yagyas Bring Positive Impacts in Life
Planetary and Vedic Yagyas Bring Positive Impacts in LifeBhavana Pujan Kendra
 
Technical Leaders - Working with the Management Team
Technical Leaders - Working with the Management TeamTechnical Leaders - Working with the Management Team
Technical Leaders - Working with the Management TeamArik Fletcher
 
How To Simplify Your Scheduling with AI Calendarfly The Hassle-Free Online Bo...
How To Simplify Your Scheduling with AI Calendarfly The Hassle-Free Online Bo...How To Simplify Your Scheduling with AI Calendarfly The Hassle-Free Online Bo...
How To Simplify Your Scheduling with AI Calendarfly The Hassle-Free Online Bo...SOFTTECHHUB
 
business environment micro environment macro environment.pptx
business environment micro environment macro environment.pptxbusiness environment micro environment macro environment.pptx
business environment micro environment macro environment.pptxShruti Mittal
 
Excvation Safety for safety officers reference
Excvation Safety for safety officers referenceExcvation Safety for safety officers reference
Excvation Safety for safety officers referencessuser2c065e
 
Driving Business Impact for PMs with Jon Harmer
Driving Business Impact for PMs with Jon HarmerDriving Business Impact for PMs with Jon Harmer
Driving Business Impact for PMs with Jon HarmerAggregage
 

Último (20)

The Bizz Quiz-E-Summit-E-Cell-IITPatna.pptx
The Bizz Quiz-E-Summit-E-Cell-IITPatna.pptxThe Bizz Quiz-E-Summit-E-Cell-IITPatna.pptx
The Bizz Quiz-E-Summit-E-Cell-IITPatna.pptx
 
Introducing the Analogic framework for business planning applications
Introducing the Analogic framework for business planning applicationsIntroducing the Analogic framework for business planning applications
Introducing the Analogic framework for business planning applications
 
Types of Cyberattacks - ASG I.T. Consulting.pdf
Types of Cyberattacks - ASG I.T. Consulting.pdfTypes of Cyberattacks - ASG I.T. Consulting.pdf
Types of Cyberattacks - ASG I.T. Consulting.pdf
 
WSMM Technology February.March Newsletter_vF.pdf
WSMM Technology February.March Newsletter_vF.pdfWSMM Technology February.March Newsletter_vF.pdf
WSMM Technology February.March Newsletter_vF.pdf
 
20200128 Ethical by Design - Whitepaper.pdf
20200128 Ethical by Design - Whitepaper.pdf20200128 Ethical by Design - Whitepaper.pdf
20200128 Ethical by Design - Whitepaper.pdf
 
Memorándum de Entendimiento (MoU) entre Codelco y SQM
Memorándum de Entendimiento (MoU) entre Codelco y SQMMemorándum de Entendimiento (MoU) entre Codelco y SQM
Memorándum de Entendimiento (MoU) entre Codelco y SQM
 
Onemonitar Android Spy App Features: Explore Advanced Monitoring Capabilities
Onemonitar Android Spy App Features: Explore Advanced Monitoring CapabilitiesOnemonitar Android Spy App Features: Explore Advanced Monitoring Capabilities
Onemonitar Android Spy App Features: Explore Advanced Monitoring Capabilities
 
Darshan Hiranandani [News About Next CEO].pdf
Darshan Hiranandani [News About Next CEO].pdfDarshan Hiranandani [News About Next CEO].pdf
Darshan Hiranandani [News About Next CEO].pdf
 
WSMM Media and Entertainment Feb_March_Final.pdf
WSMM Media and Entertainment Feb_March_Final.pdfWSMM Media and Entertainment Feb_March_Final.pdf
WSMM Media and Entertainment Feb_March_Final.pdf
 
Environmental Impact Of Rotary Screw Compressors
Environmental Impact Of Rotary Screw CompressorsEnvironmental Impact Of Rotary Screw Compressors
Environmental Impact Of Rotary Screw Compressors
 
Guide Complete Set of Residential Architectural Drawings PDF
Guide Complete Set of Residential Architectural Drawings PDFGuide Complete Set of Residential Architectural Drawings PDF
Guide Complete Set of Residential Architectural Drawings PDF
 
Appkodes Tinder Clone Script with Customisable Solutions.pptx
Appkodes Tinder Clone Script with Customisable Solutions.pptxAppkodes Tinder Clone Script with Customisable Solutions.pptx
Appkodes Tinder Clone Script with Customisable Solutions.pptx
 
How Generative AI Is Transforming Your Business | Byond Growth Insights | Apr...
How Generative AI Is Transforming Your Business | Byond Growth Insights | Apr...How Generative AI Is Transforming Your Business | Byond Growth Insights | Apr...
How Generative AI Is Transforming Your Business | Byond Growth Insights | Apr...
 
Fordham -How effective decision-making is within the IT department - Analysis...
Fordham -How effective decision-making is within the IT department - Analysis...Fordham -How effective decision-making is within the IT department - Analysis...
Fordham -How effective decision-making is within the IT department - Analysis...
 
Planetary and Vedic Yagyas Bring Positive Impacts in Life
Planetary and Vedic Yagyas Bring Positive Impacts in LifePlanetary and Vedic Yagyas Bring Positive Impacts in Life
Planetary and Vedic Yagyas Bring Positive Impacts in Life
 
Technical Leaders - Working with the Management Team
Technical Leaders - Working with the Management TeamTechnical Leaders - Working with the Management Team
Technical Leaders - Working with the Management Team
 
How To Simplify Your Scheduling with AI Calendarfly The Hassle-Free Online Bo...
How To Simplify Your Scheduling with AI Calendarfly The Hassle-Free Online Bo...How To Simplify Your Scheduling with AI Calendarfly The Hassle-Free Online Bo...
How To Simplify Your Scheduling with AI Calendarfly The Hassle-Free Online Bo...
 
business environment micro environment macro environment.pptx
business environment micro environment macro environment.pptxbusiness environment micro environment macro environment.pptx
business environment micro environment macro environment.pptx
 
Excvation Safety for safety officers reference
Excvation Safety for safety officers referenceExcvation Safety for safety officers reference
Excvation Safety for safety officers reference
 
Driving Business Impact for PMs with Jon Harmer
Driving Business Impact for PMs with Jon HarmerDriving Business Impact for PMs with Jon Harmer
Driving Business Impact for PMs with Jon Harmer
 

Gdt q1 2012

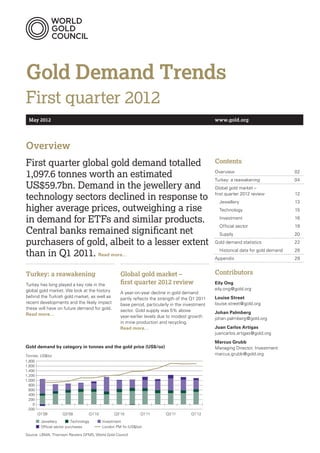
  • 1. Gold Demand Trends First quarter 2012 May 2012 www.gold.org Overview First quarter global gold demand totalled Contents 1,097.6 tonnes worth an estimated Overview Turkey: a reawakening 02 04 US$59.7bn. Demand in the jewellery and Global gold market – technology sectors declined in response to first quarter 2012 review Jewellery 12 13 higher average prices, outweighing a rise Technology 15 in demand for ETFs and similar products. Investment 16 Official sector 19 Central banks remained significant net Supply 20 purchasers of gold, albeit to a lesser extent Gold demand statistics 22 than in Q1 2011. Read more… Historical data for gold demand Appendix 28 29 Turkey: a reawakening Global gold market – Contributors Turkey has long played a key role in the first quarter 2012 review Eily Ong global gold market. We look at the history eily.ong@gold.org A year-on-year decline in gold demand behind the Turkish gold market, as well as partly reflects the strength of the Q1 2011 Louise Street recent developments and the likely impact base period, particularly in the investment louise.street@gold.org these will have on future demand for gold. sector. Gold supply was 5% above Read more… Johan Palmberg year-earlier levels due to modest growth johan.palmberg@gold.org in mine production and recycling. Read more… Juan Carlos Artigas juancarlos.artigas@gold.org Marcus Grubb Gold demand by category in tonnes and the gold price (US$/oz) Managing Director, Investment Tonnes, US$/oz marcus.grubb@gold.org 1,800 1,600 1,400 1,200 1,000 800 600 400 200 0 -200 Q1’09 Q3’09 Q1’10 Q3’10 Q1’11 Q3’11 Q1’12 Jewellery Technology Investment Official sector purchases London PM fix (US$/oz) Source: LBMA, Thomson Reuters GFMS, World Gold Council
  • 2. Overview At 1,097.6 tonnes, first quarter global gold demand was 5% below the near-record levels seen in Q1 2011. With average prices materially higher than the same quarter in 2011, this equated to a value of US$59.7bn, 16% higher year-on-year. Demand for gold in the jewellery and technology sectors declined in response to US$ prices that were, on average over the quarter, 22% above year-earlier levels. Growth in the investment sector was led by an increase in demand for ETFs and similar products, although demand for gold bars and coins moderated in comparison with the exceptionally strong result in Q1 2011. Central banks made a solid contribution to demand, albeit lower than the very strong net inflows of Q1 2011. ETFs and similar products were the beneficiary of solid inflows However, high local prices and the fact that there are fewer during the quarter, as investors almost completely reversed the auspicious days in the Hindu calendar will likely keep a lid on net profit-taking of Q1 2011 with 51.4 tonnes of net demand. jewellery demand in this key market. Active buying interest during the first two months of the quarter Gold demand in China expanded to record levels in the first tailed off during March as the gold price stabilised within a range quarter of 2012. Total consumer demand in China bucked the and investors responded by moving to the sidelines. global trend by surging 10% to reach a new quarterly high of India’s gold market experienced a disruptive quarter, with legal 255.2 tonnes. Further growth is expected: investors remain and regulatory developments culminating in a well-publicised wary of high inflation rates; and property market restrictions national strike among jewellers. Demand in both the jewellery continue to drive demand for gold among investors seeking and investment sectors was affected as consumers and the access to real assets. Jewellery continues to reap the benefits trade sought to digest the implications of a change to the tax of rising income levels, however, we forecast that demand will treatment of gold. Weakness and volatility in the rupee gold remain on a more moderate growth path as the market matures price added to consumers’ reluctance to increase their volume and economic growth decelerates. purchases of gold. The second quarter is likely to see something of a normalisation of investment demand as consumers adjust to higher import taxes and bullion dealers rebuild their stocks. Gold Demand Trends | First quarter 2012
  • 3. As predicted in previous issues of Gold Demand Trends, investment demand in the European markets remained strong, Important note within the higher range established since the onset of the global economic crisis. Despite negative year-on-year comparisons Effective from this issue of Gold Demand Trends, our for investment demand in the region, consumers are sustaining data model has been adapted to incorporate official sector demand for gold bars and coins at considerably higher levels purchases as an element of gold demand. We are confident than has historically been the norm. We expect this to continue, that net purchasing of gold by the official sector is now an particularly as demand begins to take root and flourish in some established trend, which is likely to remain in place for the of the smaller, satellite markets in the region. foreseeable future. The data series ‘Official sector sales’ has therefore been removed as a negative element of the Central banks continued to buy gold; net purchases recorded supply table. during the quarter amounted to 80.8 tonnes, accounting for around 7% of global gold demand. Central banks from a diverse group of countries added to the overall gold holdings of the official sector, with a number of banks making sizable purchases. Diversification requirements and growth in the foreign exchange reserves of a number of countries point towards a continuation of this trend. 02 _03
  • 4. Turkey: a reawakening Turkey is an important gold market, both in terms of global gold exports and local demand. Today the country’s gold jewellery demand is ranked fifth in the world and it is the eighth largest market for retail investment at 63.8 tonnes and 72.9 tonnes respectively. Its gold jewellery exports contributed nearly US$1.8bn to Turkey’s trade balance last year. We believe around 5,000 tonnes of gold (worth US$271.8bn or Gold demand in Turkey is expected to continue its recovery TRY476.5bn)1 has been accumulated in homes in Turkey. It is path, with particular strength in investment, aided by various also one of the top-ranked markets for gold consumption new developments in the country’s gold industry such as intensity, at 2.1 gram (gm) per capita, behind countries such as campaign initiatives by government targeting gold jewellery as United Arab Emirates (UAE) of 7.0gm and Hong Kong of 2.3gm collateral and various gold investments and savings products in 2011. promotion in Turkey. Turkey’s total gold demand rose 32.6% to reach 143 tonnes Traditionally, gold is seen as both an adornment and an in 2011, although this level is only around half of the peak of investment vehicle in the local community. According to a recent 249.3 tonnes achieved in 2007. The sharp decline in Turkish gold government report on the Turkish jewellery trade, Anatolia, an demand from 2008 to 2009 was due to the impact of the global eastern region of Turkey, is a place where jewellery has been financial crisis, local recessionary pressures and slow economic produced for 5,000 years and which houses the oldest jewellery growth in the country. art in history.2 Today there are about 5,000 gold producers and 35,000 retail outlets in the country. Chart 1: Turkey gold demand in tonnes and the gold price in TRY/oz Tonnes TRY/oz 300 3,500 3,000 250 2,500 200 2,000 150 1,500 100 1,000 50 500 0 0 2002 2003 2004 2005 2006 2007 2008 2009 2010 2011 Investment Jewellery Gold (TRY/oz) Source: LBMA, Thomson Reuters Datastream, Thomson Reuters GFMS, World Gold Council 1 Values are calculated based on Q1 2012 London PM fix average gold prices of US$1,690.57. 2 The Republic of Turkey Ministry of Economy’s Gold Jewellery Report, 2012. See www.economy.gov.tr Gold Demand Trends | First quarter 2012
  • 5. Istanbul is the centre for gold jewellery production, although Gold remained top Turkish investment choice production in Ankara and Izmir is also extensive. The Grand In 2011, for the first time, gold investment in Turkey accounted Bazaar, constructed in 1461, with its surrounding areas, is for the lion’s share of the country’s total consumer demand. still the heart of the Turkish gold jewellery sector. More than The sector accounted for nearly 51% of domestic consumer 500 years later, a complex in Istanbul called “Kuyumcukent” in gold demand compared to an average 29% share from 2006 Turkish (or known as “The Goldsmiths’ City”) also began to to 2010, inclusive. produce gold jewellery. Currently, Kuyumcukent is the largest The gold price has risen in all major currencies in recent years; in integrated goldsmith centre in the world and has around Turkish lira terms the price increased 216% between May 2007 2,500 production units and shops. and April 2012. Much of this increase was on the back of Before 1983, exporting gold jewellery was prohibited in Turkey. concerns regarding the european sovereign debt crisis as Turkey This ban was lifted in 1983 although gold bullion imports were is a major trading partner in the region. Inflationary pressures still prohibited. Two years later, the Turkish Central Bank (TCMB) and lacklustre performance of other financial assets contributed gained the right to import gold. Further deregulation of the to the rise. Turkish retail investment in gold coins and bars rose Turkish gold market ended the TCMB’s monopoly with the substantially from 40.5 tonnes in 2010 to 72.9 tonnes in 2011 amendments to decree No.32 concerning the Protection of the (up 80% year-on-year). We expect this level of investment Value of Turkish currency in 1993. These measures fully demand to rise further despite recent gold price performance. liberalised the gold market, resulting in the rapid growth of the sector. The establishment of the Istanbul Gold Exchange (IGE) in 1995 was a key event in channelling gold into the financial system, by allowing gold trading within one organised market. The authority to import gold was given to members of the IGE in addition to TCMB, allowing local gold prices to fall into line with international gold prices. In February 2002, the Istanbul Gold Refinery (IGR) started its gold recycling and bullion fabrication operations and is one of the key players in the Turkish gold investment sector. Chart 2: Turkey gold demand by sector (%) % TRY/oz 100 3,500 90 3,000 80 70 2,500 60 2,000 50 1,500 40 30 1,000 20 500 10 0 0 2002 2003 2004 2005 2006 2007 2008 2009 2010 2011 Investment Jewellery Gold (TRY/oz) Source: LBMA, Thomson Reuters Datastream, Thomson Reuters GFMS, World Gold Council 04 _05
  • 6. Gold’s unique properties as an asset, its relative safety and tools has drawn the attention of investors, with men also now liquidity, and its diversification properties (such as low volatility showing an interest in participating in gold coin or bar and low or negative correlations to other main financial assets), investment. 2011 witnessed an overall record-high coin demand have ensured that it has remained a popular investment vehicle over the last decade reaching 58.9 tonnes, up 65.4% or 23 in Turkey. A recent annual survey by MasterCard Worldwide on tonnes year-on-year. Gold bar investment also reached a new the spending and saving habits in Turkey showed that gold peak at 14 tonnes, up 218% or 10 tonnes year-on-year in 2011. remained one of the top investment options for local investors Recently, there have been many gold banking products created (at 23%) behind real estate (25%), as both asset classes are to meet the increasing domestic demand for more gold related believed by the local investors to be safer and to provide greater instruments. People are being encouraged to use the banking returns than bank deposits. system for their gold investment transactions to draw private In the past the only way to invest in gold apart from jewellery holdings, what are known as “under-the-pillow” savings in to was by purchasing gold coins. These coins come in various the economy. denominations, with weights of between 1.75 grams and 36.0 grams. Gold coin purchases used to be the most popular method of investment and women were the primary gold investors. The recent increase in the variety of gold investment Chart 3: Gold in various key currencies (4 May 2007=100) Index level 400 350 300 250 200 150 100 50 05/2007 05/2008 05/2009 05/2010 05/2011 Turkish lira euro Chinese renminbi Indian rupee US dollar Source: LBMA, Thomson Reuters Datastream, World Gold Council Performance %* Volatility %* Correlation 5 years 3 years 1 year 5 years 3 years 1 year 5 years 3 years 1 year Gold 143% 89% 13% 21% 17% 21% 1.00 1.00 1.00 ISE 100 36% 116% -8% 31% 26% 26% 0.04 0.11 0.14 ISE 30 31% 105% -9% 33% 27% 28% 0.05 0.10 0.13 ESTX50 -43% 10% -17% 28% 24% 29% 0.02 0.18 0.16 S&P 500 -3% 64% 6% 24% 19% 21% 0.03 0.29 0.22 DJIA 5% 63% 7% 22% 17% 20% 0.00 0.28 0.23 DFM -57% 2% 6% 32% 27% 19% -0.03 0.05 0.12 *Annualised returns and standard deviations of weekly log returns; data to 30 March 2012. Note: ISE 100 = Istanbul Stock Exchange 100, ISE 30 = Istanbul Stock Exchange 30, ESTX50= Euro Stoxx 50, S&P 500 = Standard & Poor’s 500 Index, DJIA = Dow Jones Industrial Average, DFM = Dubai Financial Market. Source: Bloomberg, World Gold Council Gold Demand Trends | First quarter 2012
  • 7. With the increase in focus on the various attributes of gold which is an exchange traded fund (ETF) incorporated in Turkey generated by the global financial crisis, banks realised a need to where the fund invests in physical gold that is stored at the IGE. diversify their retail gold investment product offerings. The According to the IGE, demand for ETF gold-backed funds development of new products started with gold accounts, increased from 8.2 tonnes in 2010 to 15.8 tonnes in 2011 with a where retail investors would accumulate gold in their accounts total value of US$0.8bn. usually physically backed but not allocated. One of the most ATM-related physical gold purchasing is also a big development important aspects that made gold investment very attractive is in Turkey, which has been the first country globally to adopt the that 24-carat gold transactions are tax-free and the physical concept. This is a new and exciting trend that will be followed delivery of these accounts would be with a small built-in more closely as it gains universal acceptance. commission. Now there are about 18 different gold investment instruments available in Turkey and Kuveyt Turk Bank is the bank Gold investment in Turkey is expected to remain strong. The that has the most diversified range of products. new local campaigns aimed at promoting gold products are expected to increase investment demand for Turkish gold bullion The range of products on offer today vary from funds to gold and bars. Where gold coin and bars used to be the small deposit accounts, gold cheques, gold credits (bank lending investors’ route to investing in gold, now Turkish banks have facilities for members of the jewellery trade), gold transfers followed suit with a new and improved range of products (a facility for transferring gold between bank accounts), gold enabling access to gold. It is estimated that banks in the country gram accounts, and protected capital gold backed gold funds. are holding US$8.2bn worth of gold-related deposit accounts Currently, it is estimated that total gold deposits in the banking and US$1.0bn worth of gold-related investment funds. sector have reached approximately TRY14.3bn. Apart from physical gold accumulation accounts, the most popular tool amongst investors in the gold banking system is the Istanbul Gold B Type Gold Exchange Traded Funds (GLDTR), Chart 4: Turkish bar and coin demand in tonnes and the gold price (TRY/oz) Tonnes TRY/oz 70 3,500 60 3,000 50 2,500 40 2,000 30 1,500 20 1,000 10 500 0 0 2002 2003 2004 2005 2006 2007 2008 2009 2010 2011 Bar Coins Gold (TRY/oz) Source: Thomson Reuters GFMS, LBMA, Thomson Reuters Datastream, World Gold Council 06_07
  • 8. Jewellery demand on road to recovery Turkish consumers regard gold jewellery as representing an The impact of the global financial crisis saw Turkey’s gold investment as well as serving an ornamental purpose. The jewellery demand fall 51% in 2009 to 75.2 tonnes. Since then, Turkish woman starts her love affair with gold jewellery at a its jewellery industry has broadly stabilised, despite higher young age when she is taught by her mother that this is her prices, as consumers appear to have adjusted their price wealth preservation asset. However, she does not get to truly expectations. It is interesting to highlight that its jewellery enjoy the depth of this love affair until she begins earning her demand per capita has doubled from its low at 0.4 gram in 2009 own income or gets married. This cycle starts with 14K that is to 0.8 gram in 2011. Domestic gold jewellery demand recovered gifted by her parents and then graduates to 18K or 22K jewellery from 67.4 tonnes in 2010 to 70.1 tonnes in 2011 (up 3.6% depending on her socio-economic status and geographic year-on-year). location. The need to show off heavier, more expensive gold pieces does not start until marriage and thus the younger Turkey has three main carat (K) orientations – 14K (also generation usually prefers lighter pieces (such as necklaces and described as fantasy pieces and heavily designed as pieces for bracelets) of 14K. daily wear); 18K (the second most popular carat only used with diamonds and precious stones with designs varying from very Gold jewellery is perceived as a value symbol (embodying both modern to highly oriental or Ottoman pieces); and 22K (very financial and emotional values) for the Turkish bride, and as part traditional and only used in weddings or as a method of saving). of the tradition a bride has a right to ask for wedding and gold A recent survey conducted by the World Gold Council in 2011 jewelleries, all of which will belong to her. Wedding jewellery revealed that Atasay, Altinba and Koçak Gold are the most traditions and rituals differ from place to place. Eastern parts of recognised Turkish gold brands. These were also the first brands Turkey rely more heavily on yellow gold and authentic pieces to launch gold jewellery advertising campaigns in than does the western part of the country. the country. Chart 5: Gold jewellery demand per capita in Turkey and the gold price (TRY/oz) Gram per capita TRY/oz 1.0 3,500 0.9 3,000 0.8 0.7 2,500 0.6 2,000 0.5 1,500 0.4 0.3 1,000 0.2 500 0.1 0.0 0 2002 2003 2004 2005 2006 2007 2008 2009 2010 2011 Jewellery demand per capita Gold (TRY/oz) Source: LBMA, Thomson Reuters Datastream, Thomson Reuters GFMS, World Gold Council Gold Demand Trends | First quarter 2012
  • 9. Today the trend among the younger generation has shifted to exports in 2011. According to Ministry of Economy data, the bracelets made of fabric where the centre piece is gold; or 14K main markets for Turkish gold jewellery exports are UAE, Iraq, necklaces with engraved names. In the aftermath of the global Kazakhstan, Russia, USA, Lithuania, Germany, Italy and economic crisis, consumers became more prudent, preferring Northern Africa. 22K pieces in light of the rise in gold prices. Although the local Turkey imported on average around 111.3 tonnes between 2007 market tried to offer lower carat such as 8K, it has been and 2011. Its gold imports have been steadily recovering since considered among consumers to be an unwise choice and the they fell to 38 tonnes in 2009 (or US$11.9bn) in line with the attempted move to lower caratage ended in failure. Even 14K decline in consumer demand when the global crisis struck in has lost some market share to 22K jewellery. Jewellers 2008/09, based on Turkey’s Ministry of Economy and IGE data. managed to mitigate the higher gold price and tighter customer In 2010, a significant improvement was witnessed due to budget by producing the same design with a lower weight; higher gold demand with a total of 42 tonnes or US$16.5bn of for example, a 22K 45-50 gram bangle will be produced as a gold imports and in 2011 that number rose by 37.7 tonnes to 30 gram piece but with same feature design. 79.7 tonnes (US$40.3bn).3 IGE forecasts around 70 tonnes of The Turkish gold jewellery industry also enjoys high volumes of gold will be imported in 2012.4 sales to foreigners visiting Turkey. According to the Export Promotion Centre of Turkey, exports and sales made to tourists in the domestic market together constitute 70% of the industry’s total output. Exports of gold jewellery are a very important part of the Turkish economy. According to data from the Istanbul Minerals and Metals Exporters’ Associations (IMMIB), gold represented almost 85% of total Turkish jewellery Chart 6: Turkish gold jewellery exports in US$mn, gold imports in tonnes and the gold price in US$/oz (index 2002=100) Index level 600 500 400 300 200 100 0 2002 2003 2004 2005 2006 2007 2008 2009 2010 2011 Turkey gold jewellery exports Turkey gold imports Gold (US$/oz) Source: Istanbul Gold Exchange, LBMA, Ministry of Economy, World Gold Council 3 Values are calculated using the average 2009, 2010 and 2011 London PM fix gold price of US$972.35, US$1,224.52 and US$ 1,571.52 respectively. 4 Thomson Reuters GFMS, 5 October 2011. 08_09
  • 10. As described in the previous section, the Turkish government Domestic supply continues to fall started a new campaign initiative aimed at bringing ‘under-the- Turkey’s total gold supply from domestic mine production and pillow’ savings into the economy, by enabling gold jewellery to recycled gold peaked in 2009 at 231.8 tonnes, since when it has be used as collateral and reducing the margin of loss suffered by declined sharply. Supply fell significantly by 29% year-on-year to the consumer when selling jewellery. The certified jeweller will 98.6 tonnes in 2011, compared to 139.1 tonnes recorded in 2010 give a certificate to the customer who can go to the bank and due to recycled gold. open a bank account with the certificate. For example, a woman During 2011, Turkey’s recycled gold volumes were down by could place her gold bangles as collateral into the custody of a nearly 39% year-on-year to 74 tonnes. This hefty reduction of jeweller who then provides a gold certificate. The gold 48.0 tonnes occurred in the face of the average annual Turkish certificate could be used to open a gold-linked savings account. lira gold price rising over 33.7%, illustrating that recycling This gives the jeweller the ability to store the gold while placing activity is not a pure function of the gold price. The decline in the funds in a bank account. If she wants to retrieve one of her the supply of recycled gold is reflective of a number of factors, bangles at a later date, she can obtain a certificate of payment including a decline in near-market supplies, expectations of from the bank, which she provides to her jeweller, who will further price rises and a recovery in the global, and domestic, return the item. The jeweller will get a small percentage of economic environment. The recent reduction in supply of gold service and the bank will support the jeweller by offering from recycling has more than offset the rise in domestic mine credit support. production of 7.5 tonnes. Chart 7: Turkish gold supply in tonnes and the gold price (TRY/oz) Tonnes TRY/oz 250 3,500 3,000 200 2,500 150 2,000 1,500 100 1,000 50 500 0 0 2002 2003 2004 2005 2006 2007 2008 2009 2010 2011 Mine production Recycled gold Gold (TRY/oz) Source: LBMA, Thomson Reuters Datastream, Thomson Reuters GFMS, World Gold Council Gold Demand Trends | First quarter 2012
  • 11. Turkey’s gold mine production has risen for seven consecutive Since the start of the year, Turkey has reported an increase of years, hitting a new record high at 24.6 tonnes in 2011 (up 43% 14.3 tonnes to its official gold holdings, raising the total to year-on-year) compared to 17.1 tonnes in 2010. However, the 209.6 tons. The increase helped push Turkey’s gold as a country may need to increase imports to meet further recovery percentage of total reserves from 6% at the beginning of 2011 in Turkish gold demand and declining recycled gold flows. to 12% at the end of March 2012. Central bank official gold holdings increase Outlook According to the International Monetary Fund (IMF), the Turkish Recent developments in the Turkish gold industry are likely to central Bank (Türkiye Cumhuriyet Merkez Bankasi or TCMB) have positive longer-term implications for this important market. increased its gold reserves by 79 tonnes to 195.3 tonnes during Gold as an asset class has performed impressively over the past 2011, from 116.1 tonnes the year prior. decade, both in Turkey and internationally. The new initiatives from the local government and commercial banks reinforce our In order to strengthen the build-up of gold reserves and to view that there is huge potential for gold investment to increase provide flexibility in the Turkish banking system’s liquidity among Turkish consumers, in a market with tight domestic management, TCMB announced in October 2011 that up to supply and where gold plays a vital role in the Turkish culture. 10% of the reserve requirements maintained for Turkish lira liabilities would be allowed to be maintained as “standard gold”. As of the end of March 2012, the TCMB increased the amount of gold that could qualify for reserves to 20%.5 Chart 8: Turkish central bank gold reserves Tonnes % 250 12 10 200 8 150 6 100 4 50 2 0 0 2002 2003 2004 2005 2006 2007 2008 2009 2010 2011 Gold reserves Gold as % of total reserves (rhs) Note: Gold has been added to Turkey’s balance sheet as a result of a new policy accepting gold in its reserve requirements from commercial banks. Please see this link for information on this policy action http://www.tcmb.gov.tr/yeni/announce/2011/ANO2011-50.htm Source: IMF IFS, World Gold Council 5 Türkiye Cumhuriyet Merkez Bankasi, see http://www.tcmb.gov.tr/yeni/eng/ 10_11
  • 12. Global gold market – first quarter 2012 review First quarter gold demand of 1,097.6 tonnes, while in line with Consumer demand in India was relatively weak in the first the average of the preceding eight quarters, was 5% down on quarter compared with the year earlier period. Weakness and Q1 2011. Reduced levels of demand for gold in the jewellery, volatility in the rupee resulted in elevated local prices while technology and official sectors more than offset growth in gold consumers struggled to digest a rise in import taxes on gold investment demand. and the introduction of an excise duty on gold jewellery which prompted jewellers country-wide to strike. After the end of The value measure of gold demand was 16% higher year-on- the quarter, and in response to the strike, the government year at US$59.7bn, 11% below the record from Q3 2011 of announced that the excise duty would be withdrawn. US$67.1bn. The average gold price of US$1,690.57 was 22% Investment demand saw the largest decline – down 46% higher than the average of Q1 2011. In value terms, virtually all to 55.6 tonnes – while jewellery demand fell by 19% to sectors of gold demand posted year-on-year increases, with the 152.0 tonnes. exception of physical bar demand, which was broadly flat, and the official sector, where purchasing activity was below Gold demand in China was boosted by the local New Year Q1 2011’s exceptional levels. holiday to a record 255.2 tonnes, making it the largest consumer market during the quarter. Although the pace of growth in Investment demand was the only sector of the gold market to demand is slowing, gold continues to benefit from rising income register year-on-year growth in the first quarter, which was led levels, increasing urbanisation, economic growth and the high by solid demand for ETFs and similar products. Inflows into inflation environment. the sector of 51.4 tonnes almost cancelled out the 62.1 tonnes of net outflows in Q1 2011. Demand for medals and imitation The official sector remained a net purchaser of gold, to the tune coins, which is dominated by Indian demand, grew by 7%, of 80.8 tonnes in Q1 2011. As discussed in the note on page 3 although remained very modest at 26.6 tonnes. of the report, we have moved official sector purchases to be a component of demand in our tables, reflecting our belief that The other areas of investment demand were unable to sustain official sector activity has undergone a secular shift. Purchases the lofty levels seen in Q1 2011, a time when bar and coin by central banks in the first quarter were widespread, with a investment surged on increasing inflation concerns in a number number of banks making significant purchases. of countries, Europe’s sovereign debt crisis and the unfolding of events in the Middle East which quickly snowballed into the At 107.7 tonnes, demand for gold used in technology, dentistry ‘Arab Spring’. Demand for gold bars and coins, at 260.0 tonnes and other industrial applications was down by 7% compared and 51.3 tonnes respectively, was nevertheless very robust in a with year-earlier levels. This segment of the market was longer-term context. affected by higher gold prices, fragile consumer demand in many key markets, swollen inventories and substitution losses. OTC investment and stock flows were very moderately negative in the first quarter, showing net outflows of 18.6 tonnes In terms of the supply of gold to the market, the first quarter compared with considerably larger net outflows of 151.1 tonnes saw modest growth in mine production to 673.8 tonnes, which in the corresponding period of 2011 (which echoed activity in was slightly offset by a halving of (already minimal) levels of ETFs during that time). The minimal net level of activity is partly producer hedging, to just 5.0 tonnes. The supply of gold from reflective of the sideways range within which the gold price recycling activity was up 11% year-on-year to 391.5 tonnes, established itself during the quarter, which gave investors in taking total supply to 1,070.3 tonnes, representing a 5% these sectors reason to pause, consolidate and await the next increase on Q1 2011. move in the gold price. Demand in the jewellery sector of 519.8 tonnes was down 6% year-on-year, largely in response to higher price levels. However, the fact that the quarterly average price was 22% higher suggests that demand for jewellery remains relatively price inelastic. In US dollar terms, the value of jewellery demand grew by 14% to a record US$28.3bn. Weakness was concentrated in India, a number of Middle Eastern markets and Europe, while a number of markets, primarily China, Russia and Egypt, generated growth. Gold Demand Trends | First quarter 2012
  • 13. Jewellery That these developments occurred at a time of high and volatile local gold prices was a further dampener to demand. It can, Jewellery demand in the first quarter totalled 519.8 tonnes, however, be argued that demand could have been considerably down 6% from Q1 2011, which was a strong quarter. On a value weaker in light of such a negative environment. The prospect of basis, demand was up 14% to a record high of US$28.3bn as the Akshaya Tritiya (AT) festival on 24 April was seen to cushion consumers allocated an increased level of spending to gold demand to some extent. A large number of consumers typically jewellery. When considered in a historical context, demand plan and make their auspicious purchases for AT well ahead of during Q1 2012 proved rather resilient; the 5-year average of the festival (particularly if prices are widely expected to rise) first quarter jewellery demand was 496.2 tonnes, 5% below this and reports suggest that the bulk of consumers had bought in quarter’s performance. the first six weeks of the quarter, well ahead of the disruption caused by the budget announcement and strikes. Additionally, Looking at jewellery demand across the individual markets, the numbers reflect the fact that retailer inventories were built demand was weaker year-on-year in all but six countries with up to a certain extent during the strike as retail outlets were India largely responsible for the decline. closed to consumers. It is likely that this impact will reverse Demand for gold jewellery in India, of 152.0 tonnes, was to some extent in the second quarter, as the supply chain weakened by a number of factors during the first quarter. The readjusts following the three week shutdown. While the higher 19% year-on-year decline in demand was, however, somewhat import taxes may overshadow the market in the near term, more muted a response than had been expected in light of the fundamentals of Indian demand remain largely positive. the adverse events that beset the market during the quarter. Anecdotal reports suggest that demand for AT on 23 and Demand value increased by 10% year-on-year to a record high 24 April was brisk, which was at least partially explained by of Rs414.8bn. the release of pent-up demand following the strike. However, continued weakness and volatility in the rupee would limit As a picture of deteriorating national finances emerged, the demand, given the impact on local gold prices. Indian government took a number of steps aimed at reducing its current account deficit. Having doubled customs duty on China dominated the jewellery market in the first quarter. standard gold (to 2% of the imported value) in January, the Demand of 156.6 tonnes was 8% higher year-on-year and government used the Union Budget in March to announce a accounted for 30% of global jewellery demand and placed China further doubling of these duties to 4%, while also widening as the largest jewellery market for the third consecutive quarter. the net to double the duty on non-standard gold and gold The local currency value measure of demand reached a record jewellery to 10%. Additionally, an effective 0.3% excise duty RMB53.7bn, 26% higher year-on-year. was imposed on branded as well as unbranded gold jewellery, Rising income levels and the Chinese New Year festivities with jewellers being asked to collect tax at source on all gold helped to drive the growth in demand, which was concentrated purchases above Rs.200,000. in the 24-carat, pure gold jewellery segment, while demand for The announcement of these measures sparked a country-wide K-gold (18K) slipped. strike among jewellers, which lasted for three weeks from The pace of growth in Chinese gold jewellery demand has 16 March, ending on 6 April after the Finance Minister gave slowed considerably in the last couple of quarters, largely assurance that the government would consider their demand to due to a deceleration in the Tier 1 and Tier 2 (larger) cities as abolish the proposed excise duty. In early May, the government the exceptional growth rates of recent quarters proved to be announced that the excise duty would be withdrawn, thereby unsustainable. It is likely that demand will continue to grow at avoiding a resumption of the strike. While a number of national the more moderate rates of increase seen in recent quarters, branded firms (such as Tanishq, Reliance and Gitanjali) did not mirroring the economic scenario in China. However, new participate, the strike adversely impacted jewellery demand at measures introduced as of 15 April to halve import rates on gold the retail level. jewellery may help in stimulating domestic demand by reducing the competitive tax advantage of Hong Kong, which sees considerable buying of gold by mainland Chinese tourists. 12 _13
  • 14. Taiwanese jewellery demand increased by 9% year-on-year, Year-on-year declines in demand across the Middle East region equating to a minor volume increase of 0.2 tonnes, to were largely explained by the rise in price over the same 2.0 tonnes. The growth was explained by a strong wedding period. Double-digit declines were seen everywhere except season, Chinese New Year gifting and gifts for babies born Egypt, where demand was up 14% year-on-year. However, so far during this auspicious Year of the Dragon. The 24 carat the comparison is being made on the basis of an exceptionally segment of the market benefited from the demand growth, weak Q1 2011, when the outbreak of civil unrest decimated while lower carat, more fashion-oriented gold was demand. The year-on-year growth reflected a certain amount relatively soft. of re-stocking after inventories had been run down in previous quarters. Expectations for the second quarter in Taiwan are mixed, as demand is expected to be hampered by significant Demand in Saudi Arabia dropped 17% to 10.5 tonnes as power and gasoline price increases, while looser regulations higher prices prompted consumers to shift towards lower-carat, applied to mainland Chinese travellers is likely to encourage lighter weight items. In some cases, retailers ceased to stock tourist demand. 21 carat items altogether. Demand among the Other Gulf group of countries weakened by 16% year-on-year to 4.4 tonnes for Demand in Hong Kong slipped by 12% from the very robust similar reasons, with reports suggesting a notable shift to silver levels seen in Q1 2011, although in absolute terms the market jewellery in Kuwait. remains small at 6.4 tonnes. A decline in Chinese tourist numbers in January and February contributed to this decline, as In Dubai, demand fell 17% to 16.4 tonnes in spite of a did persistent rainy weather during this period. Nevertheless, reasonably successful shopping festival and robust tourist March saw signs of a pick-up as the weather improved and demand, as demand for 22 carat gold jewellery slumped among mainland tourist numbers increased. the expat Indian population. Markets in the neighbouring south East Asian region, with the Consumers in Turkey generated 15.9 tonnes of demand for gold exception of Indonesia, witnessed a weaker quarter compared jewellery, 16% down on year-earlier levels. Translating this into with Q1 2011 – an effect that was largely price-related. value terms, demand was worth TL1.6bn 16% higher year-on- year but below the record levels from Q3 2011. The weakness In Vietnam, jewellery demand slipped 10% to 5.0 tonnes as in demand volume was concentrated in the first two months of a year-on-year increase in the local currency price of gold the quarter as near-record local prices combined with extreme discouraged jewellery demand among consumers already adverse weather conditions to squeeze demand. A recovery battling high levels of inflation. Demand is likely to moderate in March failed to reverse the weakness from January and further over coming months as consumers in the urban youth February however, and this is reflected in Turkish import data bracket prefer lower carat items and consumers take time to which show a sharp (50%) decline for January and February. adjust to prevailing high prices. 18-carat diamond jewellery has increasingly been the focus Jewellery demand in Thailand fell by 8% year-on-year, in for manufactures and retailers, given the considerably higher response to higher gold prices, although the decline in absolute margins generated by these items compared with the margins terms (from 1.8 to 1.7 tonnes) was marginal. on plain 14-carat gold jewellery. Although on the face of it Consumers in Indonesia demonstrated that they are becoming this shift to higher carat could be viewed as positive for gold more accustomed to gold at higher price levels, with demand for volumes, the higher weight of gold used in 18-carat pieces was gold jewellery up 9% year-on-year at 10.9 tonnes. The numbers more than cancelled out by the smaller number of items sold. were also reflective of stock replenishment by retailers after In the 14-carat segment, gold weights have also been affected consumers had been active buyers at Chinese New Year. by a shift to lower weight pieces and full wedding sets being replaced with half sets. Consumers in South Korea reacted to higher gold prices by shifting to silver and lower-carat gold items, resulting in a 20% decline in gold jewellery demand to 4.0 tonnes. Gold Demand Trends | First quarter 2012
  • 15. Russia was one of the strongest performing gold jewellery Technology markets of the quarter, generating 28% year-on-year growth in demand, which reached 20.4 tonnes. Although this partly In the first quarter of 2012, demand for gold in the Technology reflects stockbuilding activity among the trade, demand sector decreased by 7% year-on-year to 107.7 tonnes. Much of increased against a backdrop of historically low inflation, the weakness can be attributed to high gold prices, although GDP growth, improving consumer confidence and real wage the uncertainty surrounding European financial markets also growth. Gold remains the most popular metal of choice among contributed. Demand in the electronics sector weakened by Russian jewellery consumers, particularly demand mid-price 6% year-on-year, with a slowdown in consumer demand, range items. Rose gold is gaining in popularity, as are gem-set over-stocking and substitution losses accounting for much of pieces, particularly with black or dark gemstones. An increasing the decline. A drop of 8% in the other industrial and decorative proportion of Russia’s gold jewellery imports have been coming category was largely a response to higher prices. Demand for from Turkey in recent months. gold used in dental applications was down 7% year-on-year, due to ongoing substitution to lower cost alternatives. High gold prices continued to erode demand in the western markets, particularly in the US and Italy, both of which markets The volume of gold used in electronics was down 6% year- experienced double-digit declines. Although economic data on-year at 75.4 tonnes. Global economic difficulties again are showing tentative signs of improvement in the US, high generated strong head winds for the industry, pushing gold prices at a time of surging petrol prices and still-cautious consumer sentiment lower and delivering a slowdown in consumer confidence took their toll on gold jewellery demand fabrication in some segments. Fabrication of semi conductors in the first quarter. Demand fell 10% to 17.6 tonnes, just half the remained under pressure as European economies were largely 36.5 tonne Q1 average for the period Q1 2006 – Q1 2011. The stagnant and the lack of an obvious recovery had a contagion value measure of demand increased by 10% year-on-year to effect on other markets. According to the Semiconductor US$958.2mn. Industry Association (SIA), worldwide semiconductor sales were US$69.9bn in the first quarter of 2012 (the latest In Italy, demand slid 14% to 3.5 tonnes as the negative available data), a decline of 8% over sales of US$75.9bn in the economic environment took its toll. Consumers responded to corresponding period of 2011. an increasing tax burden, stubborn inflation, negative consumer sentiment and the increasing impact of austerity measures by The migration to cheaper alternatives in the bonding wire tightening their purse strings and, consequently, reducing their segment accounted for much of the decline in this segment demand for gold jewellery. and is likely to continue over the coming year. However, there were some positive areas of development in Q1, with strong UK consumers reacted similarly to the high gold price, reducing consumer demand for wireless products such as mobile phones their demand for gold jewellery by 4% to 3.0 tonnes. In a and media tablets boosting demand. Similarly, a rise in end-use reflection of this, hallmarking activity slumped; the weight of by the auto sector has also benefited demand, even though gold items being hallmarked fell almost 9% in the first quarter production volumes in Europe remained under severe pressure. compared with the same period in 2011. Further growth within the NAND flash memory market also helped offset losses elsewhere, thanks to major sales drivers such as ultrabooks equipped with solid-state-drives (SSD – an alternative to traditional hard drives that is built out of semiconductors) and smart phones. 14 _15
  • 16. Looking briefly at individual markets reveals a mixed set of Investment outcomes. Japanese output slipped 8% for the period while significant double digit declines were recorded in both South First quarter gold investment demand (all demand for gold bars, Korea and Taiwan, with migration to copper wire central to these coins and ETFs and similar products) grew by 13% year-on-year outcomes. Importantly, not all markets recorded year-on-year to 389.3 tonnes. In US dollar terms, this equated to a demand declines. Stronger economic growth in the domestic market value of US$21.2bn, 13% below the previous quarter but 38% boosted US demand, pushing gold offtake in this segment higher year-on-year. An increase in demand for both ETFs and higher by 7% year-on-year while China also recorded a rise, medals/imitation coins were partly offset by declines in demand although a weaker export market restricted growth for the for physical bars and coins: the net result was that investment period to 3%. demand was 45.8 tonnes higher than Q1 2011. Demand from the “other industrial and decorative” (OID) Adding in the OTC investment and stock flows category of segment was also under significant pressure in Q1, dropping investment (which captures investment in the over-the-counter 8% year-on-year to 21.8 tonnes. Much of the decline was due market and stock movements as well as being a statistical to losses in price sensitive areas, notably gold used in jari thread residual) results in total investment of 370.7 tonnes in Q1, in India and the electro-forming of jewellery in Italy. Not all compared with 192.4 tonnes in Q1 2011. The value of total segments in this diverse group suffered losses, however, with investment was US$20.2bn, an increase of 135% over Q1 2011. the demand for plating salts (chiefly gold potassium cyanide) First quarter demand for ETFs and similar products totalled in many countries registering healthy gains. The above two 51.4 tonnes, equivalent to a value of US$2.8bn. This compares countries, for example, saw respective gains here from the favourably with the first quarter of 2011, when the sector saw costume jewellery and luxury accessory sectors. In China, net outflows of 62.1 tonnes, outflows which were largely healthy demand for gold used in plating salts (predominantly reversed by the demand of the most recent quarter. The bulk of for the production of electroplated giftware) fed through to the first quarter demand was generated in January and February, country enjoying a 2% rise in total OID fabrication for the period. when the sector witnessed reasonable inflows. March was In the dental sector, demand declined by 7% year-on-year broadly flat however, as the gold price became established in a to 10.5 tonnes. This sector has been under severe pressure range and profit-taking pressures were neutralised by modest since the late 1990s, with long term losses the result of steady new investment. substitution to other materials, chiefly base metals (cobalt- The net impact of OTC investment and stock flows was a small chrome amalgams) and ceramics. Price has been the main negative: 18.6 tonnes of disinvestment. This compares with culprit for this secular decline as consumers have looked to much larger net outflows of 151.1 tonnes in the first quarter cheaper alternatives, with offtake in this segment slumping of 2011. The modest size of the outflows from this sector almost 30% in the last five years as gold prices have risen is reflective of the fact that the gold price established itself significantly over this time. First quarter losses were heaviest within something of a sideways range in the closing weeks of in Europe, as the fragile economic environment exacerbated the quarter, pulled in varying directions by early signs of US matters through, for example, the reported postponing of dental economic recovery, the implications for US monetary policy, work being carried out. a slowdown of Chinese growth and continued rumblings in Europe. Investors, uncertain how to interpret these varying indicators, largely chose to consolidate their positions and instead await the next significant market development/gold price move. Gold Demand Trends | First quarter 2012
  • 17. Demand for gold bars and coins of 337.9 tonnes was 17% below In terms of retail investors in India, gross purchases of gold the first quarter of 2011. In value terms, demand of US$18.4bn coins remained firm, indicating solid demand at the household was slightly higher year-on-year, up 2%. The tonnage decline in level, although a portion of these purchases would have been this category was largely the result of a year–on-year drop in bar made with the intention of converting to jewellery in future. demand, which at 260.0 tonnes was 59.0 tonnes (18%) lower Nonetheless, the atmosphere of uncertainty combined with gold than the year-earlier period. This negative comparison largely price volatility related to rupee weakness served to keep a lid on reflects the exceptional level of demand seen in Q1 2011, which investment demand during the quarter. Larger scale investors – at 319.1 tonnes – was the second highest quarter on record generally stayed on the sidelines during the quarter, with some for physical bar demand. Similarly, the 17% year-on-year drop in profit-taking evident, awaiting dips in the price to provide official coin demand reflects the strength of demand in Q1 2011. buying opportunities. In value terms, demand for bars and coins was more or less Expectations are for Indian investment to recover during the stable; physical bar demand worth US$14.1bn was 1% below current quarter as the market adjusts to the new legislation and Q1 2011 while official coin demand was marginally higher, up tax structure, particularly if prices dip. One notable development 1% at US$2.8bn. of the Indian market has been the increased take-up of ETFs. Considered in the context of the last five years, first quarter The introduction of another new gold ETF in India during the demand for gold bars and official gold coins was robust; quarter takes the total number to 12. This reaffirms the growing demand of 51.3 tonnes was slightly above the 5-year average interest in the sector of the market and marks a shift in the for official coins of 50.7 tonnes, while physical bar demand was buying patterns of urban consumers who realise that gold is an well above its 5-year average of 171.5 tonnes. Demand for bars essential foundation to a portfolio. and coins during the first quarter of last year was stimulated by In China, investment demand at the consumer level jumped a confluence of factors including Middle Eastern unrest, a spike 13% year-on-year to reach a quarterly record of 98.6 tonnes. in European sovereign debt concerns and heightened inflation Purchases related to Chinese New Year stimulated growth, with concerns in a number of countries. commercial banks and department stores heavily promoting Demand for medals and imitation coins, a segment dominated products such as commemorative bars and coins to mark the by India, countered some of the losses in bars and coins. auspicious Year of the Dragon. Investor concerns over inflation Demand here increased by 7% year-on-year to 26.6 tonnes. In and awareness of the need for wealth preservation fuelled the value terms, demand was 31% higher at a record US$1.4bn. growth, as did enduring positive price expectations. The value measure of demand surged to a new high of RMB33.8bn, 32% Investment demand in India was down 46% from year- above the previous record from Q1 2011 of RMB25.7bn. earlier levels at 55.6 tonnes. In value terms, the year-on-year comparison moderates slightly to a decline of 27%, with Going forward, investment demand in China will depend demand worth Rs151.7bn. While this seems to indicate a large to some extent on price expectations, together with the drop in investment in India, it is worth clarifying the definition of performance of alternative assets such as real estate and the consumer bar and coin demand. In addition to investment and domestic stock market. Although inflation is expected to ease, profit-taking by consumers, the net investment flows captured it remains under close watch by investors at large. at a country level will include stocking and de-stocking by Investment demand in Taiwan gained 23% over year-earlier wholesalers. The 47.4 tonne decline in investment in India from levels, although demand in absolute terms remained small at Q1 2011 is partly reflective of considerable stock depletion by 1.6 tonnes. The value measure of demand staged a more bullion dealers. Given the uncertainty surrounding the potential dramatic 50% increase to US$87.0mn. Gross profit-taking was impact on the gold market of the increases to import taxes muted and solid demand for the Bank of Taiwan Gold Passbooks and excise duties, bullion dealers preferred to wait until the was reported. While the second quarter is expected to be fairly disruption caused by this and the jeweller’s strike had dissipated subdued, demand is seen picking up again in the latter half before rebuilding their inventories of gold bars. of the year. 16_17
  • 18. In Hong Kong, demand for gold bars and coins was up 11% at Indonesian consumers increased their demand for gold bars 0.5 tonnes, worth US$27.2mn. Chinese New Year underpinned and coins by 11% year-on-year. Investment demand totalled demand. 5.9 tonnes, the second highest quarter for thirty years and worth a record value of US$320.7mn. Buying was seen on In Japan, gross selling back of existing holdings outweighed dips as Indonesian investors expressed their trust in gold as a new investment again in the first quarter, but net disinvestment savings vehicle. Investment demand in South Korea gained was a very modest -3.4 tonnes compared with -5.5 tonnes 10% year-on-year, although volumes were slight at 1.1 tonnes. the year-earlier. Market conditions were quiet during the quarter, trading volumes were reported to be low and Japanese Thailand was alone among the East Asian countries in investors seemed to be in a ‘wait and see’ mode with regards to experiencing a decline in demand for gold bars and coins. their price expectations. Demand was 29% weaker year-on-year at 20.8 tonnes. However, 20.8 tonnes of investment demand is well above Investment demand across the rest of the Asian region was, longer term average demand in Thailand. Average quarterly for the most part, higher than the same period the year earlier, demand from Q1 2003 – Q4 2007, prior to the global crisis, was Thailand being the only exception. Other markets in the region just 3.1 tonnes. For the period Q1 2008 to Q4 2011, average generated double-digit growth. quarterly demand increased to 12.8 tonnes. Investors continue The region’s strongest-performing market was Vietnam, where to hold their conviction that gold prices will rise further and the volume of investment grew 41% year-on-year. Demand buying is seen on dips, but this is met with profit-taking activity of 20.0 tonnes was worth a value of US$1.1bn, 72% up on at higher price levels. Q1 2011. The government issued a Decree, to take effect on Investment demand in the Middle Eastern region staged 25 May, which recognised the legal ownership of gold bars something of a recovery in the first quarter. Demand for the by organisations and individuals, although the trading of gold region totalled 9.0 tonnes, up 18% over the same period in tael bars are limited only to commercial banks and licensed 2011. For the most part, profit-taking dried up among large-scale gold companies and gold used for transactions is banned. The investors across the region; however, it continues to be viewed Decree provided gold bar traders with a six month window as a solid medium-to-long term investment and lower price in which to finalise procedures for obtaining gold bar trading levels are likely to extract higher levels of demand. Egypt certificates or instead switch to the production and trading of (0.6 tonnes) and Saudi Arabia (4.6 tonnes) generated the gold jewellery. The State Bank of Vietnam announced that the strongest growth, with respective growth rates of 34% and purpose of the Decree was to ‘remedy shortcomings in gold bar 24% year-on-year. Growth in the UAE (3.0 tonnes) and Other management, create a legal foundation to reorganise the gold Gulf countries (0.9 tonnes) was more moderate, at 9% and market and tackle speculation and illegal trading’. The central 13% year-on-year respectively. bank will assume a monopoly on the production, import and export of gold bars when the Decree comes into effect later this Investment demand in Turkey totalled 15.2 tonnes in the first month (May 2012). quarter, a decline of 12% from year-earlier levels. Measured in local currency, the value of demand was 22% higher at TL1.5bn. Price expectations are likely to be a key driver of demand over Viewed on a month-by-month basis, activity throughout the the coming months as government measures to curb inflation quarter was mixed. January saw a sharp decline in demand, have started to take effect, feeding through to a significant largely due to January 2011 having been exceptionally strong for reduction in CPI, thereby reducing the urgency among coin demand. Demand levels remained quiet in February before consumers to purchase gold as an inflation hedge. However, the jumping in March as local prices dipped, prompting a surge in measures taken by the government to stabilise the gold market coin minting. Price expectations among Turkish investors are may lead to increased flows of gold through unofficial channels. mixed, but the heavy promotion of gold investment products by commercial banks and the continued popularity of gold deposit accounts suggest that the prospects are for firm levels of demand over the coming quarters. Gold Demand Trends | First quarter 2012
  • 19. Demand for gold bars and coins in the US amounted to Official sector 13.6 tonnes, a drop of 32% year-on-year. Lower levels of demand for gold eagle and buffalo coins from the US mint Purchases by central banks and official sector institutions (now reflected the weaker investment environment and two-way a component of demand within our data series – please see activity was noted in this market as some investors chose to the “Important note” on page 3), amounted to 80.8 tonnes take profits on some of the holdings that had been built up during the first quarter of the year. The majority of these over the preceding four years. The value of demand was down purchases were made during the final month of the quarter, 17% year-on-year at US$739.2mn. with momentum picking up in March after a fairly subdued start to the year. The year-on-year comparison shows a 41% decline On the face of it, the data seem to show that European markets in net purchases, which reflects the exceptional level of net had a disappointing quarter for investment, with year-on-year demand (137.0 tonnes) that took place during Q1 2011, largely declines seen across the board, with the exception of France, the result of considerable purchases by Mexico of around which managed another quarter of modest net investment. 93 tonnes. However, the quarter was being compared with Q1 2011, a period which saw outstanding levels of investment across the Consistent with its trend of continued purchases, Russia’s region as European sovereign debt concerns were fuelled by central bank bought around 16.5 tonnes in March after selling Ireland’s bailout package, while the gathering pace of Middle almost 4 tonnes in February for the purposes of minting coins. Eastern unrest also stimulated demand. Russia’s gold reserves now amount to 895.7 tonnes, accounting for just under 10% of total reserves. Since the third quarter of 2008 investment demand in European markets has undergone a step-change, establishing itself within Mexico continued to add to its gold reserves in the first quarter, significantly higher ranges compared with pre-crisis levels. reporting purchases of 16.8 tonnes in March. Mexico’s reserves, While the levels of demand seen in the recent quarter may sit which now stand at 122.6 tonnes, have been bolstered by at the lower level of these new ranges, they are nonetheless more than 115 tonnes since the beginning of 2011 and currently well above the average quarterly levels that prevailed prior to account for 4% of total reserves. Mexico confirmed after the Lehman collapse, indicative of a sustained level of investor its purchases last year that it was acquiring gold in line with interest at relatively high levels. prudent diversification principles of reserve management. In Germany demand of 21.3 tonnes was 44% weaker year-on- Purchases by Kazakhstan’s central bank gathered momentum year as investors did not purchase gold with the same urgency during the quarter, totalling 14.2 tonnes over the period. The as in Q1 2011 when they were motivated by global geo-political central bank’s governor announced in September that, starting concerns and euro area difficulties. The decline in the value in January this year, the bank planned to buy the country’s of investment demand (worth €882.9mn) was a slightly more entire gold bullion output over ‘the next two or three years’ to moderate -28%. Switzerland registered a similar quarter, with reduce its exposure to the US dollar. In 2011, mine production investment demand 28% lower year-on-year at 20.2 tonnes, in Kazakhstan was 36.7 tonnes of gold, making it the twentieth a robust result in a historical context. Demand was valued at largest producer globally. CHF1.0bn, 14% lower year-on-year. The Philippines also made net purchases throughout the quarter. German-speaking countries experienced the most sizeable Although IMF information for March is not available, information year-on-year declines, reflecting the fact that these are more on the central bank’s website is indicative of a sizeable purchase ‘mature’ gold investment markets which grew at a rapid pace during the month. The central bank buys domestically produced in the immediate aftermath of the global crisis. Some of the gold, which it either sells or adds to official reserves. smaller, EU accession countries, however, are still relatively Other central banks contributing to the 81 tonnes of demand under-developed in terms of gold investment and continued in the first quarter include Belarus (+5 tonnes), Ukraine growth in these markets was the reason for the more muted (+1.2 tonnes) and Tajikistan (+0.2 tonnes). decline in the ‘Other Europe’ category. Demand here was 14% below year-earlier levels at 18.5 tonnes, equivalent in value terms to €764.8mn which was 9% higher relative to Q1 2011. 18_19
  • 20. Recent IMF data also show that Argentina increased its Supply reserves by around 7.0 tonnes in September 2011, the first increase in its gold reserves for seven years, taking its total The supply of gold from mine production, producer hedging and holdings to 61.7 tonnes. recycling activity totalled 1,070.3 tonnes in the second quarter, increasing by 5% year-on-year. An increase in mine production Central bank sales were virtually non-existent during the quarter. was partially offset by a decline in net producer hedging to Signatories to the third Central Bank Gold Agreement have virtually non-existent levels, resulting in a 2% increase in almost ceased sales of their gold, with occasional small sales total mine supply. Supply from recycled gold increased by announced as related to the sale of gold coins. 39.5 tonnes during the quarter (+11%) to 391.5 tonnes. As was the case last quarter, the 80.8 tonnes of purchases First quarter mine production of 673.8 tonnes of gold was 3% made during Q1 are exclusive of the 14.3 tonnes of net above Q1 2011, representing a volume increase of 20.6 tonnes. additions to Turkey’s gold reserves. These additions are the The bulk of the additional supply was the result of new projects result of a policy change under which the central bank will allow coming on stream and/or the continued ramping up of projects commercial banks to hold a certain proportion of their reserve that entered production from 2009/10 onwards. These projects requirements in the form of ‘standard gold’, in order that the were spread across the globe and the result was a continuation banks may use their gold to improve liquidity. Up to 20% of of the pattern from 2011, in which a diverse range of countries reserve requirements for Turkish lira liabilities and 100% of contributed positively to global growth, while only a small reserve requirements for precious metal deposit accounts, may number of countries generated lower levels of production. now be held in the form of ‘standard gold’. The announcement of this change is available on the Turkish central bank’s website On the positive side, Goldcorp’s Penasquito mine in Mexico at: http://www.tcmb.gov.tr/yeni/eng/ continued to ramp up production at its sulphide ore processing plant, which commenced in September 2010. Staying in the For more information on the recent policy changes at the Latin American region, Chile’s Esperanza copper-gold mine Turkish central bank, please see our Focus piece on page 4 (jointly owned by Antofagasta and Marubeni) also continued to of the report. increase production after being brought online The trend, which has been established in recent years, of net in late 2010/early 2011. central bank gold buying looks set to extend further this year Increased production in Canada was largely from Osisko’s as the main driving factors remain in place. The rapid growth of Canadian Malartic deposit, which poured first gold in April 2011. foreign exchange reserves in a number of expanding economies has required many central banks to increase gold holdings in In Kazakhstan, production continued to ramp up at Altyntau order to maintain the ratio of gold to their foreign exchange Kokshetau, which completed its first year of production in reserves. While, for other countries, central bank concerns with mid-2011. the dominance of the euro and US dollar and their respective Eldorado gold’s Efemçukuru mine in Turkey, which achieved health as international reserves, has prompted a renewed focus commercial production in December 2011, contributed on diversifying reserve assets. to growth in that country, as did a continued ramping up of production at Çöpler, which completed its first year of production in December 2011. Gold Demand Trends | First quarter 2012