Financial analysis adecoagro sa - adecoagro s.a. is an agricultural company in south america, with operations in argentina, brazil and uruguay
•
0 likes•260 views


Recommended
Recommended
More Related Content
What's hot
What's hot (17)
Viewers also liked
Viewers also liked (20)
Similar to Financial analysis adecoagro sa - adecoagro s.a. is an agricultural company in south america, with operations in argentina, brazil and uruguay
Similar to Financial analysis adecoagro sa - adecoagro s.a. is an agricultural company in south america, with operations in argentina, brazil and uruguay (20)
More from BCV
More from BCV (20)
Financial analysis adecoagro sa - adecoagro s.a. is an agricultural company in south america, with operations in argentina, brazil and uruguay
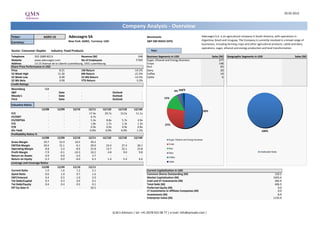
- 1. 20.02.2013 Company Analysis - Overview Ticker: AGRO US Adecoagro SA Benchmark: Adecoagro S.A. is an agricultural company in South America, with operations in New York: AGRO, Currency: USD S&P 500 INDEX (SPX) Argentina, Brazil and Uruguay. The Company is currently involved in a broad range of Currency: businesses, including farming crops and other agricultural products, cattle and dairy operations, sugar, ethanol and energy production and land transformation. Sector: Consumer Staples Industry: Food Products Year: Telephone 352-2689-8213 Revenue (M) 548 Business Segments in USD Sales (M) Geographic Segments in USD Sales (M) Website www.adecoagro.com No of Employees 5'560 Sugar, Ethanol and Energy Business 277 Unallocated Sales 1 Address 13-15 Avenue de la Liberte Luxembourg, 1931 Luxembourg Crops 148 Share Price Performance in USD Rice 83 Price 8.21 1M Return -14.1% Dairy 20 52 Week High 11.30 6M Return -21.5% Coffee 14 52 Week Low 8.00 52 Wk Return -14.5% Cattle 6 52 Wk Beta 0.99 YTD Return -3.2% Credit Ratings Bloomberg IG8 1% S&P - Date - Outlook - 4% 3% Moody's - Date - Outlook - Fitch - Date - Outlook - 15% Valuation Ratios 12/08 12/09 12/10 12/11 12/12E 12/13E 12/14E 50% P/E - - - 17.4x 29.7x 13.5x 11.1x EV/EBIT - - - 6.7x - - - EV/EBITDA - - - 5.3x 8.8x 5.7x 4.9x P/S - - - 1.8x 1.7x 1.3x 1.2x 27% P/B - - - 0.9x 0.9x 0.9x 0.8x Div Yield - - - 0.0% 0.0% 0.0% 1.1% 100% Profitability Ratios % 12/08 12/09 12/10 12/11 12/12E 12/13E 12/14E Sugar, Ethanol and Energy Business Gross Margin 29.7 23.9 10.5 39.3 - - - Crops EBITDA Margin 20.4 15.1 -0.1 29.0 23.4 27.4 30.1 Operating Margin 8.8 5.4 -8.9 22.8 13.7 22.1 23.8 Rice Profit Margin -7.9 -0.1 -10.3 10.2 4.8 9.0 9.8 Unallocated Sales Dairy Return on Assets -2.0 0.0 -3.4 3.7 - - - Coffee Return on Equity -3.3 0.0 -6.0 6.3 1.4 5.4 6.6 Cattle Leverage and Coverage Ratios 12/08 12/09 12/10 12/11 Current Ratio 1.0 1.6 1.2 2.1 Current Capitalization in USD Quick Ratio 0.6 1.0 0.7 1.6 Common Shares Outstanding (M) 120.5 EBIT/Interest 0.4 0.5 -1.0 2.0 Market Capitalization (M) 1003.4 Tot Debt/Capital 0.3 0.3 0.4 0.1 Cash and ST Investments (M) 282.9 Tot Debt/Equity 0.4 0.4 0.5 0.1 Total Debt (M) 406.5 Eff Tax Rate % - - - 20.5 Preferred Equity (M) 0.0 LT Investments in Affiliate Companies (M) 0.0 Investments (M) 8.9 Enterprise Value (M) 1135.9 Q.M.S Advisors | tel: +41 (0)78 922 08 77 | e-mail: info@qmsadv.com |
- 2. Company Analysis - Analysts Ratings Adecoagro SA Target price in USD Broker Recommendation Buy and Sell Recommendations vs Price and Target Price Price Brokers' Target Price 18 18 100% 0% 0% 0% 0% 0% 0% 0% 0% 0% 0% 0% 0% 13% 13% 13% 22% 22% 22% 22% 22% 22% 16 16 25% 29% 29% 80% 14 14 12 12 60% 10 10 8 88% 88% 88% 8 40% 78% 78% 78% 78% 78% 78% 75% 6 71% 71% 6 4 4 20% 2 2 0 Raymond Morgan Securities Credit Suisse Stanley HSBC Banco BTG Pactual SA Itau BBA 0% 0 James févr.12 mars.12 avr.12 mai.12 juin.12 juil.12 août.12 sept.12 oct.12 nov.12 déc.12 janv.13 Buy Hold Sell Price Target Price Date Buy Hold Sell Date Price Target Price Broker Analyst Recommendation Target Date 31-Jan-13 71% 29% 0% 20-Feb-13 8.21 13.82 Itau BBA Securities GIOVANA ARAUJO outperform 15.30 13-Feb-13 31-Dec-12 71% 29% 0% 19-Feb-13 8.29 13.82 Banco BTG Pactual SA THIAGO DUARTE neutral 11.00 30-Jan-13 30-Nov-12 75% 25% 0% 18-Feb-13 8.31 13.82 Morgan Stanley JAVIER MARTINEZ Overwt/No Rating 13.30 9-Jan-13 31-Oct-12 78% 22% 0% 15-Feb-13 8.31 13.82 Raymond James PEDRO J RICHARDS outperform 15.50 4-Jan-13 28-Sep-12 78% 22% 0% 14-Feb-13 8.25 13.82 HSBC PEDRO HERRERA overweight 14.00 17-Sep-12 31-Aug-12 78% 22% 0% 13-Feb-13 8.33 13.82 Credit Suisse LUIZ OTAVIO CAMPOS outperform 14.00 30-Mar-12 31-Jul-12 78% 22% 0% 12-Feb-13 8.40 13.82 29-Jun-12 78% 22% 0% 11-Feb-13 8.54 13.82 31-May-12 78% 22% 0% 8-Feb-13 8.50 13.82 30-Apr-12 88% 13% 0% 7-Feb-13 8.52 13.74 30-Mar-12 88% 13% 0% 6-Feb-13 8.50 13.74 29-Feb-12 88% 13% 0% 5-Feb-13 8.55 13.74 4-Feb-13 8.56 13.74 1-Feb-13 8.74 13.74 31-Jan-13 8.50 13.74 30-Jan-13 8.18 13.74 29-Jan-13 8.55 13.74 28-Jan-13 9.11 13.74 25-Jan-13 9.17 13.74 24-Jan-13 9.00 13.74 23-Jan-13 9.45 13.74 22-Jan-13 9.45 13.74 21-Jan-13 9.56 13.74 18-Jan-13 9.56 13.74 17-Jan-13 9.46 13.74 16-Jan-13 9.06 13.54 15-Jan-13 9.30 13.54 14-Jan-13 9.06 13.54 11-Jan-13 8.94 13.54 10-Jan-13 8.90 13.54 Q.M.S Advisors | tel: +41 (0)78 922 08 77 | e-mail: info@qmsadv.com |
- 3. 20.02.2013 Adecoagro SA Company Analysis - Ownership Ownership Type Ownership Statistics Geographic Ownership Distribution Geographic Ownership 1%2% Shares Outstanding (M) 120.5 United States 63.97% Float 59.4% Netherlands 16.38% 2% 2% 1%1% 3% Short Interest (M) 0.9 Cayman Islands 10.39% Short Interest as % of Float 1.30% Luxembourg 2.65% 10% Days to Cover Shorts 0.96 Unknown Country 2.24% Institutional Ownership 96.58% Britain 1.80% Retail Ownership 1.23% Germany 1.45% 65% Insider Ownership 2.19% Others 1.12% 16% Institutional Ownership Distribution 97% Hedge Fund Manager 47.47% Investment Advisor 34.25% Pension Fund (Erisa) 12.73% United States Netherlands Cayman Islands Institutional Ownership Retail Ownership Insider Ownership Mutual Fund Manager 2.49% Luxembourg Unknown Country Britain Pricing data is in USD Others 3.07% Germany Others Top 20 Owners: TOP 20 ALL Institutional Ownership Holder Name Position Position Change Market Value % of Ownership Report Date Source Country SOROS FUND MANAGEMEN 25'911'633 0 212'734'507 21.20% 31.12.2012 13F UNITED STATES 2% 3% SOROS FUND MANAGEMEN 25'911'633 0 212'734'507 21.20% 31.12.2012 Research UNITED STATES HBK INVESTMENTS LP 20'471'770 0 168'073'232 16.75% 31.12.2011 20F UNITED STATES 13% STICHTING PENSIOEN Z 15'307'824 0 125'677'235 12.53% 31.12.2011 20F NETHERLANDS AL GHARRAFA INVESTME 12'562'906 0 103'141'458 10.28% 31.12.2011 20F CAYMAN ISLANDS 48% OSPRAIE MANAGEMENT L 10'819'581 352'858 88'828'760 8.85% 31.12.2012 13F UNITED STATES WELLINGTON MANAGEMEN 4'503'722 -50'952 36'975'558 3.69% 31.12.2012 13F UNITED STATES PGGM VERMOGENSBEHEER 4'500'000 0 36'945'000 3.68% 31.12.2012 13F NETHERLANDS JENNISON ASSOCIATES 4'439'252 -127'838 36'446'259 3.63% 31.12.2012 13F UNITED STATES 34% GLOBAL THEMATIC PART 3'014'059 175'217 24'745'424 2.47% 31.12.2012 13F UNITED STATES DWS INVESTMENT S A 2'583'144 142'917 21'207'612 2.11% 28.12.2012 MF-AGG LUXEMBOURG INVESTEC ASSET MANAG 1'942'700 54'600 15'949'567 1.59% 31.12.2012 13F BRITAIN VAN ECK ASSOCIATES C 1'807'739 -51'551 14'841'537 1.48% 31.12.2012 13F UNITED STATES VAN ECK ASSOCIATES C 1'800'727 -856 14'783'969 1.47% 15.02.2013 MF-AGG UNITED STATES Hedge Fund Manager Investment Advisor Pension Fund (Erisa) Mutual Fund Manager Others DEUTSCHE BANK AG 1'577'262 -150'660 12'949'321 1.29% 31.12.2012 13F GERMANY INVESTEC ASSET MANAG 1'471'100 -25'000 12'077'731 1.20% 30.11.2012 MF-AGG GUERNSEY BOYCE ALAN LELAND 1'393'169 362'859 11'437'917 1.14% 31.12.2011 20F n/a VIEIRA MARCELO 1'105'331 280'769 9'074'768 0.90% 31.12.2011 20F n/a NEUBERGER BERMAN LLC 713'850 -547'601 5'860'709 0.58% 31.12.2012 13F UNITED STATES NUVEEN ASSET MANAGEM 534'992 534'992 4'392'284 0.44% 31.01.2013 MF-AGG UNITED STATES Top 5 Insiders: Holder Name Position Position Change Market Value % of Ownership Report Date Source BOYCE ALAN LELAND 1'393'169 362'859 11'437'917 1.14% 31.12.2011 20F VIEIRA MARCELO 1'105'331 280'769 9'074'768 0.90% 31.12.2011 20F BOSCH MARIANO 182'507 51'561 1'498'382 0.15% 31.12.2011 20F 2.19% Q.M.S Advisors | tel: +41 (0)78 922 08 77 | e-mail: info@qmsadv.com |
- 4. Company Analysis - Financials I/IV Adecoagro SA Financial information is in USD (M) Equivalent Estimates Periodicity: Fiscal Year 12/01 12/02 12/03 12/04 12/05 12/06 12/07 12/08 12/09 12/10 12/11 12/12E 12/13E 12/14E Income Statement Revenue 143 244 314 426 548 592 781 828 - Cost of Goods Sold 109 172 239 381 333 Gross Income 33 73 75 45 215 - Selling, General & Admin Expenses 5 51 58 83 90 (Research & Dev Costs) Operating Income 28 21 17 -38 125 81 173 198 - Interest Expense 12 51 34 39 62 - Foreign Exchange Losses (Gains) - Net Non-Operating Losses (Gains) -13 -3 -12 -17 -9 Pretax Income 29 -27 -6 -61 72 25 90 140 - Income Tax Expense -0 -10 -5 -16 15 Income Before XO Items 29 -16 -0 -45 57 - Extraordinary Loss Net of Tax 0 0 0 0 - Minority Interests -1 3 -0 -1 1 Diluted EPS Before XO Items 0.10 (0.05) (0.00) (0.36) 0.48 Net Income Adjusted* 45 29 70 81 EPS Adjusted 0.28 0.61 0.74 Dividends Per Share 0.00 0.00 0.00 0.00 0.00 0.00 0.00 0.09 Payout Ratio % 0.0 0.0 0.00 0.00 0.12 Total Shares Outstanding 298 423 473 120 121 Diluted Shares Outstanding 298 423 120 122 118 EBITDA 37 50 47 -1 159 139 214 249 *Net income excludes extraordinary gains and losses and one-time charges. Q.M.S Advisors | tel: +41 (0)78 922 08 77 | e-mail: info@qmsadv.com |
- 5. Company Analysis - Financials II/IV Periodicity: 12/01 12/02 12/03 12/04 12/05 12/06 12/07 12/08 12/09 12/10 12/11 12/12E 12/13E 12/14E Balance Sheet Total Current Assets 254.454 282.775 299.126 330.061 629.854 + Cash & Near Cash Items 71 93 75 70 331 + Short Term Investments 0 0 0 0 0 + Accounts & Notes Receivable 79 76 106 119 141 + Inventories 58 61 58 57 96 + Other Current Assets 47 52 60 83 62 Total Long-Term Assets 691 745 970 1'011 1'071 + Long Term Investments 4 9 43 52 44 Gross Fixed Assets 567 629 770 877 919 Accumulated Depreciation 29 57 87 125 159 + Net Fixed Assets 538 571 683 752 760 + Other Long Term Assets 149 165 244 207 268 Total Current Liabilities 146 283 190 269 296 + Accounts Payable 33 47 62 12 114 + Short Term Borrowings 98 224 104 252 158 + Other Short Term Liabilities 15 12 25 6 24 Total Long Term Liabilities 182 106 322 349 310 + Long Term Borrowings 62 4 203 139 0 + Other Long Term Borrowings 120 102 119 210 310 Total Liabilities 328 390 512 618 606 + Long Preferred Equity 0 0 0 0 0 + Minority Interest 49 45 0 15 15 + Share Capital & APIC 476 628 697 683 1'107 + Retained Earnings & Other Equity 92 -35 60 25 -27 Total Shareholders Equity 617 638 757 723 1'095 Total Liabilities & Equity 945 1'028 1'269 1'341 1'701 Book Value Per Share 1.91 1.40 1.60 5.90 8.96 8.95 9.53 10.36 Tangible Book Value Per Share 1.83 1.36 1.55 5.66 8.65 Q.M.S Advisors | tel: +41 (0)78 922 08 77 | e-mail: info@qmsadv.com |
- 6. Company Analysis - Financials III/IV Periodicity: 12/01 12/02 12/03 12/04 12/05 12/06 12/07 12/08 12/09 12/10 12/11 12/12E 12/13E 12/14E Cash Flows Net Income 29 -19 -0 -44 56 13 65 + Depreciation & Amortization 9 28 30 38 34 + Other Non-Cash Adjustments -65 -44 -21 73 29 + Changes in Non-Cash Capital -42 -17 -55 -39 -62 Cash From Operating Activities -68 -52 -46 27 57 + Disposal of Fixed Assets 4 3 7 12 3 + Capital Expenditures -130 -186 -98 -88 -90 -335 -287 -204 + Increase in Investments 0 0 0 0 + Decrease in Investments 0 0 0 0 + Other Investing Activities -121 25 -24 -36 -53 Cash From Investing Activities -247 -157 -114 -112 -140 + Dividends Paid + Change in Short Term Borrowings 68 19 7 12 20 + Increase in Long Term Borrowings 51 19 80 67 35 + Decrease in Long Term Borrowings 0 0 0 0 -82 + Increase in Capital Stocks 0 0 0 0 + Decrease in Capital Stocks 0 0 0 0 + Other Financing Activities 0 0 55 0 372 Cash From Financing Activities 118 38 142 80 344 Net Changes in Cash -197 -172 -19 -5 260 Free Cash Flow (CFO-CAPEX) -198 -239 -144 -61 -34 -212 -205 -47 Free Cash Flow To Firm 16 Free Cash Flow To Equity -198 -49 31 -59 Free Cash Flow per Share -0.69 -0.58 -1.20 -0.50 -0.29 Q.M.S Advisors | tel: +41 (0)78 922 08 77 | e-mail: info@qmsadv.com |
- 7. Company Analysis - Financials IV/IV Periodicity: 12/01 12/02 12/03 12/04 12/05 12/06 12/07 12/08 12/09 12/10 12/11 12/12E 12/13E 12/14E Ratio Analysis Valuation Ratios Price Earnings 17.4x 29.7x 13.5x 11.1x EV to EBIT 6.7x EV to EBITDA 5.3x 8.8x 5.7x 4.9x Price to Sales 1.8x 1.7x 1.3x 1.2x Price to Book 0.9x 0.9x 0.9x 0.8x Dividend Yield 0.0% 0.0% 0.0% 1.1% Profitability Ratios Gross Margin 23.3% 29.7% 23.9% 10.5% 39.3% EBITDA Margin 26.3% 20.4% 15.1% -0.1% 29.0% 23.4% 27.4% 30.1% Operating Margin 19.7% 8.8% 5.4% -8.9% 22.8% 13.7% 22.1% 23.8% Profit Margin 20.5% -7.9% -0.1% -10.3% 10.2% 4.8% 9.0% 9.8% Return on Assets -2.0% 0.0% -3.4% 3.7% Return on Equity -3.3% 0.0% -6.0% 6.3% 1.4% 5.4% 6.6% Leverage & Coverage Ratios Current Ratio 1.75 1.00 1.57 1.23 2.13 Quick Ratio 1.03 0.60 0.95 0.70 1.59 Interest Coverage Ratio (EBIT/I) 2.26 0.42 0.50 -0.97 2.00 Tot Debt/Capital 0.21 0.26 0.29 0.35 0.13 Tot Debt/Equity 0.26 0.36 0.41 0.54 0.14 Others Asset Turnover 0.25 0.27 0.33 0.36 Accounts Receivable Turnover 3.15 3.44 3.78 4.21 Accounts Payable Turnover 4.37 4.33 10.31 5.91 Inventory Turnover 2.88 4.01 6.63 4.34 Effective Tax Rate 20.5% Q.M.S Advisors | tel: +41 (0)78 922 08 77 | e-mail: info@qmsadv.com |
- 8. Company Analysis - Peers Comparision MOLINOS RIO ADECOAGRO SA CRESUD SA COSAN LTD - A ARCHER-DANIELS INGREDION INC SLC AGRICOLA SA BRASILAGRO SAO MARTINHO COSAN PLAT Latest Fiscal Year: 12/2011 06/2012 03/2012 06/2012 12/2011 12/2012 12/2011 06/2012 03/2012 03/2012 52-Week High 11.30 7.62 21.14 33.98 30.90 70.42 24.80 10.30 29.70 48.44 52-Week High Date 19.03.2012 01.02.2013 07.02.2013 10.05.2012 30.01.2013 17.01.2013 20.07.2012 24.01.2013 24.01.2013 08.02.2013 52-Week Low 8.00 4.40 11.27 24.38 16.60 45.30 15.55 6.66 17.50 28.43 52-Week Low Date 28.12.2012 04.06.2012 11.06.2012 15.11.2012 08.05.2012 17.07.2012 24.02.2012 23.05.2012 24.05.2012 24.05.2012 Daily Volume 90'149 10'460 211'838 2'982'517 15'915 187'291 109'900 6'200 41'500 407'500 Current Price (2/dd/yy) 8.21 6.70 20.41 32.68 26.70 66.72 19.85 9.94 26.51 46.56 52-Week High % Change -27.3% -12.1% -3.5% -3.8% -13.6% -5.2% -20.0% -3.5% -10.7% -3.9% 52-Week Low % Change 2.6% 52.3% 81.1% 34.0% 60.8% 47.3% 27.7% 49.2% 51.5% 63.8% Total Common Shares (M) 120.5 501.6 270.7 659.0 250.4 77.0 97.5 58.4 112.3 404.3 Market Capitalization 1'003.4 3'360.5 5'524.7 21'521.9 6'687.0 5'107.8 1'963.1 580.7 2'995.6 18'959.9 Total Debt 158.2 3'883.2 5'199.4 10'320.0 3'199.8 1'800.0 882.4 94.4 1'232.4 5'014.1 Preferred Stock - - - - - - - - - - Minority Interest 15.0 1'990.8 3'904.3 200.0 - 22.0 - - - 464.6 Cash and Equivalents 330.5 586.6 1'654.1 1'729.0 751.2 628.0 130.5 67.5 417.1 1'616.2 Enterprise Value 1'214.1 8'647.8 20'292.6 28'054.9 11'188.3 6'301.8 2'791.7 579.7 4'082.7 32'028.1 Valuation Total Revenue LFY 548.1 3'457.8 24'096.9 89'038.0 12'795.5 6'532.1 1'005.6 146.2 1'367.0 24'096.9 LTM 515.0 3'457.8 27'348.9 90'559.0 15'765.2 6'532.1 1'143.4 175.0 1'491.6 27'348.9 CY+1 592.0 3'138.0 28'566.0 89'986.3 - 6'918.4 1'148.2 182.5 1'598.4 30'880.2 CY+2 781.0 3'166.0 34'337.7 89'123.8 - 7'073.2 1'255.3 193.0 1'955.6 35'485.1 EV/Total Revenue LFY 2.6x 2.2x 0.7x 0.3x 0.8x 0.9x 2.9x 4.0x 2.8x 1.2x LTM 2.5x 2.2x 0.7x 0.3x 0.7x 0.9x 2.6x 3.3x 2.6x 1.1x CY+1 2.2x 2.8x 0.8x - - 0.9x 2.2x 3.9x 2.5x 0.9x CY+2 1.9x 2.8x 0.6x - - - 2.0x 3.9x 2.1x 0.8x EBITDA LFY 159.0 893.3 1'992.3 2'890.0 268.0 914.6 325.9 4.3 581.2 5'338.7 LTM 131.4 981.7 2'010.4 2'827.0 474.1 914.7 234.6 22.3 476.2 2'707.3 CY+1 138.5 1'228.0 2'949.0 3'339.0 - 943.8 271.9 40.7 661.3 2'892.8 CY+2 214.0 1'253.0 3'888.0 3'911.8 - 1'006.8 294.4 48.6 836.2 3'740.1 EV/EBITDA LFY 9.1x 8.6x 9.0x 8.5x 40.2x 6.7x 9.1x 136.5x 6.5x 5.6x LTM 11.0x 7.8x 8.9x 8.7x 22.7x 6.7x 12.6x 26.1x 7.9x 11.1x CY+1 9.6x 7.1x 7.5x - - 6.3x 9.2x 17.3x 6.0x 9.3x CY+2 7.1x 7.0x 5.6x - - - 8.4x 15.4x 5.0x 7.3x EPS LFY 0.48 0.04 4.40 2.29 1.11 5.57 0.83 -0.32 1.12 6.34 LTM -0.25 0.20 1.77 2.38 0.28 5.58 -0.59 -0.15 0.49 1.86 CY+1 0.28 1.50 2.04 2.53 - 5.83 0.62 0.25 1.22 1.76 CY+2 0.61 2.76 2.75 3.02 - 6.42 1.20 0.08 1.89 2.46 P/E LFY - 34.4x 22.6x 13.7x 96.8x 12.0x - - 53.8x 25.0x LTM - 74.9x 22.6x 13.7x 97.0x 12.0x - - 32.1x 25.3x CY+1 29.7x 4.5x 19.6x 12.9x - 11.4x 31.8x 40.6x 21.7x 26.4x CY+2 13.5x 2.4x 14.6x 10.8x - 10.4x 16.6x 132.5x 14.0x 18.9x Revenue Growth 1 Year 28.6% 36.1% 33.4% 10.4% 15.3% 5.0% 13.2% 83.8% 5.6% 33.4% 5 Year - - 77.2% 9.3% 33.8% 14.0% 35.3% 595.7% 28.4% 83.9% EBITDA Growth 1 Year - (3.1%) (26.2%) (19.0%) (69.4%) 2.5% 58.3% 46.2% 2.7% 159.8% 5 Year - 83.9% 17.2% 1.0% 3.1% 14.1% - - 18.6% 41.9% EBITDA Margin LTM 22.4% 28.4% 8.0% 3.1% 3.0% 14.0% 20.5% 12.8% 32.2% 9.9% CY+1 23.4% 39.1% 10.3% 3.7% - 13.6% 23.7% 22.3% 41.4% 9.4% CY+2 27.4% 39.6% 11.3% 4.4% - 14.2% 23.5% 25.2% 42.8% 10.5% Leverage/Coverage Ratios Total Debt / Equity % 14.6% 188.2% 93.2% 57.4% 233.5% 73.3% 46.0% 16.9% 60.9% 54.8% FALSE FALSE FALSE FALSE Total Debt / Capital % 12.6% 48.9% 35.4% 36.2% 70.0% 42.1% 31.5% 14.4% 37.8% 34.3% FALSE FALSE FALSE FALSE Total Debt / EBITDA 3.094x 3.956x 2.936x 3.375x 11.165x 1.968x 4.023x 3.555x 3.791x 4.307x FALSE FALSE FALSE FALSE Net Debt / EBITDA 0.941x 3.358x 1.992x 2.311x 9.495x 1.281x 3.337x -0.045x 2.283x 3.449x FALSE FALSE FALSE FALSE EBITDA / Int. Expense 2.550x 2.210x 3.388x 6.451x 2.360x 13.570x 9.748x 0.573x 7.945x 9.844x FALSE FALSE FALSE FALSE Credit Ratings S&P LT Credit Rating - - BB A *- - BBB - - BB+ BB FALSE FALSE FALSE FALSE S&P LT Credit Rating Date - - 21.10.2010 19.10.2012 - 24.11.2008 - - 22.12.2011 21.10.2010 FALSE FALSE FALSE FALSE Moody's LT Credit Rating - - - A2 - Baa2 - - - WR FALSE FALSE FALSE FALSE Moody's LT Credit Rating Date - - - 12.11.2004 - 14.02.2008 - - - 15.05.2011 FALSE FALSE FALSE FALSE Q.M.S Advisors | tel: +41 (0)78 922 08 77 | e-mail: info@qmsadv.com |