Financial analysis credit suisse group ag is an international financial services group. the group provides investment banking, private banking, and asset management services to customers located around the world
•
1 recomendación•1,683 vistas


Recomendados
Recomendados
Más contenido relacionado
Similar a Financial analysis credit suisse group ag is an international financial services group. the group provides investment banking, private banking, and asset management services to customers located around the world
Similar a Financial analysis credit suisse group ag is an international financial services group. the group provides investment banking, private banking, and asset management services to customers located around the world (20)
Más de BCV
Más de BCV (20)
Último
Último (20)
Financial analysis credit suisse group ag is an international financial services group. the group provides investment banking, private banking, and asset management services to customers located around the world
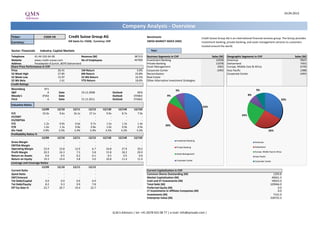
- 1. 24.04.2013 Ticker: Credit Suisse Group AG Benchmark: Currency: SIX Swiss Ex: CSGN, Currency: CHF SWISS MARKET INDEX (SMI) Sector: Financials Industry: Capital Markets Year: Telephone 41-44-332-64-00 Revenue (M) Business Segments in CHF Sales (M) Geographic Segments in CHF Sales (M) Website www.credit-suisse.com No of Employees Investment Banking 12558 Americas 9507 Address Paradeplatz 8 Zurich, 8070 Switzerland Private Banking 11078 Switzerland 7455 Share Price Performance in CHF Asset Management 2463 Europe, Middle East & Africa 6749 Price 26.41 1M Return 3.0% Corporate Center -2493 Asia Pacific 2388 52 Week High 27.85 6M Return 23.8% Reconciliation Corporate Center -2493 52 Week Low 15.97 52 Wk Return 16.5% Real Estate 52 Wk Beta 1.61 YTD Return 18.6% Other Alternative Investment Strategies Credit Ratings Bloomberg HY1 S&P A Date 19.12.2008 Outlook NEG Moody's (P)A2 Date - Outlook STABLE Fitch A Date 15.12.2011 Outlook STABLE Valuation Ratios 12/09 12/10 12/11 12/12 12/13E 12/14E 12/15E P/E 10.0x 9.6x 16.1x 27.1x 9.9x 8.7x 7.9x EV/EBIT - - - - - - - EV/EBITDA - - - - - - - P/S 1.2x 0.9x 0.6x 0.7x 1.5x 1.5x 1.4x P/B 1.6x 1.3x 0.8x 0.8x 1.0x 0.9x 0.9x Div Yield 3.9% 3.5% 3.4% 3.4% 3.5% 4.2% 5.2% Profitability Ratios % 12/09 12/10 12/11 12/12 12/13E 12/14E 12/15E Gross Margin - - - - - - - EBITDA Margin - - - - - - - Operating Margin 23.9 23.8 12.9 6.7 24.8 27.9 29.2 Profit Margin 20.3 16.3 7.5 5.8 15.8 18.2 20.0 Return on Assets 0.6 0.5 0.2 0.1 0.5 0.5 0.6 Return on Equity 19.3 14.4 5.8 3.0 10.8 11.4 11.4 Leverage and Coverage Ratios 12/09 12/10 12/11 12/12 Current Ratio - - - - Current Capitalization in CHF Quick Ratio - - - - Common Shares Outstanding (M) 1293.8 EBIT/Interest - - - - Market Capitalization (M) 40661.3 Tot Debt/Capital 0.9 0.9 0.9 0.9 Cash and ST Investments (M) 59023.0 Tot Debt/Equity 8.2 9.3 9.9 7.8 Total Debt (M) 329966.0 Eff Tax Rate % 22.7 20.7 19.4 22.7 Preferred Equity (M) 0.0 LT Investments in Affiliate Companies (M) 0.0 Investments (M) 7121.0 Enterprise Value (M) 318725.3 Credit Suisse Group AG is an international financial services group. The Group provides investment banking, private banking, and asset management services to customers located around the world. CSGN VX 38'313 46'900 Company Analysis - Overview 43% 39% 9% 9% Investment Banking Private Banking Asset Management Corporate Center 33% 26% 24% 8% 9% Americas Switzerland Europe, Middle East & Africa Asia Pacific Corporate Center Q.M.S Advisors | tel: +41 (0)78 922 08 77 | e-mail: info@qmsadv.com |
- 2. Credit Suisse Group AG Target price in CHF Date Buy Hold Sell Date Price Target Price Broker Analyst Recommendation Target Date 29-Mar-13 41% 49% 10% 24-Apr-13 26.41 27.86 Keefe, Bruyette & Woods ANDREW STIMPSON outperform 34.40 24-Apr-13 28-Feb-13 43% 48% 10% 23-Apr-13 26.45 28.09 Oddo & Cie JEAN SASSUS neutral 28.00 24-Apr-13 31-Jan-13 40% 45% 15% 22-Apr-13 26.24 28.05 Canaccord Genuity Corp ARUN MELMANE hold 29.00 24-Apr-13 31-Dec-12 26% 62% 13% 19-Apr-13 25.53 28.04 Nomura JON PEACE buy 32.00 24-Apr-13 30-Nov-12 27% 61% 12% 18-Apr-13 25.27 28.04 AlphaValue DIETER HEIN reduce 24.80 23-Apr-13 31-Oct-12 27% 56% 17% 17-Apr-13 25.74 27.90 Deutsche Bank MATT SPICK hold 29.00 22-Apr-13 28-Sep-12 26% 52% 21% 16-Apr-13 26.45 28.01 Goldman Sachs JERNEJ OMAHEN neutral/neutral 30.80 22-Apr-13 31-Aug-12 26% 52% 21% 15-Apr-13 26.26 28.01 Commerzbank Corporates & Markets MICHAEL DUNST hold 27.00 18-Apr-13 31-Jul-12 24% 52% 24% 12-Apr-13 26.10 28.01 Bank Vontobel AG TERESA NIELSEN hold 27.00 18-Apr-13 29-Jun-12 26% 48% 26% 11-Apr-13 26.31 28.01 Liberum Capital Ltd CORMAC LEECH hold 25.00 18-Apr-13 31-May-12 29% 46% 24% 10-Apr-13 26.07 28.19 Bankhaus Lampe NEIL SMITH sell 24.50 17-Apr-13 30-Apr-12 29% 46% 24% 9-Apr-13 24.89 28.19 Exane BNP Paribas DANIEL DAVIES outperform 32.00 17-Apr-13 8-Apr-13 24.35 28.19 Berenberg Bank JAMES CHAPPELL sell 13.00 11-Apr-13 5-Apr-13 24.49 28.19 Day by Day VALERIE GASTALDY buy 30.58 10-Apr-13 4-Apr-13 24.44 28.26 Redburn Partners NICHOLAS WATTS neutral 8-Apr-13 3-Apr-13 25.09 28.26 Bankhaus Metzler GUIDO HOYMANN sell 22.20 5-Apr-13 2-Apr-13 25.49 28.26 RBC Capital Markets FIONA SWAFFIELD outperform 30.00 4-Apr-13 1-Apr-13 24.91 28.53 Societe Generale DIRK HOFFMANN-BECKING buy 33.00 3-Apr-13 29-Mar-13 24.91 28.53 Grupo Santander AURELIA FAURE hold 20.40 2-Apr-13 28-Mar-13 24.91 28.53 Helvea TIM DAWSON neutral 27.00 27-Mar-13 27-Mar-13 25.35 28.53 Mediobanca SpA CHRISTOPHER J WHEELER outperform 31.00 25-Mar-13 26-Mar-13 25.33 28.53 Morgan Stanley HUW VAN STEENIS Overwt/In-Line 30.00 15-Mar-13 25-Mar-13 24.95 28.53 JPMorgan KIAN ABOUHOSSEIN overweight 34.00 11-Mar-13 22-Mar-13 25.65 28.53 CA Cheuvreux CHRISTIAN STARK select list 30.00 11-Mar-13 21-Mar-13 25.31 28.53 Macquarie PIERS BROWN outperform 30.00 5-Mar-13 20-Mar-13 25.69 28.53 DZ Bank AG CHRISTOPH BAST sell 24.00 19-Feb-13 19-Mar-13 25.55 28.53 Barclays JEREMY SIGEE equalweight 27.00 12-Feb-13 18-Mar-13 26.24 28.53 Zuercher Kantonalbank ANDREAS VENDITTI market perform 11-Feb-13 15-Mar-13 26.89 28.53 Main First Bank AG KILIAN MAIER outperform 30.00 11-Feb-13 14-Mar-13 26.86 28.53 Natixis ANTOINE BURGARD neutral 24.00 8-Feb-13 Company Analysis - Analysts Ratings Buy and Sell Recommendations vs Price and Target Price 29% 29% 26% 24% 26% 26% 27% 27% 26% 40% 43% 41% 46% 46% 48% 52% 52% 52% 56% 61% 62% 45% 48% 49% 24% 24% 26% 24% 21% 21% 17% 12% 13% 15% 10% 10% 0% 20% 40% 60% 80% 100% avr.12 mai.12 juin.12 juil.12 août.12 sept.12 oct.12 nov.12 déc.12 janv.13 févr.13 mars.13 BrokerRecommendation 0 5 10 15 20 25 30 Price Buy Hold Sell Price Target Price Brokers' Target Price 0 5 10 15 20 25 30 35 40 Keefe,Bruyette&Woods Oddo&Cie CanaccordGenuityCorp Nomura AlphaValue DeutscheBank GoldmanSachs CommerzbankCorporates& BankVontobelAG LiberumCapitalLtd BankhausLampe ExaneBNPParibas BerenbergBank DaybyDay RedburnPartners BankhausMetzler RBCCapitalMarkets SocieteGenerale GrupoSantander Helvea MediobancaSpA MorganStanley JPMorgan CACheuvreux Macquarie DZBankAG Barclays ZuercherKantonalbank MainFirstBankAG Natixis S&PCapitalIQ IndependentResearchGmbH KeplerCapitalMarkets AhorroCorporacionFinanciera EspiritoSantoInvestmentBank LandesbankBaden- EVADimensions HSBC Nord/LB HammerPartnersSA Q.M.S Advisors | tel: +41 (0)78 922 08 77 | e-mail: info@qmsadv.com |
- 3. 24.04.2013 Credit Suisse Group AG Ownership Statistics Geographic Ownership Distribution Shares Outstanding (M) 1293.8 United States 54.37% Float 91.6% Austria 11.02% Short Interest (M) Qatar 10.19% Short Interest as % of Float Switzerland 6.22% Days to Cover Shorts Norway 5.04% Institutional Ownership 52.03% France 4.35% Retail Ownership 47.78% Luxembourg 3.02% Insider Ownership 0.19% Others 5.79% Institutional Ownership Distribution Investment Advisor 83.63% Government 15.14% Pension Fund (Erisa) 0.56% Individual 0.37% Pricing data is in CHF Others 0.30% Top 20 Owners: Holder Name Position Position Change Market Value % of Ownership Report Date Source Country FRANKLIN RESOURCES 88'790'736 134'170 2'344'963'338 5.77% 31.12.2012 ULT-AGG UNITED STATES CRESCENT HOLDING GMB 88'475'201 0 2'336'630'058 5.75% 25.02.2013 EXCH AUSTRIA QATAR INVESTMENT AUT 81'886'795 0 2'162'630'256 5.32% 31.12.2012 Co File QATAR DODGE & COX 66'037'738 0 1'744'056'661 4.29% 31.12.2012 Co File UNITED STATES NORGES BANK 39'815'613 0 1'051'530'339 2.59% 12.03.2013 EXCH NORWAY BLACKROCK 39'622'643 0 1'046'434'002 2.57% 22.04.2013 ULT-AGG UNITED STATES HARRIS ASSOCIATES LP 39'622'643 0 1'046'434'002 2.57% 31.12.2012 Co File UNITED STATES CAPITAL GROUP COMPAN 39'396'381 5'348'082 1'040'458'422 2.56% 31.03.2013 ULT-AGG UNITED STATES MORGAN STANLEY 32'818'874 12'068'962 866'746'462 2.13% 28.06.2010 ULT-AGG UNITED STATES AXA 32'002'938 -26'636'525 845'197'593 2.08% 25.08.2009 ULT-AGG FRANCE VANGUARD GROUP INC 18'487'508 2'658'228 488'255'086 1.20% 31.03.2013 MF-AGG UNITED STATES CREDIT SUISSE ASSET 18'009'256 -420'940 475'624'451 1.17% 28.02.2013 MF-AGG SWITZERLAND T ROWE PRICE ASSOCIA 10'920'531 1'000'906 288'411'224 0.71% 31.03.2013 MF-AGG UNITED STATES UBS FUND MANAGEMENT 10'430'028 -17'909 275'457'039 0.68% 28.12.2012 MF-AGG SWITZERLAND PICTET & CIE 6'196'536 57'768 163'650'516 0.40% 31.01.2013 MF-AGG SWITZERLAND ONTARIO TEACHERS PEN 4'500'000 0 118'845'000 0.29% 31.12.2011 Research CANADA FMR LLC 4'473'231 2'840'511 118'138'031 0.29% 28.02.2013 ULT-AGG UNITED STATES CREDIT SUISSE 4'287'758 -32'944'156 113'239'689 0.28% 05.04.2013 EXCH SWITZERLAND SWISSCANTO FONDSLEIT 4'158'113 -2'604'905 109'815'764 0.27% 28.02.2013 MF-AGG SWITZERLAND TEMPLETON INVESTMENT 4'030'117 -17'300 106'435'390 0.26% 31.12.2012 MF-AGG BRITAIN Top 5 Insiders: Holder Name Position Position Change Market Value % of Ownership Report Date Source DOUGAN BRADY W 906'929 23'951'995 0.06% 31.12.2012 Co File SHAFIR ROBERT S 387'544 10'235'037 0.03% 31.12.2012 Co File KIELHOLZ WALTER B 292'424 7'722'918 0.02% 31.12.2012 Co File ROHNER URS 244'422 6'455'185 0.02% 31.12.2012 Co File THORNBURGH RICHARD E 218'456 5'769'423 0.01% 31.12.2012 Co File Company Analysis - Ownership Ownership Type 52% 48% 0% Institutional Ownership Retail Ownership Insider Ownership Geographic Ownership 55% 6% 10% 5% 6% 4% 3% 11% United States Austria Qatar Switzerland Norway France Luxembourg Others Institutional Ownership 84% 1% 0%0% 15% Investment Advisor Government Pension Fund (Erisa) Individual Others TOP 20 ALL Q.M.S Advisors | tel: +41 (0)78 922 08 77 | e-mail: info@qmsadv.com |
- 4. Credit Suisse Group AG Financial information is in CHF (M) Periodicity: 12/02 12/03 12/04 12/05 12/06 12/07 12/08 12/09 12/10 12/11 12/12 12/13E 12/14E 12/15E Income Statement Revenue 52'487 67'990 73'021 59'366 82'160 93'174 48'697 51'547 50'345 42'693 38'313 26'589 27'487 28'202 - Cost of Goods Sold Gross Income - Selling, General & Admin Expenses 30'586 45'717 43'696 21'326 21'864 22'925 21'003 22'714 21'830 20'585 19'840 (Research & Dev Costs) Operating Income -3'658 3'456 8'387 7'106 14'432 13'491 -14'816 7'933 7'454 3'360 1'573 6'586 7'671 8'226 - Interest Expense - Foreign Exchange Losses (Gains) - Net Non-Operating Losses (Gains) 172 1'645 85 -295 132 -249 86 -144 -33 -101 -608 Pretax Income -3'250 1'811 8'302 7'401 14'300 13'740 -14'902 8'077 7'487 3'461 2'181 6'115 7'147 7'931 - Income Tax Expense 596 -3 1'441 927 2'389 1'248 -4'596 1'835 1'548 671 496 Income Before XO Items -3'846 1'814 6'861 6'474 11'911 12'492 -10'306 6'242 5'939 2'790 1'685 - Extraordinary Loss Net of Tax -520 1'075 106 -1'324 -3'046 -6 531 -169 19 0 0 - Minority Interests -17 -31 1'127 1'948 3'630 4'738 -2'619 -313 822 837 336 Diluted EPS Before XO Items 0.63 4.75 3.90 7.19 6.95 (7.33) 5.01 3.91 1.36 0.81 Net Income Adjusted* -3'829 4'680 5'734 5'863 8'281 8'549 -7'687 6'555 5'117 2'406 3'054 4'208 5'012 5'633 EPS Adjusted (3.22) 3.87 5.05 5.18 7.53 7.65 (7.28) 5.15 3.93 1.69 2.39 2.66 3.05 3.35 Dividends Per Share 0.10 1.50 2.00 2.24 2.50 0.10 2.00 1.30 0.75 0.75 0.92 1.11 1.36 Payout Ratio % 31.8 54.0 31.7 36.0 36.2 29.7 46.9 92.9 0.35 0.36 0.41 Total Shares Outstanding 1'190 1'130 1'111 1'125 1'062 1'021 1'164 1'169 1'174 1'220 1'294 Diluted Shares Outstanding 1'190 1'179 1'209 1'186 1'152 1'115 1'057 1'210 1'201 1'207 1'286 EBITDA *Net income excludes extraordinary gains and losses and one-time charges. Equivalent Estimates Company Analysis - Financials I/IV Fiscal Year Q.M.S Advisors | tel: +41 (0)78 922 08 77 | e-mail: info@qmsadv.com |
- 5. Periodicity: 12/02 12/03 12/04 12/05 12/06 12/07 12/08 12/09 12/10 12/11 12/12 12/13E 12/14E 12/15E Balance Sheet Total Current Assets + Cash & Near Cash Items 2'551 24'799 25'648 27'577 29'040 38'459 90'035 51'857 65'467 110'573 61'763 + Short Term Investments 342'341 418'736 467'123 525'573 446'407 480'414 283'208 329'515 379'226 318'227 259'588 + Accounts & Notes Receivable + Inventories + Other Current Assets Total Long-Term Assets + Long Term Investments 32'876 15'352 20'550 19'157 19'077 23'273 22'232 17'074 9'026 7'361 7'001 Gross Fixed Assets Accumulated Depreciation + Net Fixed Assets 5'273 7'819 7'231 8'328 6'577 6'149 6'350 6'436 6'725 7'193 5'618 + Other Long Term Assets 81'423 100'348 112'418 194'322 219'552 271'383 261'688 178'689 130'752 133'163 162'687 Total Current Liabilities + Accounts Payable + Short Term Borrowings 321'440 11'497 15'343 19'472 21'556 110'254 69'147 43'859 59'176 66'263 49'655 + Other Short Term Liabilities 91'902 239'007 249'204 313'010 347'956 391'478 360'253 301'494 300'104 287'660 241'682 Total Long Term Liabilities + Long Term Borrowings 71'521 89'697 106'261 132'975 147'832 163'223 153'373 159'365 173'752 162'655 148'134 + Other Long Term Borrowings 141'616 130'537 137'161 149'589 2'886 0 0 0 0 1'542 1'492 Total Liabilities 924'462 969'574 1'047'034 1'289'087 1'197'052 1'300'841 1'123'129 983'099 988'990 1'008'080 881'996 + Long Preferred Equity 0 0 0 0 0 0 0 0 0 + Minority Interest 2'878 743 6'178 7'847 15'318 16'640 14'919 10'811 9'733 7'411 6'786 + Share Capital & APIC 21'900 24'781 24'042 25'263 25'424 24'599 25'213 24'753 23'073 21'845 23'689 + Retained Earnings & Other Equity 2'521 9'210 12'231 16'855 18'162 18'600 7'089 12'764 10'209 11'829 11'809 Total Shareholders Equity 27'299 34'734 42'451 49'965 58'904 59'839 47'221 48'328 43'015 41'085 42'284 Total Liabilities & Equity 951'761 1'004'308 1'089'485 1'339'052 1'255'956 1'360'680 1'170'350 1'031'427 1'032'005 1'049'165 924'280 Book Value Per Share 20.52 30.07 32.65 37.43 41.02 42.33 27.75 32.09 28.35 27.59 27.44 27.38 29.24 30.88 Tangible Book Value Per Share 5.09 15.58 18.92 23.19 30.20 31.23 19.37 23.88 20.77 20.32 20.77 Company Analysis - Financials II/IV Q.M.S Advisors | tel: +41 (0)78 922 08 77 | e-mail: info@qmsadv.com |
- 6. Periodicity: 12/02 12/03 12/04 12/05 12/06 12/07 12/08 12/09 12/10 12/11 12/12 12/13E 12/14E 12/15E Cash Flows Net Income -3'309 770 5'628 5'850 11'327 7'760 -8'218 6'724 5'098 1'953 1'349 4'401 5'171 5'711 + Depreciation & Amortization 6'471 3'518 2'104 781 779 1'127 1'927 1'620 1'087 1'383 1'464 + Other Non-Cash Adjustments 6'431 13'172 5'158 3'448 -2'347 -1'177 -4'327 677 2'575 988 190 + Changes in Non-Cash Capital 47'900 -33'456 -60'217 -30'921 -58'342 -65'654 140'489 -23'207 83 34'306 -15'677 Cash From Operating Activities 57'493 -15'996 -47'327 -20'842 -48'583 -57'944 129'871 -14'186 8'843 38'630 -12'674 + Disposal of Fixed Assets 0 240 81 54 17 11 26 + Capital Expenditures 0 -883 -994 -977 -1'530 -1'550 -1'473 -1'387 -1'689 -1'739 -1'242 + Increase in Investments -133'808 -117'687 -52'960 -14'280 -2'980 -928 -1'727 -2'189 -2'752 -1'542 -480 + Decrease in Investments 131'909 104'798 61'843 9'667 8'391 8'961 5'397 7'059 7'203 11'364 5'666 + Other Investing Activities -32'092 -3'888 -4'762 -10'020 85 -8'879 -5'136 -3'086 -1'399 -1'560 1'644 Cash From Investing Activities -110'282 -33'310 -40'715 -80'183 -9'700 -30'034 4'352 60'684 -21'449 -25'972 42'955 + Dividends Paid 0 -273 -609 -1'782 -2'346 -2'512 -2'946 -375 -2'800 -1'948 -1'296 + Change in Short Term Borrowings 10'002 3'430 24'412 39'259 1'675 29'976 -52'887 -42'556 3'837 11'280 -47'798 + Increase in Long Term Borrowings 41'848 23'782 43'087 54'415 75'921 81'151 107'638 62'829 57'910 34'234 38'405 + Decrease in Long Term Borrowings -26'803 -26'255 -17'007 -34'739 -51'295 -65'306 -86'567 -72'472 -51'390 -37'127 -55'936 + Increase in Capital Stocks 726 6'932 15'287 10'756 17'333 36'338 29'111 17'674 24'758 12'980 10'285 + Decrease in Capital Stocks -2'548 -7'009 -17'950 -13'929 -23'461 -41'879 -25'032 -19'019 -26'846 -11'790 -8'859 + Other Financing Activities -195 -1'849 -4'683 4'325 1'856 5'569 1'851 -3'054 -5'644 -3'116 -837 Cash From Financing Activities 52'248 45'644 88'891 102'954 58'216 95'847 -84'120 -86'063 26'216 32'448 -79'091 Net Changes in Cash -541 -3'662 849 1'929 -67 7'869 50'103 -39'565 13'610 45'106 -48'810 Free Cash Flow (CFO-CAPEX) 57'493 -16'879 -48'321 -21'819 -50'113 -59'494 128'398 -15'573 7'154 36'891 -13'916 Free Cash Flow To Firm Free Cash Flow To Equity 82'540 -23'812 -13'673 96'582 -67'772 17'528 45'289 -79'219 Free Cash Flow per Share 48.31 -14.44 -42.53 -19.58 -45.56 -56.95 121.52 -13.26 5.99 30.78 -10.88 Company Analysis - Financials III/IV Q.M.S Advisors | tel: +41 (0)78 922 08 77 | e-mail: info@qmsadv.com |
- 7. Periodicity: 12/02 12/03 12/04 12/05 12/06 12/07 12/08 12/09 12/10 12/11 12/12 12/13E 12/14E 12/15E Ratio Analysis Valuation Ratios Price Earnings 28.6x 9.5x 16.8x 11.3x 9.2x 10.0x 9.6x 16.1x 27.1x 9.9x 8.7x 7.9x EV to EBIT EV to EBITDA Price to Sales 0.7x 0.8x 0.7x 1.3x 1.1x 0.8x 0.6x 1.2x 0.9x 0.6x 0.7x 1.5x 1.5x 1.4x Price to Book 1.5x 1.5x 1.5x 1.8x 2.1x 1.6x 1.0x 1.6x 1.3x 0.8x 0.8x 1.0x 0.9x 0.9x Dividend Yield 0.3% 3.1% 3.0% 2.6% 3.7% 0.4% 3.9% 3.5% 3.4% 3.4% 3.5% 4.2% 5.2% Profitability Ratios Gross Margin EBITDA Margin - - - Operating Margin -11.4% 6.7% 15.5% 23.6% 37.5% 34.5% -159.4% 23.9% 23.8% 12.9% 6.7% 24.8% 27.9% 29.2% Profit Margin -10.3% 1.5% 10.4% 19.4% 29.5% 19.9% -88.4% 20.3% 16.3% 7.5% 5.8% 15.8% 18.2% 20.0% Return on Assets -0.3% 0.1% 0.5% 0.5% 0.9% 0.6% -0.6% 0.6% 0.5% 0.2% 0.1% 0.5% 0.5% 0.6% Return on Equity -12.6% 2.6% 16.0% 14.9% 26.4% 17.9% -21.8% 19.3% 14.4% 5.8% 3.0% 10.8% 11.4% 11.4% Leverage & Coverage Ratios Current Ratio Quick Ratio Interest Coverage Ratio (EBIT/I) Tot Debt/Capital 0.94 0.91 0.89 0.90 0.89 0.91 0.91 0.89 0.90 0.91 0.89 Tot Debt/Equity 14.39 9.73 8.51 9.25 7.77 9.59 9.87 8.17 9.33 9.87 7.82 Others Asset Turnover 0.05 0.07 0.07 0.05 0.06 0.07 0.04 0.05 0.05 0.04 0.04 Accounts Receivable Turnover Accounts Payable Turnover Inventory Turnover Effective Tax Rate 17.4% 12.5% 16.7% 9.1% 22.7% 20.7% 19.4% 22.7% Company Analysis - Financials IV/IV Q.M.S Advisors | tel: +41 (0)78 922 08 77 | e-mail: info@qmsadv.com |
- 8. CREDIT SUISS-REG UBS AG-REG DEUTSCHE BANK- RG CITIGROUP INC JPMORGAN CHASE BARCLAYS PLC MORGAN STANLEY GOLDMAN SACHS GP HSBC HLDGS PLC BANCO SANTANDER NOMURA HOLDINGS MITSUBISHI UFJ F MIZUHO FINANCIAL ING GROEP NV TORONTO-DOM BANK 12/2012 12/2012 12/2012 12/2012 12/2012 12/2012 12/2012 12/2012 12/2012 12/2012 03/2012 03/2012 03/2012 12/2012 10/2012 27.85 16.39 38.73 47.92 51.00 330.05 24.47 159.00 741.20 6.68 795.00 692.00 225.00 7.91 86.20 07.02.2013 25.01.2013 01.02.2013 11.03.2013 14.03.2013 13.02.2013 20.02.2013 19.02.2013 14.03.2013 14.01.2013 12.04.2013 10.04.2013 05.04.2013 14.01.2013 25.02.2013 15.97 9.69 22.11 24.61 30.83 148.20 12.26 90.43 501.20 3.98 241.00 328.00 110.00 4.44 75.70 03.08.2012 24.07.2012 26.07.2012 04.06.2012 04.06.2012 26.07.2012 04.06.2012 26.06.2012 30.05.2012 23.07.2012 04.06.2012 04.06.2012 04.06.2012 04.06.2012 04.06.2012 3'867'467 5'831'044 4'328'033 28'839'907 20'568'406 42'158'639 23'443'270 3'698'618 7'372'125 60'388'340 54'890'400 71'746'800 182'845'800 14'770'368 2'259'805 26.41 15.39 31.71 46.46 48.17 292.65 21.61 142.94 692.60 5.53 753.00 646.00 214.00 6.20 80.88 -5.2% -6.1% -18.1% -3.0% -5.5% -11.3% -11.7% -10.1% -6.6% -17.2% -5.3% -6.6% -4.9% -21.6% -6.2% 65.4% 58.9% 43.4% 88.8% 56.2% 97.5% 76.3% 58.1% 38.2% 39.1% 212.4% 97.0% 94.5% 39.5% 6.8% 1'293.8 3'747.4 929.2 3'028.9 3'804.0 12'243.0 1'974.0 480.5 18'476.0 10'321.0 3'663.5 14'145.0 24'011.1 3'801.4 918.2 40'661 59'050 29'474 141'373 182'555 37'643 42'368 68'636 128'577 60'004 2'878'390 9'146'446 5'171'281 23'737 74'606 330'510.0 267'401.0 278'501.0 623'537.0 695'583.0 437'951.0 450'846.0 510'691.0 284'987.0 367'524.0 31'238'237.0 53'760'773.0 54'752'099.0 207'649.0 85'793.0 - - - 2'562.0 9'058.0 - 1'508.0 6'200.0 2'728.0 - - 390'001.0 410'368.0 - 3'395.0 6'786.0 4'353.0 407.0 1'948.0 - 9'371.0 7'628.0 508.0 7'887.0 9'672.0 281'896.0 1'674'821.0 1'957'699.0 1'081.0 1'477.0 63'708.0 66'383.0 147'433.0 36'453.0 471'833.0 128'120.0 46'904.0 72'669.0 256'366.0 182'116.0 1'070'520.0 9'384'046.0 7'527'509.0 17'657.0 25'128.0 - 264'421 - 799'437 - - 455'446 513'366 - - 36'366'838 - - 214'810 - LFY 38'313.0 37'754.0 52'299.0 90'708.0 108'184.0 38'837.0 32'036.0 41'664.0 88'382.0 43'575.0 1'851'760.0 4'536'724.0 2'453'016.0 39'304.0 30'334.0 LTM 39'068.0 37'758.0 52'356.0 90'629.0 106'713.0 38'837.0 33'168.0 41'636.0 69'265.0 43'575.0 1'925'202.0 4'296'873.0 2'633'625.0 42'241.0 30'552.0 CY+1 26'588.8 26'834.9 33'805.5 78'925.3 99'662.3 29'278.7 31'901.2 34'266.2 68'573.2 44'058.6 1'658'721.1 3'548'294.1 2'143'031.7 45'826.3 24'459.3 CY+2 27'486.8 27'871.0 34'795.0 80'915.9 102'507.3 30'109.3 34'096.6 35'053.0 72'313.1 46'116.8 1'453'771.5 3'455'446.5 2'053'211.1 47'228.2 25'844.8 LFY - 6.9x - 8.7x - - 14.1x 12.1x - - 19.1x - - 5.5x - LTM - 6.9x - 8.7x - - 13.9x 12.1x - - 18.4x - - 5.2x - CY+1 35.2x - 1.9x - - -6.8x - - 1.0x - 4.9x - - - - CY+2 34.0x - 1.9x - - -7.3x - - 0.4x - 5.7x - - - - LFY - 15'529.0 - 41'810.0 - - 8'020.0 20'446.0 - - 501'430.0 - - - - LTM - 15'530.0 - 41'647.0 - - 8'293.0 20'446.0 - - 490'214.0 - - - - CY+1 - - - - - - - - - - 220'851.5 - - - - CY+2 - - - - - - - - - - 377'479.8 - - - - LFY - 16.7x - 19.0x - - 56.2x 24.7x - - 70.5x - - - - LTM - 16.7x - 17.1x - - 54.4x 24.7x - - 72.1x - - - - CY+1 - - - - - - - - - - 37.2x - - - - CY+2 - - - - - - - - - - 22.1x - - - - LFY 2.26 0.52 1.91 4.83 6.04 0.45 1.58 15.03 0.49 0.60 - - - 0.68 7.13 LTM 1.59 -0.67 0.26 4.15 5.97 -0.09 1.57 15.25 0.79 0.24 12.74 48.70 25.01 0.75 7.55 CY+1 2.66 0.89 3.83 4.70 5.63 0.36 2.05 14.31 0.98 0.57 18.94 51.79 21.37 1.00 7.84 CY+2 3.05 1.19 4.93 5.32 5.94 0.44 2.54 15.25 1.09 0.67 38.70 51.83 18.44 1.11 8.38 LFY 16.6x - 122.0x 11.2x 8.1x - 13.8x 9.4x 13.3x 23.2x 59.1x 13.3x 8.6x 8.3x 10.7x LTM 9.2x 30.1x 17.2x 11.2x 8.1x 6.4x 13.8x 9.4x - 8.8x - - - 7.7x 10.7x CY+1 9.9x 17.3x 8.3x 9.9x 8.6x 8.0x 10.6x 10.0x 10.8x 9.8x 39.8x 12.5x 10.0x 6.2x 10.3x CY+2 8.7x 12.9x 6.4x 8.7x 8.1x 6.7x 8.5x 9.4x 9.7x 8.3x 19.5x 12.5x 11.6x 5.6x 9.7x 1 Year (10.3%) (7.6%) (0.7%) (11.6%) (2.4%) 1.1% (18.1%) 13.2% (6.8%) (44.1%) 33.7% 4.2% 0.1% (25.5%) 4.9% 5 Year (5.2%) (10.1%) 3.8% (2.3%) 0.8% (1.3%) 3.1% (6.8%) - 9.5% 2341.5% (3.2%) (1.9%) (9.3%) 3.2% 1 Year - (11.1%) - (21.9%) - - (44.3%) 27.6% - - 18.4% - - - - 5 Year - (31.3%) - (15.7%) - - (33.5%) (19.6%) - - (17.7%) - - - - LTM - 41.1% - 45.8% - - 25.6% 49.1% - - 25.5% - - - - CY+1 - - - - - - - - - - 13.3% - - - - CY+2 - - - - - - - - - - 26.0% - - - - Total Debt / Equity % 931.1% 582.6% 515.7% 334.4% 356.7% 817.3% 744.0% 734.6% 165.2% 492.3% 1482.4% 559.4% 1216.4% 366.8% 194.4% Total Debt / Capital % 88.7% 84.2% 83.7% 76.6% 77.3% 87.4% 86.6% 87.0% 60.9% 81.3% 92.9% 82.2% 88.9% 78.3% 63.6% Total Debt / EBITDA - 17.218x - 14.972x - - 54.365x 24.978x - - 69.442x - - - - Net Debt / EBITDA - 10.520x - 14.097x - - 48.709x 21.423x - - 67.769x - - - - EBITDA / Int. Expense - - - - - - - - - - - - - - - S&P LT Credit Rating A A A+ *- A- A A A- A- A+ BBB BBB+ A A A AA- S&P LT Credit Rating Date 19.12.2008 29.11.2011 26.03.2013 29.11.2011 29.11.2011 29.11.2011 29.11.2011 29.11.2011 29.11.2011 16.10.2012 27.01.2009 30.09.2008 18.06.2007 03.09.2009 15.03.2007 Moody's LT Credit Rating (P)A2 A2 A2 Baa2 A2 (P)A3 Baa1 A3 Aa3 (P)Baa2 Baa3 - - A3 Aa1 Moody's LT Credit Rating Date 21.06.2012 21.06.2012 21.06.2012 21.06.2012 21.06.2012 21.06.2012 21.06.2012 21.06.2012 21.06.2012 24.10.2012 15.03.2012 - - 15.06.2012 28.01.2013 52-Week High Date 52-Week Low Latest Fiscal Year: 52-Week High Total Debt Market Capitalization Daily Volume 52-Week Low % Change Current Price (4/dd/yy) 52-Week High % Change Cash and Equivalents EBITDA EV/EBITDA Enterprise Value Valuation Preferred Stock 52-Week Low Date Minority Interest Total Common Shares (M) P/E Revenue Growth Total Revenue EV/Total Revenue EPS EBITDA Growth EBITDA Margin Credit Ratings Leverage/Coverage Ratios Company Analysis - Peers Comparision Q.M.S Advisors | tel: +41 (0)78 922 08 77 | e-mail: info@qmsadv.com |