Financial Analysis - National Oilwell Varco Inc. is a worldwide provider of equipment and components used in oil and gas drilling and production operations, oilfield services
•
1 recomendación•592 vistas

Financial Analysis - National Oilwell Varco Inc. is a worldwide provider of equipment and components used in oil and gas drilling and production operations, oilfield services

Recomendados
Recomendados
Más contenido relacionado
La actualidad más candente
La actualidad más candente (20)
Destacado
Destacado (20)
Similar a Financial Analysis - National Oilwell Varco Inc. is a worldwide provider of equipment and components used in oil and gas drilling and production operations, oilfield services
Similar a Financial Analysis - National Oilwell Varco Inc. is a worldwide provider of equipment and components used in oil and gas drilling and production operations, oilfield services (20)
Más de BCV
Más de BCV (20)
Último
Último (20)
Financial Analysis - National Oilwell Varco Inc. is a worldwide provider of equipment and components used in oil and gas drilling and production operations, oilfield services
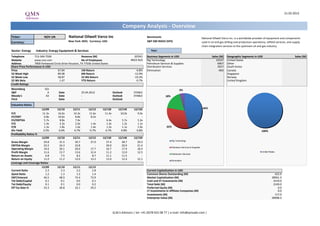
- 1. 21.02.2013 Company Analysis - Overview Ticker: NOV UN National Oilwell Varco Inc Benchmark: National Oilwell Varco Inc. is a worldwide provider of equipment and components Currency: New York: NOV, Currency: USD S&P 500 INDEX (SPX) used in oil and gas drilling and production operations, oilfield services, and supply chain integration services to the upstream oil and gas industry. Sector: Energy Industry: Energy Equipment & Services Year: Telephone 713-346-7500 Revenue (M) 20'041 Business Segments in USD Sales (M) Geographic Segments in USD Sales (M) Website www.nov.com No of Employees #N/A N/A Rig Technology 10107 United States 1 Address 7909 Parkwood Circle Drive Houston, TX 77036 United States Petroleum Services & Supplies 6967 Other Share Price Performance in USD Distribution Services 3927 South Korea Price 67.84 1M Return -6.8% Elimination -960 Canada 52 Week High 89.08 6M Return -12.9% Singapore 52 Week Low 58.87 52 Wk Return -19.3% Norway 52 Wk Beta 1.47 YTD Return -0.7% United Kingdom Credit Ratings Bloomberg IG5 4% S&P A Date 25.04.2012 Outlook STABLE Moody's A2 Date - Outlook STABLE 18% Fitch - Date - Outlook - Valuation Ratios 12/09 12/10 12/11 12/12 12/13E 12/14E 12/15E 46% P/E 11.3x 16.6x 14.3x 11.6x 11.4x 10.0x 9.0x EV/EBIT 6.8x 10.6x 8.8x 8.2x - - - EV/EBITDA 5.7x 8.8x 7.4x - 6.4x 5.7x 5.3x P/S 1.4x 2.3x 2.0x 1.4x 1.3x 1.2x 1.1x P/B 1.3x 1.8x 1.6x 1.4x 1.3x 1.1x 1.0x 32% Div Yield 2.5% 0.6% 0.7% 0.7% 0.7% 0.8% 0.8% 100% Profitability Ratios % 12/09 12/10 12/11 12/12 12/13E 12/14E 12/15E Rig Technology Gross Margin 29.8 31.5 30.7 27.0 27.4 28.7 29.3 EBITDA Margin 23.2 24.3 23.8 - 20.0 20.9 21.4 Petroleum Services & Supplies Operating Margin 19.4 20.1 20.0 17.7 16.7 17.9 18.3 Profit Margin 11.6 13.7 13.6 12.4 11.2 12.0 12.5 United States Distribution Services Return on Assets 6.8 7.5 8.2 8.7 11.1 11.5 - Return on Equity 11.0 11.2 12.0 13.2 12.0 12.4 12.1 Elimination Leverage and Coverage Ratios 12/09 12/10 12/11 12/12 Current Ratio 2.3 2.3 2.2 2.8 Current Capitalization in USD Quick Ratio 1.2 1.3 1.3 1.4 Common Shares Outstanding (M) 423.9 EBIT/Interest 46.5 48.9 73.4 73.9 Market Capitalization (M) 28961.3 Tot Debt/Capital 0.1 0.1 0.0 0.1 Cash and ST Investments (M) 3319.0 Tot Debt/Equity 0.1 0.1 0.0 0.2 Total Debt (M) 3149.0 Eff Tax Rate % 33.3 30.8 32.1 29.2 Preferred Equity (M) 0.0 LT Investments in Affiliate Companies (M) 0.0 Investments (M) 117.0 Enterprise Value (M) 28908.3 Q.M.S Advisors | tel: +41 (0)78 922 08 77 | e-mail: info@qmsadv.com |
- 2. Company Analysis - Analysts Ratings National Oilwell Varco Inc Target price in USD Broker Recommendation Buy and Sell Recommendations vs Price and Target Price Price Brokers' Target Price 120 120 100% 0% 0% 0% 0% 0% 0% 3% 3% 3% 0% 0% 0% 6% 7% 10% 7% 7% 7% 7% 6% 6% 12% 15% 100 20% 100 80% 80 60 80 60% 40 60 20 94% 93% 90% 93% 93% 93% 90% 91% 91% 88% 85% 0 40% 80% Morgan Stanley BMO Capital Markets Ameriprise Advisor Services, Barclays RBC Capital Markets Fearnley Fonds Iberia Capital Partners LLC Credit Agricole Securities RS Platou Markets Raymond James S&P Capital IQ Capital One Southcoast, Inc. Global Hunter Securities ISI Group Sanford C. Bernstein & Co Macquarie Credit Suisse JPMorgan Sterne, Agee & Leach Edward Jones Dahlman Rose & Co HSBC Societe Generale Guggenheim Securities LLC Argus Research Corp EVA Dimensions Tudor Pickering & Co Goldman Sachs Johnson Rice & Co Jefferies William Blair & Co Susquehanna Financial Group Howard Weil Inc Wells Fargo Securities, LLC 40 20% 20 0% 0 févr.12 mars.12 avr.12 mai.12 juin.12 juil.12 août.12 sept.12 oct.12 nov.12 déc.12 janv.13 Buy Hold Sell Price Target Price Date Buy Hold Sell Date Price Target Price Broker Analyst Recommendation Target Date 31-Jan-13 80% 20% 0% 21-Feb-13 67.84 85.39 Capital One Southcoast, Inc. JOSEPH D GIBNEY add 90.00 20-Feb-13 31-Dec-12 85% 15% 0% 20-Feb-13 67.84 85.39 Wells Fargo Securities, LLC THOMAS PATRICK CURRAN outperform 20-Feb-13 30-Nov-12 88% 12% 0% 19-Feb-13 69.48 85.39 Guggenheim Securities LLC DARREN GACICIA neutral 71.00 20-Feb-13 31-Oct-12 91% 6% 3% 18-Feb-13 69.33 85.39 Global Hunter Securities BRIAN UHLMER buy 80.00 20-Feb-13 28-Sep-12 91% 6% 3% 15-Feb-13 69.33 85.39 RBC Capital Markets KURT HALLEAD sector perform 80.00 19-Feb-13 31-Aug-12 90% 7% 3% 14-Feb-13 70.29 85.39 Fearnley Fonds TRULS OLSEN accumulate 81.00 15-Feb-13 31-Jul-12 93% 7% 0% 13-Feb-13 68.96 85.39 Sanford C. Bernstein & Co SCOTT GRUBER market perform 80.00 14-Feb-13 29-Jun-12 93% 7% 0% 12-Feb-13 68.92 85.39 Jefferies BRAD HANDLER buy 86.00 11-Feb-13 31-May-12 93% 7% 0% 11-Feb-13 68.26 85.39 Dahlman Rose & Co JAMES D CRANDELL buy 95.00 11-Feb-13 30-Apr-12 90% 10% 0% 8-Feb-13 69.08 85.39 HSBC DAVID PHILLIPS overweight 97.00 8-Feb-13 30-Mar-12 93% 7% 0% 7-Feb-13 68.10 84.92 Argus Research Corp PHILIP H WEISS buy 85.00 7-Feb-13 29-Feb-12 94% 6% 0% 6-Feb-13 66.57 84.92 EVA Dimensions CRAIG STERLING overweight 7-Feb-13 5-Feb-13 68.21 85.32 Howard Weil Inc WILLIAM SANCHEZ sector perform 85.00 6-Feb-13 4-Feb-13 70.17 85.68 Iberia Capital Partners LLC TREY STOLZ outperform 93.00 5-Feb-13 1-Feb-13 71.26 86.83 Societe Generale EDWARD C MUZTAFAGO buy 82.00 4-Feb-13 31-Jan-13 74.14 89.12 Morgan Stanley OLE SLORER Equalwt/Attractive 80.00 4-Feb-13 30-Jan-13 73.66 89.83 Goldman Sachs WAQAR SYED buy/attractive 90.00 4-Feb-13 29-Jan-13 74.12 89.83 Credit Suisse JAMES WICKLUND neutral 74.00 4-Feb-13 28-Jan-13 73.62 89.83 JPMorgan J DAVID ANDERSON overweight 89.00 4-Feb-13 25-Jan-13 74.00 90.00 William Blair & Co BRANDON DOBELL outperform 4-Feb-13 24-Jan-13 73.76 90.00 Raymond James J MARSHALL ADKINS outperform 90.00 4-Feb-13 23-Jan-13 73.67 90.85 Susquehanna Financial Group CHARLES P MINERVINO Positive 83.00 4-Feb-13 22-Jan-13 73.79 90.85 Credit Agricole Securities (USA) DAVID S HAVENS outperform 80.00 4-Feb-13 21-Jan-13 72.76 91.04 RS Platou Markets GORAN ANDREASSEN buy 87.00 4-Feb-13 18-Jan-13 72.76 91.04 Sterne, Agee & Leach STEPHEN D GENGARO buy 86.00 3-Feb-13 17-Jan-13 71.73 91.04 BMO Capital Markets ALAN D LAWS outperform 90.00 1-Feb-13 16-Jan-13 70.42 91.04 Edward Jones BRIAN YOUNGBERG buy 1-Feb-13 15-Jan-13 70.24 91.04 Johnson Rice & Co DAVID C SMITH equalweight 1-Feb-13 14-Jan-13 70.34 91.15 ISI Group JUDSON E BAILEY buy 80.00 1-Feb-13 11-Jan-13 70.89 91.58 S&P Capital IQ STEWART GLICKMAN strong buy 95.00 1-Feb-13 Q.M.S Advisors | tel: +41 (0)78 922 08 77 | e-mail: info@qmsadv.com |
- 3. 21.02.2013 National Oilwell Varco Inc Company Analysis - Ownership Ownership Type Ownership Statistics Geographic Ownership Distribution Geographic Ownership 0% 2% Shares Outstanding (M) 423.9 United States 84.56% 1% 1% 4% Float 99.7% Britain 4.70% 1% 1% Short Interest (M) 4.3 Canada 1.91% 2% Short Interest as % of Float 1.02% Japan 1.50% 5% Days to Cover Shorts 1.43 France 1.06% Institutional Ownership 102.26% Germany 1.00% Retail Ownership -2.52% Switzerland 0.90% Insider Ownership 0.26% Others 4.37% Institutional Ownership Distribution 85% 98% Investment Advisor 86.98% Hedge Fund Manager 4.73% Pension Fund (Erisa) 2.46% Institutional Ownership Retail Ownership Insider Ownership Mutual Fund Manager 1.93% United States Britain Canada Japan Pricing data is in USD Others 3.90% France Germany Switzerland Others Top 20 Owners: TOP 20 ALL Institutional Ownership Holder Name Position Position Change Market Value % of Ownership Report Date Source Country BLACKROCK 30'642'899 0 2'078'814'268 7.18% 31.12.2012 ULT-AGG UNITED STATES 2% 4% VANGUARD GROUP INC 19'278'074 138'815 1'307'824'540 4.52% 31.12.2012 13F UNITED STATES 2% STATE STREET 18'479'141 561'297 1'253'624'925 4.33% 19.02.2013 ULT-AGG UNITED STATES 5% FMR LLC 18'049'001 -5'431'601 1'224'444'228 4.23% 31.12.2012 ULT-AGG UNITED STATES SANDS CAPITAL MANAGE 9'422'878 335'621 639'248'044 2.21% 31.12.2012 13F UNITED STATES OPPENHEIMERFUNDS INC 8'339'871 1'475'345 565'776'849 1.95% 31.12.2012 13F UNITED STATES NORTHERN TRUST CORPO 8'217'551 -143'556 557'478'660 1.92% 31.12.2012 13F UNITED STATES BANK OF NEW YORK MEL 7'646'149 284'855 518'714'748 1.79% 31.12.2012 13F UNITED STATES MASSACHUSETTS FINANC 7'267'860 1'344'474 493'051'622 1.70% 31.12.2012 13F UNITED STATES JP MORGAN 6'813'302 864'892 462'214'408 1.60% 31.12.2012 ULT-AGG 87% WADDELL & REED FINAN 5'457'809 -646'995 370'257'763 1.28% 31.12.2012 13F UNITED STATES AMERIPRISE FINANCIAL 5'444'048 -1'845'531 369'324'216 1.28% 31.12.2012 13F UNITED STATES BERKSHIRE HATHAWAY I 5'294'800 1'108'000 359'199'232 1.24% 31.12.2012 ULT-AGG UNITED STATES CLEARBRIDGE INVESTME 5'260'359 -55'991 356'862'755 1.23% 31.12.2012 13F UNITED STATES Investment Advisor Hedge Fund Manager Pension Fund (Erisa) Mutual Fund Manager Others HARRIS ASSOCIATES LP 5'205'684 527'011 353'153'603 1.22% 31.12.2012 13F UNITED STATES ALLIANCE BERNSTEIN 5'199'627 -603'509 352'742'696 1.22% 31.12.2012 ULT-AGG UNITED STATES MARSICO CAPITAL MANA 5'020'360 -1'307'778 340'581'222 1.18% 31.12.2012 13F UNITED STATES WELLINGTON MANAGEMEN 4'932'898 -1'209'184 334'647'800 1.16% 31.12.2012 13F UNITED STATES JANUS CAPITAL MANAGE 4'611'502 1'102'310 312'844'296 1.08% 31.12.2012 ULT-AGG UNITED STATES VAN ECK ASSOCIATES C 3'863'917 445'416 262'128'129 0.91% 31.12.2012 13F UNITED STATES Top 5 Insiders: Holder Name Position Position Change Market Value % of Ownership Report Date Source MILLER JR MERRILL A 535'904 -2'500 36'355'727 0.13% 30.11.2012 Form 4 WILLIAMS CLAY C 162'879 21'000 11'049'711 0.04% 15.02.2013 Form 4 RETTIG DWIGHT W 61'754 13'000 4'189'391 0.01% 15.02.2013 Form 4 THIGPEN JEREMY D 50'638 16'000 3'435'282 0.01% 15.02.2013 Form 4 MATTSON ERIC L 48'600 2'594 3'297'024 0.01% 16.05.2012 Form 4 Q.M.S Advisors | tel: +41 (0)78 922 08 77 | e-mail: info@qmsadv.com |
- 4. Company Analysis - Financials I/IV National Oilwell Varco Inc Financial information is in USD (M) Equivalent Estimates Periodicity: Fiscal Year 12/02 12/03 12/04 12/05 12/06 12/07 12/08 12/09 12/10 12/11 12/12 12/13E 12/14E 12/15E Income Statement Revenue 1'522 2'005 2'318 4'645 7'026 9'789 13'431 12'712 12'156 14'658 20'041 22'613 24'187 25'290 - Cost of Goods Sold 1'160 1'541 1'822 3'657 5'265 6'959 9'360 8'928 8'324 10'161 14'628 Gross Income 362 464 496 987 1'761 2'830 4'072 3'784 3'832 4'497 5'413 6'193 6'946 7'418 - Selling, General & Admin Expenses 228 305 328 479 642 786 1'154 1'322 1'385 1'560 1'868 (Research & Dev Costs) Operating Income 134 159 169 509 1'119 2'044 2'918 2'462 2'447 2'937 3'545 3'778 4'320 4'620 - Interest Expense 27 39 38 53 49 50 67 53 50 40 48 - Foreign Exchange Losses (Gains) 0 0 0 0 0 0 0 0 0 0 - Net Non-Operating Losses (Gains) -6 3 -1 26 21 -35 -111 201 0 -25 -8 Pretax Income 113 117 132 430 1'049 2'029 2'961 2'208 2'397 2'922 3'505 3'713 4'224 4'583 - Income Tax Expense 39 34 19 139 356 676 993 735 738 937 1'022 Income Before XO Items 74 83 112 291 694 1'353 1'969 1'473 1'659 1'985 2'483 - Extraordinary Loss Net of Tax 0 0 0 0 0 0 0 0 0 0 - Minority Interests 1 6 2 4 10 16 17 4 -8 -9 -8 Diluted EPS Before XO Items 0.45 0.45 0.64 0.91 1.94 3.76 4.90 3.52 3.98 4.70 5.83 Net Income Adjusted* 73 84 95 308 684 1'337 2'024 1'621 1'696 2'021 2'520 2'534 2'902 3'154 EPS Adjusted 0.45 0.49 0.55 0.98 1.94 3.76 5.08 3.88 4.09 4.77 5.91 5.96 6.81 7.51 Dividends Per Share 0.00 0.00 0.00 0.00 0.00 0.00 1.10 0.41 0.45 0.49 0.51 0.53 0.54 Payout Ratio % 0.0 0.0 0.0 0.0 0.0 31.3 10.3 9.6 8.4 0.08 0.08 0.07 Total Shares Outstanding 162 170 172 349 351 357 417 418 421 424 424 Diluted Shares Outstanding 163 170 173 317 354 355 399 417 419 424 427 EBITDA 159 198 213 623 1'280 2'259 3'319 2'952 2'954 3'492 4'533 5'044 5'412 *Net income excludes extraordinary gains and losses and one-time charges. Q.M.S Advisors | tel: +41 (0)78 922 08 77 | e-mail: info@qmsadv.com |
- 5. Company Analysis - Financials II/IV Periodicity: 12/02 12/03 12/04 12/05 12/06 12/07 12/08 12/09 12/10 12/11 12/12 12/13E 12/14E 12/15E Balance Sheet Total Current Assets 1123.634 1246.4 1537.4 2998.2 4965.6 7593.8 9657.2 9598 10535 12110 15678 + Cash & Near Cash Items 118 74 143 209 957 1'842 1'543 2'622 3'333 3'535 3'319 + Short Term Investments 0 0 0 0 0 0 0 0 0 0 + Accounts & Notes Receivable 428 461 480 1'139 1'615 2'100 3'136 2'187 2'425 3'291 4'320 + Inventories 524 654 884 1'540 2'138 3'218 4'425 4'230 4'203 4'623 7'116 + Other Current Assets 53 57 31 109 256 434 554 559 574 661 923 Total Long-Term Assets 854 996 1'061 3'680 4'054 4'521 11'822 11'934 12'515 13'405 15'806 + Long Term Investments 0 0 0 0 0 0 0 0 0 0 Gross Fixed Assets 368 450 506 1'167 1'396 1'710 2'329 2'701 2'903 3'660 Accumulated Depreciation 160 197 251 290 374 513 653 865 1'063 1'215 + Net Fixed Assets 208 252 255 878 1'022 1'197 1'677 1'836 1'840 2'445 2'945 + Other Long Term Assets 645 744 806 2'803 3'032 3'324 10'145 10'098 10'675 10'960 12'861 Total Current Liabilities 355 452 800 1'187 2'665 4'027 5'624 4'174 4'536 5'416 5'649 + Accounts Payable 169 229 408 568 505 604 852 584 628 901 1'200 + Short Term Borrowings 15 150 6 6 153 4 7 373 351 1 + Other Short Term Liabilities 186 209 243 613 2'154 3'270 4'767 3'583 3'535 4'164 4'448 Total Long Term Liabilities 679 684 484 1'273 1'295 1'364 3'132 3'130 2'652 2'371 5'479 + Long Term Borrowings 595 594 350 836 835 738 870 876 514 159 3'148 + Other Long Term Borrowings 85 90 134 437 460 626 2'262 2'254 2'138 2'212 2'331 Total Liabilities 1'034 1'137 1'285 2'460 3'960 5'391 8'755 7'304 7'188 7'787 11'128 + Long Preferred Equity 0 0 0 0 0 0 0 0 0 0 + Minority Interest 10 16 18 25 36 63 96 115 114 109 117 + Share Capital & APIC 596 676 694 3'403 3'464 3'621 7'993 8'218 8'357 8'539 8'747 + Retained Earnings & Other Equity 338 415 603 792 1'560 3'041 4'634 5'895 7'391 9'080 11'492 Total Shareholders Equity 943 1'106 1'314 4'219 5'059 6'724 12'724 14'228 15'862 17'728 20'356 Total Liabilities & Equity 1'977 2'243 2'599 6'679 9'019 12'115 21'479 21'532 23'050 25'515 31'484 Book Value Per Share 5.76 6.40 7.54 12.03 14.31 18.67 30.26 33.73 37.39 41.56 47.74 52.82 59.04 66.33 Tangible Book Value Per Share 2.17 2.49 3.29 4.20 5.91 9.65 7.43 10.93 13.91 17.45 19.64 Q.M.S Advisors | tel: +41 (0)78 922 08 77 | e-mail: info@qmsadv.com |
- 6. Company Analysis - Financials III/IV Periodicity: 12/02 12/03 12/04 12/05 12/06 12/07 12/08 12/09 12/10 12/11 12/12 12/13E 12/14E 12/15E Cash Flows Net Income 73 77 110 287 684 1'337 1'952 1'469 1'667 1'994 2'491 2'524 2'867 3'063 + Depreciation & Amortization 25 39 44 115 161 214 402 490 507 555 + Other Non-Cash Adjustments -43 12 41 162 1'130 422 94 166 87 144 + Changes in Non-Cash Capital 49 -97 -29 -486 -758 -785 -154 -30 -719 -550 Cash From Operating Activities 104 31 166 78 1'217 1'188 2'294 2'095 1'542 2'143 + Disposal of Fixed Assets 8 36 0 0 0 0 0 0 0 + Capital Expenditures -25 -32 -39 -105 -200 -252 -379 -250 -232 -483 -586 -560 -611 + Increase in Investments 0 0 0 0 0 0 0 0 0 + Decrease in Investments 0 0 0 0 0 0 0 0 0 + Other Investing Activities -201 -78 -3 143 -330 -323 -2'095 -302 -511 -975 Cash From Investing Activities -225 -102 -6 38 -530 -575 -2'473 -552 -743 -1'458 + Dividends Paid 0 0 0 0 0 0 -460 -172 -191 + Change in Short Term Borrowings -8 0 0 0 0 0 0 0 0 0 + Increase in Long Term Borrowings 199 455 522 419 30 47 2'731 7 3 0 + Decrease in Long Term Borrowings -439 -632 -571 -35 -12 -2'920 -47 -16 -391 + Increase in Capital Stocks 2 10 15 112 46 114 115 9 83 118 + Decrease in Capital Stocks 0 0 0 0 0 0 0 0 0 + Other Financing Activities 3 2 4 -8 20 122 -46 27 14 -19 Cash From Financing Activities 196 27 -92 -49 61 271 -120 -464 -88 -483 Net Changes in Cash 75 -44 69 67 748 884 -299 1'079 711 202 Free Cash Flow (CFO-CAPEX) 80 -1 127 -28 1'016 936 1'916 1'845 1'310 1'660 2'509 2'919 2'981 Free Cash Flow To Firm 97 26 160 8 1'048 970 1'960 1'880 1'345 1'687 Free Cash Flow To Equity 53 -180 1'011 972 1'727 1'805 1'297 1'269 Free Cash Flow per Share 0.49 -0.01 0.74 -0.09 2.90 2.64 4.82 4.44 3.14 3.93 Q.M.S Advisors | tel: +41 (0)78 922 08 77 | e-mail: info@qmsadv.com |
- 7. Company Analysis - Financials IV/IV Periodicity: 12/02 12/03 12/04 12/05 12/06 12/07 12/08 12/09 12/10 12/11 12/12 12/13E 12/14E 12/15E Ratio Analysis Valuation Ratios Price Earnings 24.5x 22.8x 32.1x 32.2x 15.7x 19.5x 4.8x 11.3x 16.6x 14.3x 11.6x 11.4x 10.0x 9.0x EV to EBIT 16.8x 15.4x 20.2x 22.8x 9.5x 12.4x 3.3x 6.8x 10.6x 8.8x 8.2x EV to EBITDA 14.2x 12.4x 16.0x 18.6x 8.3x 11.2x 2.9x 5.7x 8.8x 7.4x 6.4x 5.7x 5.3x Price to Sales 1.2x 0.9x 1.3x 2.1x 1.5x 2.7x 0.7x 1.4x 2.3x 2.0x 1.4x 1.3x 1.2x 1.1x Price to Book 1.9x 1.7x 2.3x 2.6x 2.1x 3.9x 0.8x 1.3x 1.8x 1.6x 1.4x 1.3x 1.1x 1.0x Dividend Yield 0.0% 0.0% 0.0% 0.0% 0.0% 0.0% 2.5% 0.6% 0.7% 0.7% 0.7% 0.8% 0.8% Profitability Ratios Gross Margin 23.8% 23.2% 21.4% 21.3% 25.1% 28.9% 30.3% 29.8% 31.5% 30.7% 27.0% 27.4% 28.7% 29.3% EBITDA Margin 10.5% 9.9% 9.2% 13.4% 18.2% 23.1% 24.7% 23.2% 24.3% 23.8% 20.0% 20.9% 21.4% Operating Margin 8.8% 7.9% 7.3% 10.9% 15.9% 20.9% 21.7% 19.4% 20.1% 20.0% 17.7% 16.7% 17.9% 18.3% Profit Margin 4.8% 3.8% 4.8% 6.2% 9.7% 13.7% 14.5% 11.6% 13.7% 13.6% 12.4% 11.2% 12.0% 12.5% Return on Assets 4.2% 3.6% 4.6% 6.2% 8.7% 12.7% 11.6% 6.8% 7.5% 8.2% 8.7% 11.1% 11.5% Return on Equity 8.1% 7.6% 9.2% 10.5% 14.8% 22.9% 20.2% 11.0% 11.2% 12.0% 13.2% 12.0% 12.4% 12.1% Leverage & Coverage Ratios Current Ratio 3.17 2.76 1.92 2.53 1.86 1.89 1.72 2.30 2.32 2.24 2.78 Quick Ratio 1.54 1.18 0.78 1.14 0.97 0.98 0.83 1.15 1.27 1.26 1.35 Interest Coverage Ratio (EBIT/I) 4.92 4.08 4.39 9.61 22.98 40.64 43.35 46.45 48.94 73.43 73.85 Tot Debt/Capital 0.39 0.36 0.28 0.17 0.14 0.12 0.06 0.06 0.05 0.03 0.13 Tot Debt/Equity 0.63 0.55 0.38 0.20 0.17 0.13 0.07 0.06 0.06 0.03 0.15 Others Asset Turnover 0.88 0.95 0.96 1.00 0.90 0.93 0.80 0.59 0.55 0.60 0.70 Accounts Receivable Turnover 3.76 4.51 4.93 5.74 5.10 5.27 5.13 4.78 5.27 5.13 5.27 Accounts Payable Turnover 7.45 8.42 6.45 8.84 10.92 14.50 14.52 12.16 13.69 13.84 16.30 Inventory Turnover 2.37 2.62 2.37 3.02 2.86 2.60 2.45 2.06 1.97 2.30 2.49 Effective Tax Rate 34.8% 28.9% 14.6% 32.3% 33.9% 33.3% 33.5% 33.3% 30.8% 32.1% 29.2% Q.M.S Advisors | tel: +41 (0)78 922 08 77 | e-mail: info@qmsadv.com |