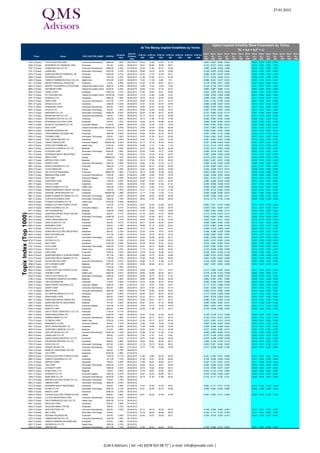
Topix Index (Top 1000) Dividends and Implied Volatility Surface Parameters
•
1 recomendación•822 vistas

Topix Index (Top 1000) Dividends and Implied Volatility Surface Parameters

Recomendados
Recomendados
Más contenido relacionado
La actualidad más candente
La actualidad más candente (20)
Destacado
Similar a Topix Index (Top 1000) Dividends and Implied Volatility Surface Parameters
Similar a Topix Index (Top 1000) Dividends and Implied Volatility Surface Parameters (20)
Más de BCV
Más de BCV (20)
Último
Último (20)
Topix Index (Top 1000) Dividends and Implied Volatility Surface Parameters
- 1. 27.01.2012 Option Implied Volatility Skew Parameters by Terms: At The Money Implied Volatilities by Terms 2 IVt = atx + btx + ct Next Ex- Skew Skew Skew Skew Skew Skew Skew Skew Skew Skew Skew Skew Skew Skew Dividend ATM Vol - ATM Vol - ATM Vol - ATM Vol - ATM Vol - ATM Vol - ATM Vol - Ticker Name GICS_SECTOR_NAME ATM Ref Dividend (a) - (a) - (a) - (a) - (a) - (a) - (a) - (b) - (b) - (b) - (b) - (b) - (b) - (b) - Yield 30D 60D 90D 6M 12M 18M 24M Date 30D 60D 90D 6M 12M 18M 24M 30D 60D 90D 6M 12M 18M 24M 7203 JT Equity TOYOTA MOTOR CORP Consumer Discretionary 2838.00 1.94% 28.03.2012 29.72 31.38 31.64 31.79 0.033 0.033 0.035 0.044 0.007 0.000 0.000 0.000 8306 JT Equity MITSUBISHI UFJ FINANCIAL GRO Financials 351.00 3.42% 26.09.2012 28.31 28.98 29.69 29.81 -0.130 -0.017 -0.014 -0.004 0.012 0.002 0.001 -0.001 7267 JT Equity HONDA MOTOR CO LTD Consumer Discretionary 2689.00 2.45% 27.06.2012 23.23 21.96 22.41 23.06 -0.080 -0.028 -0.028 -0.024 0.010 0.001 0.000 -0.001 7751 JT Equity CANON INC Information Technology 3470.00 3.75% 27.06.2012 20.69 18.79 18.79 18.96 -0.125 -0.037 -0.019 0.022 0.010 0.002 0.001 0.000 8316 JT Equity SUMITOMO MITSUI FINANCIAL GR Financials 2383.00 4.41% 26.09.2012 29.30 31.53 32.20 32.51 -0.060 0.016 0.019 0.025 0.005 -0.006 -0.007 -0.008 8058 JT Equity MITSUBISHI CORP Industrials 1757.00 3.70% 26.09.2012 21.94 22.87 23.15 23.06 -0.177 -0.016 -0.005 0.014 0.009 0.001 0.000 0.000 4502 JT Equity TAKEDA PHARMACEUTICAL CO LTD Health Care 3315.00 5.43% 26.09.2012 13.54 11.20 9.88 7.61 -0.089 -0.041 -0.017 0.014 0.022 0.018 0.014 0.004 8411 JT Equity MIZUHO FINANCIAL GROUP INC Financials 115.00 6.96% 26.09.2012 27.02 27.64 28.67 29.17 -0.118 -0.032 -0.011 0.022 0.027 0.010 0.006 -0.001 9432 JT Equity NIPPON TELEGRAPH & TELEPHONE Telecommunication Services3895.00 3.34% 26.09.2012 14.98 13.42 13.64 13.60 -0.128 -0.132 -0.077 0.007 0.011 0.007 0.004 0.000 9984 JT Equity SOFTBANK CORP Telecommunication Services2230.00 0.22% 28.03.2012 29.26 27.44 27.42 27.51 0.069 0.087 0.090 0.101 0.007 -0.001 -0.001 0.000 6954 JT Equity FANUC CORP Industrials 12870.00 1.41% 28.03.2012 31.85 34.64 34.61 34.60 -0.022 -0.004 -0.014 -0.022 0.003 -0.001 -0.001 -0.001 9437 JT Equity NTT DOCOMO INC Telecommunication Services 139100.00 4.03% 26.09.2012 13.18 12.62 12.88 12.97 -0.046 -0.043 -0.024 0.008 0.010 0.005 0.003 -0.001 6301 JT Equity KOMATSU LTD Industrials 2098.00 1.95% 26.09.2012 28.70 32.23 32.52 32.58 -0.056 0.030 0.053 0.090 0.011 -0.002 -0.001 -0.001 6758 JT Equity SONY CORP Consumer Discretionary 1414.00 1.77% 28.03.2012 29.45 25.33 25.41 25.13 0.020 0.123 0.158 0.234 0.007 0.002 0.001 0.000 8031 JT Equity MITSUI & CO LTD Industrials 1299.00 4.23% 26.09.2012 21.81 24.39 24.87 24.76 -0.086 -0.038 -0.027 -0.010 0.012 0.001 0.000 0.000 6752 JT Equity PANASONIC CORP Consumer Discretionary 635.00 1.97% 26.09.2012 23.83 22.23 22.53 22.71 -0.085 -0.007 0.034 0.094 0.017 0.003 0.000 -0.004 6501 JT Equity HITACHI LTD Information Technology 430.00 1.86% 28.03.2012 29.69 32.69 33.08 33.22 -0.087 -0.052 -0.047 -0.030 0.012 0.001 0.001 0.000 7974 JT Equity NINTENDO CO LTD Information Technology 10260.00 2.53% 26.09.2012 29.34 27.98 28.21 28.20 0.110 0.098 0.103 0.114 0.001 0.000 0.000 0.000 7201 JT Equity NISSAN MOTOR CO LTD Consumer Discretionary 728.00 2.75% 26.09.2012 22.10 22.51 22.76 22.66 -0.123 -0.017 0.001 0.041 0.017 0.003 0.002 0.000 8802 JT Equity MITSUBISHI ESTATE CO LTD Financials 1262.00 0.95% 26.09.2012 29.73 31.66 31.83 31.88 -0.004 0.030 0.035 0.049 0.008 -0.001 -0.001 -0.001 6503 JT Equity MITSUBISHI ELECTRIC CORP Industrials 763.00 1.57% 28.03.2012 33.26 35.79 35.98 35.78 -0.062 -0.004 0.003 0.016 0.009 0.000 0.000 0.000 3382 JT Equity SEVEN & I HOLDINGS CO LTD Consumer Staples 2138.00 2.90% 29.08.2012 12.40 13.93 13.97 13.94 0.045 0.052 0.034 0.010 0.023 0.009 0.005 0.000 9433 JT Equity KDDI CORP Telecommunication Services 494500.00 2.83% 26.09.2012 25.80 29.40 29.83 29.84 0.003 0.006 0.008 0.017 0.004 0.000 -0.001 -0.001 8604 JT Equity NOMURA HOLDINGS INC Financials 272.00 3.31% 28.03.2012 34.24 26.39 26.65 26.53 -0.094 0.022 0.032 0.049 0.007 0.003 0.001 -0.001 8766 JT Equity TOKIO MARINE HOLDINGS INC Financials 1884.00 2.65% 26.09.2012 29.84 29.95 30.33 30.35 -0.001 0.093 0.112 0.266 -0.003 -0.014 -0.016 -0.012 6502 JT Equity TOSHIBA CORP Information Technology 330.00 1.82% 28.03.2012 30.52 31.59 32.01 32.26 -0.054 0.004 0.007 0.028 0.017 0.001 0.000 0.000 9020 JT Equity EAST JAPAN RAILWAY CO Industrials 4700.00 2.34% 26.09.2012 12.61 12.41 12.54 12.54 0.087 0.003 -0.010 -0.028 0.016 0.008 0.005 0.000 2914 JT Equity JAPAN TOBACCO INC Consumer Staples 383000.00 2.22% 26.09.2012 30.17 30.19 30.40 30.40 -0.021 -0.009 -0.003 0.000 -0.001 0.000 0.000 0.000 4503 JT Equity ASTELLAS PHARMA INC Health Care 3100.00 4.03% 26.09.2012 14.89 11.31 11.46 11.33 -0.131 -0.114 -0.073 0.000 0.019 0.013 0.008 0.001 4063 JT Equity SHIN-ETSU CHEMICAL CO LTD Materials 3950.00 2.53% 26.09.2012 22.77 22.05 22.36 22.58 -0.105 -0.017 -0.007 0.022 0.007 0.001 0.000 0.000 6971 JT Equity KYOCERA CORP Information Technology 6500.00 1.85% 26.09.2012 20.35 18.65 18.77 18.66 -0.058 -0.016 0.007 0.051 0.009 0.002 0.001 0.000 7011 JT Equity MITSUBISHI HEAVY INDUSTRIES Industrials 352.00 1.70% 26.09.2012 27.51 32.34 32.50 32.55 -0.067 -0.008 -0.004 0.009 0.014 0.001 0.001 0.000 1605 JT Equity INPEX CORP Energy 528000.00 1.14% 26.09.2012 28.74 35.49 35.65 35.79 -0.013 -0.001 0.001 0.012 0.009 0.000 0.000 0.000 5401 JT Equity NIPPON STEEL CORP Materials 194.00 1.55% 28.03.2012 35.14 37.59 37.91 38.20 0.050 0.027 0.031 0.039 0.015 0.000 0.000 -0.002 6902 JT Equity DENSO CORP Consumer Discretionary 2293.00 2.09% 26.09.2012 24.85 21.60 21.78 21.73 -0.084 -0.018 -0.003 0.038 0.009 0.001 0.000 -0.001 8801 JT Equity MITSUI FUDOSAN CO LTD Financials 1285.00 1.71% 26.09.2012 28.23 24.37 24.60 24.59 -0.103 -0.007 -0.001 0.011 0.007 0.001 0.000 0.000 5020 JT Equity JX HOLDINGS INC Energy 476.00 3.36% 26.09.2012 24.93 24.65 24.93 24.80 -0.044 -0.028 -0.013 0.013 0.009 0.003 0.002 0.000 8750 JT Equity DAI-ICHI LIFE INSURANCE Financials 80600.00 1.99% 27.03.2013 36.12 35.56 35.96 35.40 0.003 0.006 0.010 0.017 0.000 0.000 0.000 0.000 5108 JT Equity BRIDGESTONE CORP Consumer Discretionary 1743.00 1.26% 27.06.2012 19.99 18.85 18.79 18.78 -0.054 -0.046 -0.027 0.005 0.010 0.005 0.003 -0.001 4452 JT Equity KAO CORP Consumer Staples 2123.00 2.78% 26.09.2012 20.45 20.13 20.28 20.05 0.021 0.012 0.011 0.009 0.010 0.000 0.000 0.000 8053 JT Equity SUMITOMO CORP Industrials 1108.00 4.60% 26.09.2012 20.85 22.54 22.91 22.60 -0.080 -0.026 -0.009 0.020 0.015 0.002 0.001 0.000 8001 JT Equity ITOCHU CORP Industrials 835.00 3.95% 26.09.2012 21.62 20.94 21.36 21.42 -0.240 -0.065 -0.038 0.014 0.011 0.003 0.002 -0.001 4568 JT Equity DAIICHI SANKYO CO LTD Health Care 1422.00 4.22% 26.09.2012 15.27 14.93 15.15 14.95 -0.054 -0.064 -0.038 0.006 0.024 0.012 0.007 0.000 8725 JT Equity MS&AD INSURANCE GROUP HOLDIN Financials 1520.00 3.55% 26.09.2012 23.31 21.32 21.54 21.26 -0.166 -0.010 0.009 0.044 0.007 0.003 0.001 0.000 9022 JT Equity CENTRAL JAPAN RAILWAY CO Industrials 646000.00 1.39% 26.09.2012 17.17 17.45 17.63 17.73 -0.045 -0.006 0.000 0.010 0.001 0.000 0.000 -0.001 6981 JT Equity MURATA MANUFACTURING CO LTD Information Technology 4265.00 2.34% 26.09.2012 28.55 29.32 29.60 29.40 -0.029 -0.002 0.002 0.011 0.006 0.000 0.000 0.000 4901 JT Equity FUJIFILM HOLDINGS CORP Information Technology 1992.00 1.76% 26.09.2012 28.43 27.87 28.08 28.20 -0.012 0.118 0.135 0.162 0.006 -0.005 -0.006 -0.008 4578 JT Equity OTSUKA HOLDINGS CO LTD Health Care 2163.00 2.08% 26.09.2012 9503 JT Equity KANSAI ELECTRIC POWER CO INC Utilities 1275.00 4.71% 26.09.2012 25.61 23.36 23.96 24.03 0.063 0.321 0.418 0.568 0.010 0.002 -0.002 -0.008 2503 JT Equity KIRIN HOLDINGS CO LTD Consumer Staples 961.00 2.81% 27.06.2012 19.98 20.62 20.58 20.70 -0.033 0.023 0.020 0.031 0.011 0.001 0.000 -0.001 5411 JT Equity JFE HOLDINGS INC Materials 1408.00 2.84% 28.03.2012 27.34 19.66 19.34 18.80 -0.058 0.004 0.050 0.113 0.006 0.004 0.003 0.001 Topix Index (Top 1000) 8309 JT Equity SUMITOMO MITSUI TRUST HOLDIN Financials 240.00 4.17% 26.09.2012 31.16 30.81 31.07 30.69 -0.115 -0.033 -0.016 0.013 0.014 0.002 0.001 0.000 6861 JT Equity KEYENCE CORP Information Technology 19580.00 0.31% 18.09.2012 30.67 30.36 30.27 30.11 -0.002 0.004 0.006 0.010 0.000 0.000 0.000 0.000 3402 JT Equity TORAY INDUSTRIES INC Materials 575.00 1.74% 26.09.2012 32.53 40.97 41.28 41.40 0.033 0.007 0.011 0.027 0.014 -0.001 -0.001 -0.001 5201 JT Equity ASAHI GLASS CO LTD Industrials 649.00 4.01% 27.06.2012 28.71 26.46 26.50 26.94 -0.065 0.006 0.024 0.055 0.012 0.001 0.000 -0.003 8002 JT Equity MARUBENI CORP Industrials 530.00 3.40% 26.09.2012 26.48 31.15 32.06 32.43 -0.070 0.063 0.094 0.148 0.015 0.000 -0.001 -0.002 9531 JT Equity TOKYO GAS CO LTD Utilities 357.00 2.66% 26.09.2012 12.17 9.68 9.94 10.07 -0.205 -0.116 -0.092 -0.027 0.032 0.025 0.017 0.003 5802 JT Equity SUMITOMO ELECTRIC INDUSTRIES Industrials 904.00 2.10% 26.09.2012 22.28 18.55 18.61 18.25 -0.245 -0.060 -0.035 0.008 0.014 0.008 0.005 0.000 8630 JT Equity NKSJ HOLDINGS INC Financials 1511.00 5.29% 27.03.2013 34.43 36.70 38.18 37.53 -0.028 0.002 0.005 0.007 0.005 -0.001 -0.001 -0.001 6702 JT Equity FUJITSU LTD Information Technology 418.00 2.39% 26.09.2012 30.52 30.39 30.80 30.71 -0.061 0.000 0.004 0.012 0.004 0.000 0.000 0.000 9735 JT Equity SECOM CO LTD Industrials 3560.00 2.53% 27.03.2013 20.62 23.30 23.80 23.83 -0.053 0.015 0.020 0.034 0.005 -0.003 -0.003 -0.003 6273 JT Equity SMC CORP Industrials 13270.00 0.60% 26.09.2012 35.79 35.35 35.34 35.03 -0.014 0.005 0.006 0.010 0.001 0.000 0.000 0.000 7741 JT Equity HOYA CORP Information Technology 1664.00 3.91% 28.03.2012 23.51 26.13 26.58 26.57 -0.047 0.000 0.003 0.017 0.006 0.000 0.000 -0.001 4523 JT Equity EISAI CO LTD Health Care 3150.00 4.76% 26.09.2012 17.10 20.21 20.65 20.63 -0.123 -0.048 -0.030 0.005 0.012 0.002 0.001 -0.001 8591 JT Equity ORIX CORP Financials 7140.00 1.97% 28.03.2012 30.79 32.49 33.50 34.16 -0.334 -0.291 -0.236 -0.130 0.008 0.004 0.003 0.001 8830 JT Equity SUMITOMO REALTY & DEVELOPMNT Financials 1471.00 1.36% 26.09.2012 33.86 33.72 34.02 33.96 -0.006 0.015 0.019 0.042 0.002 -0.002 -0.002 -0.001 5713 JT Equity SUMITOMO METAL MINING CO LTD Materials 1126.00 2.75% 26.09.2012 33.00 36.26 36.60 36.60 0.043 0.026 0.040 0.058 0.007 -0.001 0.000 0.000 7269 JT Equity SUZUKI MOTOR CORP Consumer Discretionary 1735.00 0.81% 26.09.2012 24.96 21.75 21.86 21.79 -0.109 -0.007 0.001 0.023 0.007 0.002 0.001 0.000 6988 JT Equity NITTO DENKO CORP Materials 2877.00 3.13% 26.09.2012 34.06 39.52 40.12 40.15 0.027 0.021 0.023 0.038 0.010 -0.001 -0.001 -0.001 6594 JT Equity NIDEC CORP Industrials 7150.00 1.26% 26.09.2012 9502 JT Equity CHUBU ELECTRIC POWER CO INC Utilities 1444.00 4.16% 26.09.2012 22.48 18.80 19.11 19.01 0.113 0.260 0.332 0.433 0.011 0.006 0.002 -0.003 4543 JT Equity TERUMO CORP Health Care 3640.00 0.91% 26.09.2012 26.50 25.69 26.03 26.31 -0.176 -0.159 -0.143 -0.055 0.005 0.004 0.003 0.001 8035 JT Equity TOKYO ELECTRON LTD Information Technology 4350.00 1.63% 26.09.2012 28.54 30.72 30.93 31.03 -0.074 -0.022 -0.008 0.015 0.005 0.000 0.000 0.000 4188 JT Equity MITSUBISHI CHEMICAL HOLDINGS Materials 442.00 2.26% 26.09.2012 28.98 28.96 29.36 29.55 0.056 0.049 0.051 0.080 0.008 -0.001 -0.002 -0.002 8795 JT Equity T&D HOLDINGS INC Financials 770.00 2.92% 27.03.2013 34.10 35.50 36.16 35.76 -0.045 -0.002 0.001 0.008 0.008 0.000 0.000 0.000 2502 JT Equity ASAHI GROUP HOLDINGS LTD Consumer Staples 1689.00 1.36% 27.06.2012 14.81 16.61 16.64 16.81 -0.117 -0.127 -0.080 -0.015 0.011 0.005 0.003 -0.001 6753 JT Equity SHARP CORP Consumer Discretionary 663.00 2.56% 28.03.2012 29.72 27.58 27.83 27.74 -0.021 -0.023 -0.021 -0.011 0.007 0.002 0.001 0.000 7731 JT Equity NIKON CORP Consumer Discretionary 1867.00 1.82% 26.09.2012 27.87 32.36 32.76 32.87 -0.022 0.012 0.025 0.052 0.009 0.000 0.000 -0.001 9202 JT Equity ALL NIPPON AIRWAYS CO LTD Industrials 222.00 0.90% 27.03.2013 26.45 26.31 26.43 26.29 -0.117 -0.054 -0.029 0.008 0.020 0.004 0.002 0.000 3407 JT Equity ASAHI KASEI CORP Materials 492.00 2.64% 26.09.2012 22.22 26.13 26.50 26.63 -0.067 -0.018 -0.002 0.024 0.019 0.001 0.000 -0.001 8601 JT Equity DAIWA SECURITIES GROUP INC Financials 272.00 4.04% 28.03.2012 33.56 29.21 29.71 30.12 -0.082 0.027 0.049 0.100 0.010 0.001 -0.001 -0.003 5405 JT Equity SUMITOMO METAL INDUSTRIES Materials 141.00 4.26% 26.09.2012 46.87 56.61 57.18 56.66 0.036 0.038 0.024 0.013 0.013 -0.002 -0.001 0.000 8267 JT Equity AEON CO LTD Consumer Staples 1012.00 2.27% 26.02.2013 14.95 15.10 15.04 14.94 0.087 0.023 0.031 0.043 0.022 0.013 0.008 0.000 6326 JT Equity KUBOTA CORP Industrials 682.00 2.05% 28.03.2012 30.29 31.89 32.14 32.27 -0.125 -0.009 0.008 0.034 0.009 0.000 0.000 0.000 1878 JT Equity DAITO TRUST CONSTRUCT CO LTD Financials 7130.00 4.11% 26.09.2012 6367 JT Equity DAIKIN INDUSTRIES LTD Industrials 2226.00 1.66% 26.09.2012 32.97 32.05 32.30 32.20 -0.144 -0.135 -0.121 -0.092 0.004 0.004 0.004 0.004 9831 JT Equity YAMADA DENKI CO LTD Consumer Discretionary 4860.00 1.56% 27.03.2013 30.56 35.77 36.21 36.19 -0.103 0.010 0.012 0.019 0.005 -0.001 -0.001 -0.002 7733 JT Equity OLYMPUS CORP Health Care 1276.00 2.74% 28.03.2012 51.08 25.17 25.27 25.06 -0.673 0.030 0.010 -0.018 -0.009 0.001 0.000 0.000 2802 JT Equity AJINOMOTO CO INC Consumer Staples 920.00 1.74% 26.09.2012 12.82 13.48 13.56 13.58 0.005 -0.045 -0.027 0.004 0.027 0.014 0.009 0.000 9021 JT Equity WEST JAPAN RAILWAY CO Industrials 3210.00 2.96% 26.09.2012 15.48 16.58 16.49 16.08 -0.035 -0.059 -0.026 0.024 0.015 0.005 0.003 0.000 4005 JT Equity SUMITOMO CHEMICAL CO LTD Materials 312.00 3.85% 26.09.2012 35.30 32.61 33.12 32.86 -0.077 -0.005 0.000 0.013 0.009 0.001 0.001 0.000 9983 JT Equity FAST RETAILING CO LTD Consumer Discretionary 15030.00 1.53% 26.02.2013 27.99 31.34 31.30 31.04 -0.003 0.008 0.009 0.012 0.005 0.000 0.000 0.000 9532 JT Equity OSAKA GAS CO LTD Utilities 306.00 2.61% 26.09.2012 11.80 8.15 8.42 8.59 -0.127 -0.109 -0.074 -0.022 0.042 0.030 0.023 0.007 1925 JT Equity DAIWA HOUSE INDUSTRY CO LTD Financials 974.00 2.57% 27.03.2013 22.57 23.93 24.48 24.40 -0.075 -0.008 -0.006 0.006 0.009 0.001 0.001 0.000 7912 JT Equity DAI NIPPON PRINTING CO LTD Industrials 809.00 3.96% 26.09.2012 25.34 25.61 26.00 26.13 -0.254 -0.130 -0.123 -0.112 0.010 0.005 0.005 0.004 7752 JT Equity RICOH CO LTD Information Technology 657.00 5.02% 26.09.2012 31.16 35.72 36.43 36.10 0.235 0.321 0.334 0.343 0.012 0.001 0.001 0.001 1928 JT Equity SEKISUI HOUSE LTD Consumer Discretionary 719.00 1.39% 27.07.2012 15.77 17.06 16.86 16.50 -0.141 -0.028 0.048 0.166 0.027 0.010 0.006 0.000 8332 JT Equity BANK OF YOKOHAMA LTD/THE Financials 358.00 2.79% 26.09.2012 1963 JT Equity JGC CORP Industrials 2076.00 1.85% 27.03.2013 9508 JT Equity KYUSHU ELECTRIC POWER CO INC Utilities 1160.00 5.17% 28.03.2012 21.69 19.80 20.30 20.29 0.141 0.339 0.437 0.585 0.015 0.005 0.001 -0.005 9064 JT Equity YAMATO HOLDINGS CO LTD Industrials 1271.00 1.73% 26.09.2012 21.09 19.91 20.32 20.64 -0.139 -0.054 -0.025 0.024 0.017 0.005 0.002 -0.002 9101 JT Equity NIPPON YUSEN Industrials 195.00 4.62% 26.09.2012 31.88 28.51 28.93 29.12 -0.027 0.170 0.227 0.310 0.011 0.000 -0.004 -0.010 6762 JT Equity TDK CORP Information Technology 3640.00 2.47% 26.09.2012 29.08 28.22 28.81 29.46 -0.092 -0.002 0.019 0.056 0.003 0.000 0.000 -0.001 5938 JT Equity JS GROUP CORP Industrials 1585.00 2.52% 26.09.2012 23.76 19.83 20.09 20.16 -0.134 -0.043 -0.017 0.037 0.008 0.003 0.001 -0.002 5406 JT Equity KOBE STEEL LTD Materials 128.00 3.52% 28.03.2012 31.76 29.61 29.60 29.01 -0.070 0.116 0.153 0.200 0.020 0.009 0.007 0.005 4911 JT Equity SHISEIDO CO LTD Consumer Staples 1400.00 3.57% 26.09.2012 20.87 20.52 20.66 20.31 -0.076 -0.052 -0.029 0.007 0.009 0.003 0.002 0.000 7259 JT Equity AISIN SEIKI CO LTD Consumer Discretionary 2434.00 2.26% 28.03.2012 30.14 31.83 31.98 32.03 0.119 0.117 0.122 0.147 0.006 -0.001 -0.001 0.000 5214 JT Equity NIPPON ELECTRIC GLASS CO LTD Information Technology 744.00 1.75% 26.09.2012 6645 JT Equity OMRON CORP Information Technology 1666.00 2.04% 26.09.2012 7012 JT Equity KAWASAKI HEAVY INDUSTRIES Industrials 222.00 1.80% 27.03.2013 31.67 34.00 34.43 34.61 -0.001 0.111 0.121 0.132 0.014 -0.004 -0.004 -0.006 6963 JT Equity ROHM CO LTD Information Technology 3760.00 2.13% 26.09.2012 24.41 25.55 25.74 25.96 -0.058 0.024 0.032 0.065 0.006 -0.002 -0.002 -0.002 6586 JT Equity MAKITA CORP Industrials 2858.00 2.20% 28.03.2012 9506 JT Equity TOHOKU ELECTRIC POWER CO INC Utilities 836.00 3.59% 26.09.2012 36.01 36.03 37.46 37.95 -0.061 0.050 0.131 0.229 0.003 -0.001 -0.002 -0.003 6201 JT Equity TOYOTA INDUSTRIES CORP Consumer Discretionary 2235.00 2.01% 26.09.2012 4528 JT Equity ONO PHARMACEUTICAL CO LTD Health Care 4280.00 4.21% 26.09.2012 9041 JT Equity KINTETSU CORP Industrials 302.00 1.66% 27.03.2013 8355 JT Equity SHIZUOKA BANK LTD/THE Financials 785.00 1.72% 26.09.2012 7202 JT Equity ISUZU MOTORS LTD Consumer Discretionary 393.00 1.53% 26.09.2012 23.11 28.10 28.28 28.39 -0.146 -0.053 -0.042 -0.021 0.017 0.001 0.000 -0.001 6701 JT Equity NEC CORP Information Technology 156.00 27.03.2013 30.72 28.05 28.48 28.03 -0.104 0.112 0.132 0.163 0.017 0.005 0.003 0.000 8308 JT Equity RESONA HOLDINGS INC Financials 344.00 3.49% 27.03.2013 24.05 29.07 29.82 29.51 -0.100 -0.019 -0.007 0.014 0.020 0.002 0.001 0.000 7272 JT Equity YAMAHA MOTOR CO LTD Consumer Discretionary 1024.00 1.95% 26.12.2012 9042 JT Equity HANKYU HANSHIN HOLDINGS INC Industrials 337.00 1.48% 27.03.2013 4507 JT Equity SHIONOGI & CO LTD Health Care 1000.00 4.10% 26.09.2012 4324 JT Equity DENTSU INC Consumer Discretionary 2511.00 1.19% 26.09.2012 21.69 24.24 24.42 24.52 -0.140 -0.020 -0.012 0.005 0.011 0.001 0.000 -0.001 Q.M.S Advisors | tel: +41 (0)78 922 08 77 | e-mail: info@qmsadv.com |
- 2. 27.01.2012 Option Implied Volatility Skew Parameters by Terms: At The Money Implied Volatilities by Terms IVt = atx + btx2 + ct Next Ex- Skew Skew Skew Skew Skew Skew Skew Skew Skew Skew Skew Skew Skew Skew Dividend ATM Vol - ATM Vol - ATM Vol - ATM Vol - ATM Vol - ATM Vol - ATM Vol - Ticker Name GICS_SECTOR_NAME ATM Ref Dividend (a) - (a) - (a) - (a) - (a) - (a) - (a) - (b) - (b) - (b) - (b) - (b) - (b) - (b) - Yield 30D 60D 90D 6M 12M 18M 24M Date 30D 60D 90D 6M 12M 18M 24M 30D 60D 90D 6M 12M 18M 24M 9104 JT Equity MITSUI OSK LINES LTD Industrials 291.00 2.92% 26.09.2012 34.78 23.75 24.01 24.04 -0.143 0.054 0.114 0.222 0.005 0.002 -0.001 -0.004 4689 JT Equity YAHOO JAPAN CORP Information Technology 23330.00 1.44% 27.03.2013 27.94 25.47 25.86 25.89 0.016 0.006 0.008 0.024 -0.003 0.000 -0.001 -0.001 7211 JT Equity MITSUBISHI MOTORS CORP Consumer Discretionary 92.00 9007 JT Equity ODAKYU ELECTRIC RAILWAY CO Industrials 742.00 0.94% 26.09.2012 8113 JT Equity UNICHARM CORP Consumer Staples 3945.00 0.81% 26.09.2012 16.70 16.47 16.48 16.39 -0.189 -0.081 -0.045 0.008 0.012 0.004 0.002 0.000 8331 JT Equity CHIBA BANK LTD/THE Financials 476.00 2.31% 26.09.2012 4661 JT Equity ORIENTAL LAND CO LTD Consumer Discretionary 7990.00 1.25% 26.09.2012 15.68 15.52 15.58 15.50 -0.072 -0.064 -0.036 0.007 0.008 0.005 0.003 0.000 3405 JT Equity KURARAY CO LTD Materials 1132.00 2.74% 26.09.2012 23.99 23.82 24.72 26.34 -0.127 -0.113 -0.118 -0.114 0.007 0.003 0.003 0.003 7270 JT Equity FUJI HEAVY INDUSTRIES LTD Consumer Discretionary 516.00 1.74% 26.09.2012 9005 JT Equity TOKYU CORP Industrials 369.00 1.76% 26.09.2012 20.83 20.63 20.71 20.54 -0.055 -0.067 -0.036 0.011 0.016 0.008 0.005 0.000 4902 JT Equity KONICA MINOLTA HOLDINGS INC Information Technology 577.00 2.60% 26.09.2012 36.11 37.32 37.67 37.66 0.015 0.049 0.062 0.080 0.004 -0.003 -0.003 -0.003 5333 JT Equity NGK INSULATORS LTD Industrials 972.00 2.06% 26.09.2012 33.92 33.90 34.78 35.72 -0.068 -0.040 -0.036 -0.012 0.007 0.002 0.002 0.001 9613 JT Equity NTT DATA CORP Information Technology 250300.00 2.40% 26.09.2012 26.46 33.17 33.58 33.83 -0.018 -0.014 -0.009 -0.001 0.010 0.000 0.000 -0.001 7309 JT Equity SHIMANO INC Consumer Discretionary 3710.00 0.34% 27.06.2012 7911 JT Equity TOPPAN PRINTING CO LTD Industrials 611.00 3.27% 26.09.2012 25.70 25.20 25.39 25.07 -0.132 -0.007 -0.001 0.010 0.010 0.001 0.001 0.000 6471 JT Equity NSK LTD Industrials 567.00 1.94% 26.09.2012 33.96 33.30 33.43 33.05 -0.101 0.003 0.004 0.009 0.005 0.000 0.000 0.000 6460 JT Equity SEGA SAMMY HOLDINGS INC Consumer Discretionary 1600.00 2.50% 26.09.2012 5012 JT Equity TONENGENERAL SEKIYU KK Energy 748.00 5.08% 27.06.2012 25.63 25.39 25.36 25.67 0.053 0.008 0.007 0.010 0.008 0.000 0.000 0.000 9501 JT Equity TOKYO ELECTRIC POWER CO INC Utilities 209.00 26.09.2012 56.93 18.55 18.64 18.77 0.060 0.001 0.064 0.159 -0.043 0.012 0.008 0.001 9001 JT Equity TOBU RAILWAY CO LTD Industrials 393.00 1.27% 26.09.2012 3861 JT Equity OJI PAPER CO LTD Materials 389.00 2.57% 26.09.2012 16.78 16.70 16.83 16.68 -0.077 -0.010 -0.002 0.010 0.023 0.011 0.006 0.000 9507 JT Equity SHIKOKU ELECTRIC POWER CO Utilities 2293.00 2.40% 26.09.2012 4062 JT Equity IBIDEN CO LTD Information Technology 1590.00 2.52% 28.03.2012 31.11 28.81 28.90 28.63 -0.084 -0.006 -0.010 -0.012 0.005 0.000 0.000 0.000 5711 JT Equity MITSUBISHI MATERIALS CORP Materials 242.00 1.24% 27.03.2013 31.69 33.36 33.72 33.89 -0.086 -0.025 -0.015 0.004 0.015 0.001 0.001 0.000 7261 JT Equity MAZDA MOTOR CORP Consumer Discretionary 131.00 27.03.2013 4535 JT Equity TAISHO PHARMACEUTICAL CO LTD #N/A N/A #N/A N/A 28.03.2012 9504 JT Equity CHUGOKU ELECTRIC POWER CO Utilities 1437.00 3.48% 26.09.2012 16.82 15.15 16.41 17.84 -0.100 0.129 0.200 0.317 0.016 0.008 0.004 -0.003 6448 JT Equity BROTHER INDUSTRIES LTD Information Technology 1042.00 2.30% 26.09.2012 6302 JT Equity SUMITOMO HEAVY INDUSTRIES Industrials 492.00 1.22% 27.03.2013 8015 JT Equity TOYOTA TSUSHO CORP Industrials 1445.00 2.70% 26.09.2012 7262 JT Equity DAIHATSU MOTOR CO LTD Consumer Discretionary 1501.00 1.67% 28.03.2012 3099 JT Equity ISETAN MITSUKOSHI HOLDINGS L Consumer Discretionary 849.00 1.18% 27.03.2013 4204 JT Equity SEKISUI CHEMICAL CO LTD Consumer Discretionary 680.00 2.06% 26.09.2012 3401 JT Equity TEIJIN LTD Materials 251.00 2.39% 26.09.2012 2651 JT Equity LAWSON INC Consumer Staples 4570.00 3.89% 29.08.2012 4519 JT Equity CHUGAI PHARMACEUTICAL CO LTD Health Care 1185.00 3.21% 27.06.2012 17.48 17.72 17.79 18.16 -0.040 -0.063 -0.034 0.010 0.021 0.008 0.004 -0.001 4185 JT Equity JSR CORP Materials 1581.00 2.02% 26.09.2012 9006 JT Equity KEIKYU CORP Industrials 688.00 0.87% 26.09.2012 9843 JT Equity NITORI HOLDINGS CO LTD Consumer Discretionary 6940.00 1.73% 16.08.2012 8729 JT Equity SONY FINANCIAL HOLDINGS INC Financials 1232.00 1.62% 27.03.2013 6370 JT Equity KURITA WATER INDUSTRIES LTD Industrials 2083.00 1.87% 26.09.2012 2267 JT Equity YAKULT HONSHA CO LTD Consumer Staples 2324.00 0.95% 26.09.2012 6417 JT Equity SANKYO CO LTD Consumer Discretionary 3715.00 4.04% 26.09.2012 6806 JT Equity HIROSE ELECTRIC CO LTD Information Technology 7240.00 1.80% 26.09.2012 25.81 25.45 25.50 25.29 -0.070 0.003 0.005 0.009 0.005 0.000 0.000 0.000 6965 JT Equity HAMAMATSU PHOTONICS KK Information Technology 2791.00 1.65% 27.03.2013 2432 JT Equity DENA CO LTD Information Technology 1910.00 1.94% 28.03.2012 56.06 55.07 55.59 54.72 0.007 0.010 0.015 0.024 0.000 0.000 0.000 0.000 7013 JT Equity IHI CORP Industrials 198.00 1.52% 27.03.2013 35.76 44.04 44.47 44.40 0.038 0.020 0.019 0.027 0.019 -0.002 -0.002 -0.002 6481 JT Equity THK CO LTD Industrials 1630.00 1.23% 26.09.2012 4183 JT Equity MITSUI CHEMICALS INC Materials 247.00 2.43% 26.09.2012 36.06 35.77 35.92 35.51 -0.066 0.001 0.003 0.010 0.010 0.000 0.000 0.000 8369 JT Equity BANK OF KYOTO LTD/THE Financials 668.00 1.50% 26.09.2012 9062 JT Equity NIPPON EXPRESS CO LTD Industrials 308.00 3.25% 26.09.2012 18.01 19.01 19.15 18.97 -0.214 -0.077 -0.049 -0.001 0.026 0.012 0.008 0.001 9505 JT Equity HOKURIKU ELECTRIC POWER CO Utilities 1509.00 3.31% 26.09.2012 Topix Index (Top 1000) 8354 JT Equity FUKUOKA FINANCIAL GROUP INC Financials 327.00 2.45% 26.09.2012 4508 JT Equity MITSUBISHI TANABE PHARMA Health Care 1064.00 2.73% 26.09.2012 8333 JT Equity JOYO BANK LTD/THE Financials 338.00 2.37% 26.09.2012 1802 JT Equity OBAYASHI CORP Industrials 365.00 2.19% 26.09.2012 19.55 21.00 21.20 21.17 -0.183 -0.065 -0.038 0.007 0.025 0.008 0.005 0.000 2897 JT Equity NISSIN FOODS HOLDINGS CO LTD Consumer Staples 2922.00 2.40% 26.09.2012 6473 JT Equity JTEKT CORP Industrials 838.00 1.91% 26.09.2012 1812 JT Equity KAJIMA CORP Industrials 258.00 2.52% 26.09.2012 30.84 33.91 34.23 34.26 -0.084 -0.022 -0.014 -0.002 0.013 0.001 0.001 -0.001 5202 JT Equity NIPPON SHEET GLASS CO LTD Industrials 157.00 3.82% 26.09.2012 35.32 36.20 36.48 35.88 -0.128 0.005 0.007 0.012 0.013 -0.001 0.000 0.001 4004 JT Equity SHOWA DENKO K K Materials 165.00 1.82% 26.12.2012 9513 JT Equity ELECTRIC POWER DEVELOPMENT C Utilities 2081.00 3.36% 26.09.2012 9783 JT Equity BENESSE HOLDINGS INC Consumer Discretionary 3460.00 2.75% 26.09.2012 5019 JT Equity IDEMITSU KOSAN CO LTD Energy 8580.00 1.75% 26.09.2012 4676 JT Equity FUJI MEDIA HOLDINGS INC Consumer Discretionary 114600.00 1.57% 26.09.2012 20.23 18.24 18.51 18.67 0.018 -0.002 -0.002 -0.012 0.002 0.000 0.000 0.000 1803 JT Equity SHIMIZU CORP Industrials 348.00 2.01% 26.09.2012 25.92 25.57 25.76 25.59 -0.176 -0.051 -0.029 0.006 0.014 0.002 0.001 0.000 2269 JT Equity MEIJI HOLDINGS CO LTD Consumer Staples 3295.00 2.43% 26.09.2012 9008 JT Equity KEIO CORP Industrials 552.00 1.09% 26.09.2012 7936 JT Equity ASICS CORP Consumer Discretionary 867.00 1.38% 27.03.2013 4208 JT Equity UBE INDUSTRIES LTD Materials 222.00 2.25% 27.03.2013 4704 JT Equity TREND MICRO INC Information Technology 2399.00 3.58% 26.12.2012 22.85 22.33 22.44 22.62 -0.119 -0.020 -0.008 0.011 0.010 0.001 0.000 -0.001 7832 JT Equity NAMCO BANDAI HOLDINGS INC Consumer Discretionary 1048.00 2.29% 26.09.2012 9509 JT Equity HOKKAIDO ELECTRIC POWER CO Utilities 1127.00 4.44% 26.09.2012 4536 JT Equity SANTEN PHARMACEUTICAL CO LTD Health Care 3095.00 3.23% 26.09.2012 6869 JT Equity SYSMEX CORP Health Care 2496.00 0.90% 26.09.2012 4530 JT Equity HISAMITSU PHARMACEUTICAL CO Health Care 3310.00 2.15% 29.08.2012 8377 JT Equity HOKUHOKU FINANCIAL GROUP INC Financials 153.00 2.45% 27.03.2013 9533 JT Equity TOHO GAS CO LTD Utilities 482.00 1.66% 26.09.2012 6674 JT Equity GS YUASA CORP Industrials 451.00 1.77% 27.03.2013 25.54 25.13 25.34 24.95 -0.214 -0.061 -0.033 0.010 0.010 0.001 0.000 0.000 2002 JT Equity NISSHIN SEIFUN GROUP INC Consumer Staples 919.00 2.18% 26.09.2012 20.26 19.18 19.87 21.56 0.013 -0.037 -0.054 -0.089 0.012 0.004 0.002 0.001 6857 JT Equity ADVANTEST CORP Information Technology 727.00 2.75% 26.09.2012 37.57 41.45 42.10 42.25 0.136 0.120 0.150 0.205 0.004 -0.002 -0.003 -0.003 1801 JT Equity TAISEI CORP Industrials 211.00 2.61% 26.09.2012 22.93 21.50 21.70 21.58 -0.147 -0.084 -0.048 0.011 0.025 0.009 0.006 0.001 4151 JT Equity KYOWA HAKKO KIRIN CO LTD Health Care 927.00 2.16% 27.06.2012 4182 JT Equity MITSUBISHI GAS CHEMICAL CO Materials 443.00 2.26% 26.09.2012 5334 JT Equity NGK SPARK PLUG CO LTD Consumer Discretionary 960.00 2.29% 26.09.2012 9404 JT Equity NIPPON TELEVISION NETWORK Consumer Discretionary 11650.00 2.49% 26.09.2012 19.46 18.64 18.93 19.01 -0.058 -0.016 -0.007 0.011 0.011 0.001 0.000 -0.001 8379 JT Equity HIROSHIMA BANK LTD/THE Financials 356.00 1.40% 26.09.2012 6472 JT Equity NTN CORP Industrials 326.00 3.68% 26.09.2012 5947 JT Equity RINNAI CORP Consumer Discretionary 5320.00 1.02% 26.09.2012 8028 JT Equity FAMILYMART CO LTD Consumer Staples 3035.00 2.57% 29.08.2012 20.57 20.41 20.34 20.10 -0.005 -0.019 -0.008 0.006 0.009 0.002 0.001 0.000 5801 JT Equity FURUKAWA ELECTRIC CO LTD Industrials 203.00 2.96% 28.03.2012 35.34 29.94 29.32 28.17 -0.031 0.084 0.141 0.229 0.009 0.004 0.004 0.005 2768 JT Equity SOJITZ CORP Industrials 134.00 2.24% 26.09.2012 23.98 24.52 25.10 25.48 -0.096 -0.077 -0.039 0.017 0.030 0.012 0.007 0.000 6925 JT Equity USHIO INC Industrials 1104.00 2.17% 27.03.2013 4307 JT Equity NOMURA RESEARCH INSTITUTE LT Information Technology 1758.00 2.96% 26.09.2012 25.00 30.44 30.79 30.80 -0.005 -0.010 -0.003 0.018 0.006 0.000 -0.001 -0.001 6506 JT Equity YASKAWA ELECTRIC CORP Information Technology 683.00 1.46% 18.09.2012 2875 JT Equity TOYO SUISAN KAISHA LTD Consumer Staples 1829.00 2.19% 26.09.2012 6665 JT Equity ELPIDA MEMORY INC Information Technology 338.00 56.55 48.56 49.24 50.20 0.187 0.145 0.170 0.227 -0.008 -0.002 -0.003 -0.002 8334 JT Equity GUNMA BANK LTD/THE Financials 413.00 2.18% 26.09.2012 5631 JT Equity JAPAN STEEL WORKS LTD Industrials 600.00 1.83% 26.09.2012 29.17 23.16 23.23 22.95 -0.189 -0.049 -0.027 0.008 0.006 0.003 0.002 0.000 6923 JT Equity STANLEY ELECTRIC CO LTD Consumer Discretionary 1222.00 2.13% 26.09.2012 6724 JT Equity SEIKO EPSON CORP Information Technology 985.00 2.64% 26.09.2012 8253 JT Equity CREDIT SAISON CO LTD Financials 1496.00 2.01% 27.03.2013 31.13 30.68 31.02 30.59 -0.052 0.000 0.003 0.009 0.006 0.000 0.000 0.000 8136 JT Equity SANRIO CO LTD Consumer Discretionary 3410.00 1.03% 26.09.2012 3436 JT Equity SUMCO CORP Information Technology 662.00 47.43 40.34 40.46 40.77 0.133 0.169 0.166 0.187 -0.008 -0.001 -0.001 -0.001 5901 JT Equity TOYO SEIKAN KAISHA LTD Materials 1116.00 0.90% 26.09.2012 30.21 29.90 30.58 31.71 -0.176 -0.114 -0.105 -0.039 0.006 0.004 0.003 0.002 8473 JT Equity SBI HOLDINGS INC Financials 5800.00 1.72% 28.03.2012 45.29 50.54 51.17 50.95 0.040 0.016 0.024 0.055 0.007 -0.001 -0.002 -0.001 6113 JT Equity AMADA CO LTD Industrials 512.00 2.34% 26.09.2012 4091 JT Equity TAIYO NIPPON SANSO CORP Materials 529.00 2.27% 26.09.2012 4061 JT Equity DENKI KAGAKU KOGYO K K Materials 308.00 3.25% 26.09.2012 5332 JT Equity TOTO LTD Industrials 622.00 1.61% 26.09.2012 2282 JT Equity NIPPON MEAT PACKERS INC Consumer Staples 978.00 1.64% 27.03.2013 4114 JT Equity NIPPON SHOKUBAI CO LTD Materials 870.00 2.53% 26.09.2012 5471 JT Equity DAIDO STEEL CO LTD Materials 511.00 1.47% 26.09.2012 7701 JT Equity SHIMADZU CORP Information Technology 658.00 1.29% 26.09.2012 2212 JT Equity YAMAZAKI BAKING CO LTD Consumer Staples 1010.00 1.49% 26.12.2012 3632 JT Equity GREE INC Information Technology 2126.00 0.42% 27.06.2012 51.59 50.94 50.78 50.61 0.005 0.004 0.005 0.007 0.000 0.000 0.000 0.000 8905 JT Equity AEON MALL CO LTD Financials 1708.00 1.17% 16.08.2012 4613 JT Equity KANSAI PAINT CO LTD Materials 713.00 1.40% 26.09.2012 4042 JT Equity TOSOH CORP Materials 224.00 1.79% 28.03.2012 9602 JT Equity TOHO CO LTD Consumer Discretionary 1324.00 1.51% 29.08.2012 4088 JT Equity AIR WATER INC Materials 1011.00 2.18% 26.09.2012 4544 JT Equity MIRACA HOLDINGS INC Health Care 2824.00 2.48% 26.09.2012 9107 JT Equity KAWASAKI KISEN KAISHA LTD Industrials 144.00 2.08% 26.09.2012 9364 JT Equity KAMIGUMI CO LTD Industrials 672.00 1.34% 27.03.2013 6305 JT Equity HITACHI CONSTRUCTION MACHINE Industrials 1461.00 2.05% 26.09.2012 3893 JT Equity NIPPON PAPER GROUP INC Materials 1619.00 3.71% 26.09.2012 30.45 30.03 30.17 29.81 -0.078 0.003 0.005 0.010 0.004 0.000 0.000 0.000 Q.M.S Advisors | tel: +41 (0)78 922 08 77 | e-mail: info@qmsadv.com |
- 3. 27.01.2012 Option Implied Volatility Skew Parameters by Terms: At The Money Implied Volatilities by Terms 2 IVt = atx + btx + ct Next Ex- Skew Skew Skew Skew Skew Skew Skew Skew Skew Skew Skew Skew Skew Skew Dividend ATM2 ATM2 ATM2 ATM2 ATM2 ATM2 ATM2 Ticker Name GICS_SECTOR_NAME ATM2 Ref Dividend (a) - (a) - (a) - (a) - (a) - (a) - (a) - (b) - (b) - (b) - (b) - (b) - (b) - (b) - Yield Vol - 30D Vol - 60D Vol - 90D Vol - 6M Vol - 12M Vol - 18M Vol - 24M Date 30D 60D 90D 6M 12M 18M 24M 30D 60D 90D 6M 12M 18M 24M 9766 JT Equity KONAMI CORP Information Technology 1924.00 1.66% 26.09.2012 38.69 43.28 43.72 44.05 -0.157 -0.020 -0.026 -0.009 0.007 0.000 0.000 -0.001 8359 JT Equity HACHIJUNI BANK LTD/THE Financials 447.00 1.45% 26.09.2012 4732 JT Equity USS CO LTD Consumer Discretionary 7350.00 3.01% 26.09.2012 8227 JT Equity SHIMAMURA CO LTD Consumer Discretionary 7890.00 1.61% 16.08.2012 6361 JT Equity EBARA CORP Industrials 301.00 1.66% 27.03.2013 8327 JT Equity NISHI-NIPPON CITY BANK LTD Financials 225.00 2.22% 26.09.2012 9045 JT Equity KEIHAN ELECTRIC RAILWAY CO Industrials 377.00 1.33% 26.09.2012 5706 JT Equity MITSUI MINING & SMELTING CO Materials 219.00 2.28% 28.03.2012 35.96 35.78 36.57 36.40 -0.081 0.008 0.043 0.085 0.010 -0.001 -0.001 -0.002 9987 JT Equity SUZUKEN CO LTD Health Care 2226.00 2.25% 26.09.2012 7735 JT Equity DAINIPPON SCREEN MFG CO LTD Information Technology 634.00 0.79% 27.03.2013 2784 JT Equity ALFRESA HOLDINGS CORP Health Care 3290.00 2.74% 26.09.2012 8593 JT Equity MITSUBISHI UFJ LEASE & FINAN Financials 3260.00 1.63% 26.09.2012 8382 JT Equity CHUGOKU BANK LTD/THE Financials 1045.00 1.24% 26.09.2012 3086 JT Equity J FRONT RETAILING CO LTD Consumer Discretionary 371.00 1.89% 29.08.2012 4217 JT Equity HITACHI CHEMICAL CO LTD Materials 1364.00 2.71% 26.09.2012 2801 JT Equity KIKKOMAN CORP Consumer Staples 880.00 1.70% 27.03.2013 8385 JT Equity IYO BANK LTD/THE Financials 741.00 1.08% 26.09.2012 4631 JT Equity DIC CORP Materials 148.00 3.38% 26.09.2012 35.81 35.24 35.64 35.49 -0.090 -0.029 -0.013 0.011 0.012 0.003 0.001 -0.001 5486 JT Equity HITACHI METALS LTD Materials 848.00 1.42% 26.09.2012 4540 JT Equity TSUMURA & CO Health Care 2250.00 2.53% 26.09.2012 6504 JT Equity FUJI ELECTRIC CO LTD Industrials 203.00 0.99% 28.03.2012 5002 JT Equity SHOWA SHELL SEKIYU KK Energy 548.00 3.28% 27.06.2012 5110 JT Equity SUMITOMO RUBBER INDUSTRIES Consumer Discretionary 913.00 1.75% 27.06.2012 8282 JT Equity K'S HOLDINGS CORP Consumer Discretionary 2694.00 2.23% 26.09.2012 8252 JT Equity MARUI GROUP CO LTD Consumer Discretionary 611.00 2.29% 26.09.2012 23.20 24.46 24.73 24.65 -0.131 -0.022 -0.006 0.020 0.015 0.004 0.002 0.000 7951 JT Equity YAMAHA CORP Consumer Discretionary 702.00 1.28% 26.09.2012 9048 JT Equity NAGOYA RAILROAD CO LTD Industrials 217.00 1.15% 28.03.2012 5463 JT Equity MARUICHI STEEL TUBE LTD Materials 1813.00 2.65% 26.09.2012 8815 JT Equity TOKYU LAND CORP Financials 320.00 2.19% 26.09.2012 9009 JT Equity KEISEI ELECTRIC RAILWAY CO Industrials 565.00 0.88% 26.09.2012 6268 JT Equity NABTESCO CORP Industrials 1631.00 2.08% 26.09.2012 5726 JT Equity OSAKA TITANIUM TECHNOLOGIES Materials 3700.00 0.54% 27.03.2013 4118 JT Equity KANEKA CORP Materials 437.00 3.66% 26.09.2012 4202 JT Equity DAICEL CORP Materials 495.00 1.82% 26.09.2012 8418 JT Equity YAMAGUCHI FINANCIAL GROUP IN Financials 732.00 1.50% 26.09.2012 4205 JT Equity ZEON CORP Materials 690.00 1.45% 26.09.2012 8358 JT Equity SURUGA BANK LTD Financials 680.00 1.91% 26.09.2012 1662 JT Equity JAPAN PETROLEUM EXPLORATION Energy 3420.00 1.17% 26.09.2012 5007 JT Equity COSMO OIL COMPANY LTD Energy 226.00 3.54% 27.03.2013 7003 JT Equity MITSUI ENGINEER & SHIPBUILD Industrials 139.00 2.88% 27.03.2013 5233 JT Equity TAIHEIYO CEMENT CORP Materials 164.00 2.44% 26.09.2012 6366 JT Equity CHIYODA CORP Industrials 850.00 1.18% 27.03.2013 8233 JT Equity TAKASHIMAYA CO LTD Consumer Discretionary 592.00 1.69% 29.08.2012 7459 JT Equity MEDIPAL HOLDINGS CORP Health Care 824.00 2.18% 26.09.2012 7240 JT Equity NOK CORP Consumer Discretionary 1442.00 1.04% 28.03.2012 6770 JT Equity ALPS ELECTRIC CO LTD Information Technology 588.00 3.40% 26.09.2012 40.99 43.56 44.23 43.94 0.010 -0.007 -0.001 0.011 0.006 -0.001 -0.001 -0.001 9962 JT Equity MISUMI GROUP INC Industrials 1781.00 1.26% 26.09.2012 9044 JT Equity NANKAI ELECTRIC RAILWAY CO Industrials 345.00 1.45% 27.03.2013 4043 JT Equity TOKUYAMA CORPORATION Materials 268.00 2.24% 26.09.2012 6841 JT Equity YOKOGAWA ELECTRIC CORP Information Technology 736.00 0.27% 28.03.2012 9301 JT Equity MITSUBISHI LOGISTICS CORP Industrials 874.00 1.37% 26.09.2012 30.63 30.24 30.28 30.01 -0.102 0.003 0.005 0.010 0.005 0.000 0.000 0.000 Topix Index (Top 1000) 4021 JT Equity NISSAN CHEMICAL INDUSTRIES Materials 773.00 3.10% 26.09.2012 8404 JT Equity MIZUHO TRUST & BANKING CO #N/A N/A #N/A N/A 7276 JT Equity KOITO MANUFACTURING CO LTD Consumer Discretionary 1258.00 1.83% 28.03.2012 8304 JT Equity AOZORA BANK LTD Financials 212.00 4.25% 27.03.2013 3591 JT Equity WACOAL HOLDINGS CORP Consumer Discretionary 990.00 2.32% 27.03.2013 5444 JT Equity YAMATO KOGYO CO LTD Materials 2414.00 1.24% 26.09.2012 5407 JT Equity NISSHIN STEEL CO LTD Materials 123.00 1.63% 28.03.2012 6479 JT Equity MINEBEA CO LTD Industrials 336.00 2.38% 26.09.2012 40.74 40.15 40.32 39.88 -0.063 0.014 0.013 0.013 0.002 -0.001 0.000 0.000 5714 JT Equity DOWA HOLDINGS CO LTD Materials 514.00 1.95% 27.03.2013 2433 JT Equity HAKUHODO DY HOLDINGS INC Consumer Discretionary 4605.00 1.52% 26.09.2012 5991 JT Equity NHK SPRING CO LTD Consumer Discretionary 738.00 2.17% 28.03.2012 2811 JT Equity KAGOME CO LTD Consumer Staples 1506.00 1.00% 27.03.2013 4967 JT Equity KOBAYASHI PHARMACEUTICAL CO Consumer Staples 3915.00 1.79% 26.09.2012 4272 JT Equity NIPPON KAYAKU CO LTD Materials 736.00 2.72% 28.11.2012 2809 JT Equity KEWPIE CORP Consumer Staples 1128.00 1.68% 29.05.2013 8303 JT Equity SHINSEI BANK LTD Financials 83.00 1.20% 27.03.2013 4555 JT Equity SAWAI PHARMACEUTICAL CO LTD Health Care 7900.00 1.52% 26.09.2012 4612 JT Equity NIPPON PAINT CO LTD Materials 563.00 1.42% 26.09.2012 8804 JT Equity TOKYO TATEMONO CO LTD Financials 269.00 2.97% 27.06.2012 6141 JT Equity MORI SEIKI CO LTD Industrials 743.00 2.69% 26.09.2012 8270 JT Equity UNY CO LTD Consumer Staples 718.00 2.65% 16.08.2012 4506 JT Equity DAINIPPON SUMITOMO PHARMA CO Health Care 857.00 2.10% 26.09.2012 6146 JT Equity DISCO CORP Information Technology 4055.00 1.11% 26.09.2012 4716 JT Equity ORACLE CORP JAPAN Information Technology 2653.00 5.35% 28.11.2012 24.61 24.08 23.77 23.95 -0.081 -0.012 -0.003 0.012 0.004 0.001 0.001 0.000 6592 JT Equity MABUCHI MOTOR CO LTD Industrials 3250.00 1.85% 27.06.2012 25.52 25.20 25.10 25.29 -0.054 0.008 0.007 -0.013 0.008 0.000 0.000 0.000 7205 JT Equity HINO MOTORS LTD Industrials 512.00 1.17% 28.03.2012 1911 JT Equity SUMITOMO FORESTRY CO LTD Consumer Discretionary 695.00 2.16% 26.09.2012 6952 JT Equity CASIO COMPUTER CO LTD Consumer Discretionary 471.00 3.61% 28.03.2012 30.50 31.97 32.91 32.67 0.000 0.104 0.128 0.155 0.008 -0.004 -0.003 -0.003 8341 JT Equity 77 BANK LTD/THE Financials 348.00 2.01% 26.09.2012 5803 JT Equity FUJIKURA LTD Industrials 237.00 2.95% 28.03.2012 37.35 36.57 36.84 36.42 -0.082 0.027 0.077 0.139 0.006 -0.001 -0.001 -0.001 2810 JT Equity HOUSE FOODS CORPORATION Consumer Staples 1440.00 1.81% 26.09.2012 4912 JT Equity LION CORP Consumer Staples 463.00 2.16% 27.06.2012 8012 JT Equity NAGASE & CO LTD Industrials 909.00 2.64% 26.09.2012 4203 JT Equity SUMITOMO BAKELITE CO LTD Materials 457.00 3.28% 26.09.2012 2579 JT Equity COCA-COLA WEST CO LTD Consumer Staples 1331.00 3.23% 27.06.2012 9401 JT Equity TOKYO BROADCASTING SYSTEM Consumer Discretionary 1017.00 0.98% 26.09.2012 4521 JT Equity KAKEN PHARMACEUTICAL CO LTD Health Care 1000.00 4.00% 26.09.2012 7532 JT Equity DON QUIJOTE CO LTD Consumer Discretionary 2761.00 1.09% 26.12.2012 3231 JT Equity NOMURA REAL ESTATE HOLDINGS Financials 1193.00 2.10% 26.09.2012 5101 JT Equity YOKOHAMA RUBBER CO LTD Consumer Discretionary 456.00 2.19% 27.06.2012 7966 JT Equity LINTEC CORP Materials 1452.00 2.75% 26.09.2012 8036 JT Equity HITACHI HIGH-TECHNOLOGIES CO Information Technology 1712.00 1.31% 26.09.2012 3101 JT Equity TOYOBO CO LTD Consumer Discretionary 112.00 3.13% 27.03.2013 3105 JT Equity NISSHINBO HOLDINGS INC Industrials 777.00 1.93% 26.09.2012 2501 JT Equity SAPPORO HOLDINGS LTD Consumer Staples 295.00 2.37% 26.12.2012 6976 JT Equity TAIYO YUDEN CO LTD Information Technology 689.00 1.09% 26.09.2012 46.40 47.50 47.60 47.38 -0.091 -0.073 -0.068 -0.021 0.002 0.002 0.002 0.001 4684 JT Equity OBIC CO LTD Information Technology 14740.00 2.37% 26.09.2012 6845 JT Equity YAMATAKE CORP Information Technology 1685.00 3.77% 26.09.2012 7004 JT Equity HITACHI ZOSEN CORP Industrials 109.00 1.83% 27.03.2013 6773 JT Equity PIONEER CORP Consumer Discretionary 364.00 30.84 30.33 30.20 30.06 -0.118 -0.015 -0.006 0.009 0.010 0.001 0.001 0.000 6136 JT Equity OSG CORP Industrials 1113.00 2.07% 29.05.2013 7282 JT Equity TOYODA GOSEI CO LTD Consumer Discretionary 1241.00 2.90% 26.09.2012 1944 JT Equity KINDEN CORP Industrials 652.00 1.84% 26.09.2012 22.08 20.97 21.32 21.52 -0.161 -0.045 -0.027 0.004 0.018 0.005 0.003 -0.001 2593 JT Equity ITO EN LTD Consumer Staples 1304.00 2.91% 29.10.2012 8933 JT Equity NTT URBAN DEVELOPMENT CORP Financials 56500.00 2.12% 26.09.2012 6103 JT Equity OKUMA CORP Industrials 554.00 1.08% 26.09.2012 6457 JT Equity GLORY LTD Industrials 1674.00 2.45% 26.09.2012 8328 JT Equity SAPPORO HOKUYO HOLDINGS INC Financials 287.00 1.05% 26.09.2012 7762 JT Equity CITIZEN HOLDINGS CO LTD Information Technology 469.00 1.71% 26.09.2012 5423 JT Equity TOKYO STEEL MFG CO LTD Materials 589.00 1.02% 26.09.2012 4665 JT Equity DUSKIN CO LTD Industrials 1501.00 2.66% 27.03.2013 9989 JT Equity SUNDRUG CO LTD Consumer Staples 2281.00 1.58% 26.09.2012 8606 JT Equity MIZUHO SECURITIES CO LTD #N/A N/A #N/A N/A 8570 JT Equity AEON CREDIT SERVICE CO LTD Financials 1144.00 3.50% 16.08.2012 2871 JT Equity NICHIREI CORP Consumer Staples 376.00 2.66% 26.09.2012 9031 JT Equity NISHI-NIPPON RAILROAD CO LTD Industrials 378.00 1.59% 26.09.2012 9076 JT Equity SEINO HOLDINGS CO LTD Industrials 592.00 1.86% 27.03.2013 6474 JT Equity NACHI-FUJIKOSHI CORP Industrials 390.00 1.54% 27.11.2013 4569 JT Equity KYORIN HOLDINGS INC Health Care 1322.00 3.40% 26.09.2012 4045 JT Equity TOAGOSEI CO LTD Materials 341.00 2.93% 27.06.2012 8184 JT Equity SHIMACHU CO LTD Consumer Discretionary 1796.00 1.95% 26.02.2013 3116 JT Equity TOYOTA BOSHOKU CORP Consumer Discretionary 847.00 2.01% 28.03.2012 9684 JT Equity SQUARE ENIX HOLDINGS CO LTD Information Technology 1493.00 2.01% 26.09.2012 Q.M.S Advisors | tel: +41 (0)78 922 08 77 | e-mail: info@qmsadv.com |
- 4. 27.01.2012 Option Implied Volatility Skew Parameters by Terms: At The Money Implied Volatilities by Terms IVt = atx + btx2 + ct Next Ex- Skew Skew Skew Skew Skew Skew Skew Skew Skew Skew Skew Skew Skew Skew Dividend ATM2 ATM2 ATM2 ATM2 ATM2 ATM2 ATM2 Ticker Name GICS_SECTOR_NAME ATM2 Ref Dividend (a) - (a) - (a) - (a) - (a) - (a) - (a) - (b) - (b) - (b) - (b) - (b) - (b) - (b) - Yield Vol - 30D Vol - 60D Vol - 90D Vol - 6M Vol - 12M Vol - 18M Vol - 24M Date 30D 60D 90D 6M 12M 18M 24M 30D 60D 90D 6M 12M 18M 24M 3941 JT Equity RENGO CO LTD Materials 545.00 2.20% 26.09.2012 5301 JT Equity TOKAI CARBON CO LTD Materials 414.00 1.93% 27.06.2012 5727 JT Equity TOHO TITANIUM CO LTD Materials 1338.00 0.37% 28.03.2012 8016 JT Equity ONWARD HOLDINGS CO LTD Consumer Discretionary 604.00 3.97% 26.02.2013 6856 JT Equity HORIBA LTD Information Technology 2470.00 1.05% 27.06.2012 9065 JT Equity SANKYU INC Industrials 296.00 3.04% 27.03.2013 8415 JT Equity KIYO HOLDINGS INC Financials 119.00 2.52% 27.03.2013 7453 JT Equity RYOHIN KEIKAKU CO LTD Consumer Discretionary 3700.00 2.97% 29.08.2012 6996 JT Equity NICHICON CORP Information Technology 773.00 1.94% 26.09.2012 5541 JT Equity PACIFIC METALS CO LTD Materials 435.00 0.46% 28.03.2012 1721 JT Equity COMSYS HOLDINGS CORP Industrials 857.00 2.33% 26.09.2012 7988 JT Equity NIFCO INC Consumer Discretionary 2056.00 2.58% 26.09.2012 9832 JT Equity AUTOBACS SEVEN CO LTD Consumer Discretionary 3585.00 3.91% 26.09.2012 4527 JT Equity ROHTO PHARMACEUTICAL CO LTD Health Care 948.00 1.69% 26.09.2012 8714 JT Equity SENSHU IKEDA HOLDINGS INC Financials 117.00 2.56% 27.03.2013 2371 JT Equity KAKAKU.COM INC Information Technology 2447.00 0.90% 28.03.2012 5232 JT Equity SUMITOMO OSAKA CEMENT CO LTD Materials 240.00 1.67% 27.03.2013 8336 JT Equity MUSASHINO BANK LTD/THE Financials 2593.00 2.31% 26.09.2012 1808 JT Equity HASEKO CORP Consumer Discretionary 55.00 13.16 18.30 21.14 26.82 -0.400 -0.238 -0.095 0.163 0.040 0.025 0.021 0.012 6728 JT Equity ULVAC INC Information Technology 1036.00 1.25% 26.06.2013 8366 JT Equity SHIGA BANK LTD/THE Financials 519.00 1.16% 26.09.2012 2670 JT Equity ABC-MART INC Consumer Discretionary 2667.00 1.61% 29.08.2012 6140 JT Equity ASAHI DIAMOND INDUSTRIAL CO Industrials 989.00 3.64% 26.09.2012 8388 JT Equity AWA BANK LTD/THE Financials 523.00 1.24% 26.09.2012 4739 JT Equity ITOCHU TECHNO-SOLUTIONS CORP Information Technology 3615.00 2.49% 26.09.2012 25.61 25.24 25.36 25.02 -0.045 0.013 0.010 0.007 0.003 0.000 0.000 0.000 4768 JT Equity OTSUKA CORP Information Technology 5380.00 2.42% 26.12.2012 6005 JT Equity MIURA CO LTD Industrials 2188.00 1.83% 26.09.2012 4922 JT Equity KOSE CORP Consumer Staples 1905.00 2.10% 26.09.2012 7550 JT Equity ZENSHO HOLDINGS CO LTD Consumer Discretionary 1036.00 1.35% 26.09.2012 9601 JT Equity SHOCHIKU CO LTD Consumer Discretionary 776.00 0.39% 26.02.2013 4666 JT Equity PARK24 CO LTD Industrials 951.00 3.15% 29.10.2013 2531 JT Equity TAKARA HOLDINGS INC Consumer Staples 489.00 1.74% 27.03.2013 17.02 16.69 16.86 16.72 -0.012 -0.081 -0.044 0.013 0.024 0.014 0.008 0.000 7518 JT Equity NET ONE SYSTEMS CO LTD Information Technology 209600.00 1.34% 26.09.2012 9697 JT Equity CAPCOM CO LTD Information Technology 1635.00 2.45% 26.09.2012 5701 JT Equity NIPPON LIGHT METAL CO LTD Materials 108.00 1.85% 27.03.2013 7312 JT Equity TAKATA CORP Consumer Discretionary 1747.00 2.00% 28.03.2012 6849 JT Equity NIHON KOHDEN CORP Health Care 1823.00 2.30% 26.09.2012 4534 JT Equity MOCHIDA PHARMACEUTICAL CO Health Care 855.00 2.57% 26.09.2012 8242 JT Equity H2O RETAILING CORP Consumer Discretionary 594.00 2.10% 26.09.2012 2206 JT Equity EZAKI GLICO CO LTD Consumer Staples 892.00 1.68% 26.09.2012 4634 JT Equity TOYO INK SC HOLDINGS CO LTD Materials 311.00 3.70% 26.09.2012 1860 JT Equity TODA CORP Industrials 300.00 2.33% 27.03.2013 4044 JT Equity CENTRAL GLASS CO LTD Industrials 372.00 1.61% 26.09.2012 6135 JT Equity MAKINO MILLING MACHINE CO Industrials 538.00 1.67% 26.09.2012 6995 JT Equity TOKAI RIKA CO LTD Consumer Discretionary 1322.00 2.42% 26.09.2012 9003 JT Equity SOTETSU HOLDINGS INC Industrials 246.00 2.03% 26.09.2012 7251 JT Equity KEIHIN CORP Consumer Discretionary 1454.00 1.93% 26.09.2012 7242 JT Equity KYB CO LTD Consumer Discretionary 413.00 1.94% 26.09.2012 8219 JT Equity AOYAMA TRADING CO LTD Consumer Discretionary 1326.00 3.02% 26.09.2012 6465 JT Equity HOSHIZAKI ELECTRIC CO LTD Industrials 1775.00 1.69% 26.12.2012 8394 JT Equity HIGO BANK LTD/THE Financials 462.00 1.84% 26.09.2012 9747 JT Equity ASATSU-DK INC Consumer Discretionary 2126.00 1.13% 27.06.2012 Topix Index (Top 1000) 3088 JT Equity MATSUMOTOKIYOSHI HOLDINGS CO Consumer Staples 1580.00 1.90% 26.09.2012 3391 JT Equity TSURUHA HOLDINGS INC Consumer Staples 4085.00 1.68% 13.11.2012 4547 JT Equity KISSEI PHARMACEUTICAL CO LTD Health Care 1564.00 2.30% 26.09.2012 6508 JT Equity MEIDENSHA CORP Industrials 279.00 1.43% 28.03.2012 7278 JT Equity EXEDY CORP Consumer Discretionary 2251.00 2.00% 26.09.2012 4206 JT Equity AICA KOGYO CO LTD Industrials 1088.00 2.94% 26.09.2012 2264 JT Equity MORINAGA MILK INDUSTRY CO Consumer Staples 302.00 2.32% 27.03.2013 8130 JT Equity SANGETSU CO LTD Consumer Discretionary 2099.00 3.57% 26.09.2012 4186 JT Equity TOKYO OHKA KOGYO CO LTD Materials 1672.00 2.15% 26.09.2012 7649 JT Equity SUGI HOLDINGS CO LTD Consumer Staples 2136.00 0.61% 26.02.2013 2331 JT Equity SOHGO SECURITY SERVICES CO Industrials 859.00 2.33% 26.09.2012 8390 JT Equity KAGOSHIMA BANK LTD/THE Financials 530.00 1.51% 26.09.2012 8367 JT Equity NANTO BANK LTD/THE Financials 418.00 1.44% 26.09.2012 4401 JT Equity ADEKA CORP Materials 761.00 2.89% 26.09.2012 2270 JT Equity MEGMILK SNOW BRAND CO LTD Consumer Staples 1496.00 2.01% 27.03.2013 2607 JT Equity FUJI OIL CO LTD Consumer Staples 1057.00 2.27% 26.09.2012 7729 JT Equity TOKYO SEIMITSU CO LTD Information Technology 1549.00 1.16% 26.09.2012 8544 JT Equity KEIYO BANK LTD/THE Financials 379.00 2.64% 26.09.2012 8273 JT Equity IZUMI CO LTD Consumer Discretionary 1356.00 1.18% 29.08.2012 8439 JT Equity CENTURY TOKYO LEASING CORP Financials 1582.00 2.59% 26.09.2012 4541 JT Equity NICHI-IKO PHARMACEUTICAL CO Health Care 1807.00 0.59% 27.11.2013 1332 JT Equity NIPPON SUISAN KAISHA LTD Consumer Staples 273.00 3.66% 26.09.2012 8361 JT Equity OGAKI KYORITSU BANK LTD/THE Financials 256.00 2.73% 26.09.2012 8363 JT Equity HOKKOKU BANK LTD/THE Financials 301.00 1.99% 26.09.2012 8386 JT Equity HYAKUJUSHI BANK LTD/THE Financials 367.00 1.91% 26.09.2012 6997 JT Equity NIPPON CHEMI-CON CORP Information Technology 261.00 0.77% 28.03.2012 4403 JT Equity NOF CORP Materials 392.00 2.55% 26.09.2012 1951 JT Equity KYOWA EXEO CORP Industrials 758.00 2.64% 26.09.2012 8381 JT Equity SAN-IN GODO BANK LTD/THE Financials 583.00 1.72% 26.09.2012 6222 JT Equity SHIMA SEIKI MFG LTD Industrials 1406.00 2.49% 26.09.2012 8078 JT Equity HANWA CO LTD Industrials 364.00 3.30% 26.09.2012 1833 JT Equity OKUMURA CORP Industrials 331.00 2.72% 27.03.2013 8088 JT Equity IWATANI CORP Industrials 265.00 2.26% 27.03.2013 8574 JT Equity PROMISE CO LTD Financials 837.00 27.03.2013 41.11 37.92 33.45 27.20 -0.031 0.003 0.002 0.002 0.002 0.000 0.000 0.000 7984 JT Equity KOKUYO CO LTD Industrials 544.00 2.76% 27.06.2012 6767 JT Equity MITSUMI ELECTRIC CO LTD Information Technology 620.00 28.03.2012 8218 JT Equity KOMERI CO LTD Consumer Discretionary 2295.00 1.53% 26.09.2012 8086 JT Equity NIPRO CORP Health Care 678.00 3.72% 26.09.2012 9409 JT Equity TV ASAHI CORP Consumer Discretionary 131800.00 1.52% 26.09.2012 6754 JT Equity ANRITSU CORP Information Technology 828.00 1.21% 26.09.2012 3865 JT Equity HOKUETSU KISHU PAPER CO LTD Materials 526.00 2.28% 26.09.2012 6707 JT Equity SANKEN ELECTRIC CO LTD Information Technology 277.00 2.17% 28.03.2012 8060 JT Equity CANON MARKETING JAPAN INC Consumer Discretionary 939.00 2.13% 26.06.2013 8324 JT Equity DAISHI BANK LTD/THE Financials 255.00 2.75% 26.09.2012 9075 JT Equity FUKUYAMA TRANSPORTING CO LTD Industrials 441.00 2.15% 26.09.2012 5482 JT Equity AICHI STEEL CORP Materials 421.00 2.38% 26.09.2012 2685 JT Equity POINT INC Consumer Discretionary 3110.00 4.18% 29.08.2012 6412 JT Equity HEIWA CORP Consumer Discretionary 1362.00 3.67% 26.09.2012 5929 JT Equity SANWA HOLDINGS CORP Industrials 249.00 3.61% 26.09.2012 4095 JT Equity NIHON PARKERIZING CO LTD Materials 991.00 2.02% 26.09.2012 8356 JT Equity JUROKU BANK LTD/THE Financials 254.00 2.76% 26.09.2012 5943 JT Equity NORITZ CORP Industrials 1350.00 2.07% 27.06.2012 8140 JT Equity RYOSAN CO LTD Information Technology 1685.00 4.75% 26.09.2012 7296 JT Equity FCC CO LTD Consumer Discretionary 1642.00 1.95% 26.09.2012 7915 JT Equity NISSHA PRINTING CO LTD Industrials 975.00 2.31% 28.03.2012 8368 JT Equity HYAKUGO BANK LTD/THE Financials 326.00 2.30% 26.09.2012 7230 JT Equity NISSIN KOGYO CO LTD Consumer Discretionary 1189.00 2.02% 26.09.2012 1979 JT Equity TAIKISHA LTD Industrials 1710.00 1.75% 26.09.2012 3337 JT Equity CIRCLE K SUNKUS CO LTD Consumer Staples 1302.00 3.07% 29.08.2012 9303 JT Equity SUMITOMO WAREHOUSE CO LTD Industrials 377.00 2.65% 26.09.2012 1334 JT Equity MARUHA NICHIRO HOLDINGS INC Consumer Staples 144.00 2.08% 27.03.2013 5310 JT Equity TOYO TANSO CO LTD Industrials 3120.00 0.80% 29.05.2013 9861 JT Equity YOSHINOYA HOLDINGS CO LTD Consumer Discretionary 107100.00 1.87% 29.08.2012 7313 JT Equity TS TECH CO LTD Consumer Discretionary 1337.00 1.72% 26.09.2012 8425 JT Equity IBJ LEASING CO LTD Financials 1885.00 2.55% 26.09.2012 5949 JT Equity UNIPRES CORP Consumer Discretionary 2435.00 1.03% 26.09.2012 9706 JT Equity JAPAN AIRPORT TERMINAL CO Industrials 1072.00 0.65% 26.09.2012 5451 JT Equity YODOGAWA STEEL WORKS LTD Materials 352.00 2.84% 26.09.2012 7981 JT Equity TAKARA STANDARD CO LTD Industrials 609.00 1.64% 27.03.2013 1893 JT Equity PENTA-OCEAN CONSTRUCTION CO Industrials 269.00 0.74% 27.03.2013 9793 JT Equity DAISEKI CO LTD Industrials 1380.00 1.45% 29.08.2012 8595 JT Equity JAFCO CO LTD Financials 1434.00 1.74% 28.03.2012 8572 JT Equity ACOM CO LTD Financials 1370.00 27.03.2013 3608 JT Equity TSI HOLDINGS CO LTD Consumer Discretionary 381.00 4.59% Q.M.S Advisors | tel: +41 (0)78 922 08 77 | e-mail: info@qmsadv.com |