SlideShare una empresa de Scribd logo
1 de 51
Reconstructing
                                                                      Water Levels in
                                                                         the Lake
                                                                      Michigan Basin
                                                                      from Embayed
                                                                           Lakes

                                                                 Tim Fisher
                                         Michigan                University of Toledo, OH


Wisconsin


Image from: http://www.savannah-weather.com/poes/extra/michigan.jpg
2003 1974


             How do you
                make
            investments?
Embayed
                             Lakes Outline


                           Location

                           Michigan Lake Level History

                           Geomorphic Evidence

                           Sedimentologic Evidence

                           Working with cores &
                            geomorphic data to generate
                            a lake level curve

                           Eolian sand as a LL proxy

Images from Google Maps
Study Sites


Toledo
L                Strandlines of glacial Lake Chicago


  Nip
       iss
             ing
Calume
        t

                        Glenwood


      Michigan Lake Level History
Late glacial
      &
  Holocene
 lake levels
   in the
    Lake
  Michigan
    basin                   14
                                 C


Fisher (2002) modified
from Hansel et al. (1985)
Two Creeks Site

Logs in lake
sediment and
overlying till

Dated at 11,850
14
   C yr BP or
13,600 cal yr BP


      till

      Lac
      .
      till
>5 0 s ta tm p s /<0 . 1k m 2
    14
       C D u es
 8 12 0 ±10 0 B P
 8 3 2 0 ±7 0 B P
 8 3 2 0 ±7 0 B P
                                  Olson site
8 3 8 0 ±10 0 B P
    ~9300 cal yr BP


      Olsen site in Lake Michigan, 26 m depth   Chrzastowski et al. (1991)
Late glacial
      &
  Holocene
 lake levels
   in the
    Lake
  Michigan
    basin


Fisher (2002) modified
from Hansel et al. (1985)
NBS


Cause of Nipissing transgression is uplift of the North Bay sill (NBS)
Late glacial
      &
  Holocene
 lake levels
   in the
    Lake
  Michigan
    basin


Fisher (2002) modified
from Hansel et al. (1985)
Platte Embayment, Sleeping Bear Dunes, MI
strandplain
New beach ridge ~1986
Thompson with peels


Todd Thompson, IGS
Calendar years


                  1            2             3            4           5

                 Distance landwards from modern shoreline (km)
Elevation (m)


                                            Thompson & Baedke (GSA Bull 1997)
New ridge ~1985
                    2011          Lake Michigan
                                relative lake level
                                       curve
                  Composite   Baedke and Thompson, JGLR 2000
?


Amber Boudreau’s UT MS thesis
Baedke & Thompson, 2000
Coring Targets

                                Shallow
                Barrier-dune    Wetland
Lake Michigan    Complex


Lake Michigan   Barrier-dune   Small Lake
                 Complex


  Big lake records preserved in a little lake’s sediment:
DEM of Study area
Kelly Weyer


Amber Boudreau
(nee Lahners)


   In review
Field Methods


RV Perforator

                  Coring Tube


                Piston
Fisher et al. 2007
Fisher et al. 2007
Laminated mud


    marl   peat   peat


                                           Laminated marl


?

                                     Fisher et al. 2007 (J Paleolim)
Silver Lake
    lithostratigraphic
            logs


Fisher et al. 2007 (J. Paleolim)
Stony Lake Contact

Lake Michigan   Barrier-dune embayed lake
                                Small Lake
                 Complex
                              i


                                                  Gyttja
Model of contact
                            Silver Lake Contact


                              Gyttja


                                                  Marl
                              Peat
Fisher et al. 2012
J. Paleolim
Figure 6. Contour map of ICE-3G global postglacial r ebound–derived velocities in the Great Lakes area. Contour interval—3 cm/century.


                                                                                                                                         From Mainville & Craymer
                                                                                                                                         (2005) GSA Bull
Figure 7. Contour map of vertical velocities derived from water level gauges over the Great Lakes surrounded with ICE-3G–derived
velocities. Contour inter val—3 cm/century.
peat      gyttja


Hamlin
Pentwater
Silver
Stony
White
Active sand sheet


                         Cabins at great prices!


Hansen et al. (Aeol R)                   Exhumed forest
Niveo-aeolian activity, Silver Lake State Park, MI
Evidence of Active
Sand on the Dunes
140
                      100
                                                      144
                                                      152
                                                      156
                       75
                                                      160
                                                      160R
                      %
                                                      164
                       50                             168
                                                      172
                                                      176
                       25                             179
                                                      179R
                                                      209


Sand in Core SL01-5    0                              223
                                                      225
                            1   2   3         4   5
                                        phi           235
                                                      244
sand curve compared to
Baedke & Thompson (2000) curve
                          Fisher & Loope, 2005
Toleston
Hanes, 2010
Hanes, 2010
Summary

Lake levels at embayed lakes can be reconstructed by:
-Strandline geomorphology
-Drowned Subaerial deposits
-Lacustrine deposits
References
 Fisher, T. G., and Loope, W. L. 2004. Lake-level variability in Silver Lake, Michigan: A
   response to fluctuations in lake levels of Lake Michigan. Michigan Academician
   35, 373-385.

 Fisher, T. G., and Loope, W. L. 2005. Aeolian sand preserved in Silver lake: A
   reliable signal of Holocene high stands of Lake Michigan. The Holocene 15,
   1072-1078.

 Fisher, T. G., Loope, W. L., Pierce, W. C., and Jol, H. M. 2007. Big lake records
   preserved in a little lake’s sediment: an example form Silver Lake, Michigan, USA.
   Journal of Paleolimnology 37, 365-382.

 Fisher, T. G., Weyer, K. A., Boudreau, A. M., Martin-Hayden, J. M., Krantz, D. E., and
   Breckenridge, A. 2012. Constraining Holocene lake levels and coastal dune
   activity in the Lake Michigan basin. Journal of Paleolimnology 47, 373-390.

 Hansen, E. C., Fisher, T. G., Arbogast, A. F., and Bateman, M. D. 2010. Geomorphic
   history of low-perched, transgressive dune complexes along the southeastern
   shore of Lake Michigan. Aeolian Research 1, 111-127.

 Timmons, E. A., Fisher, T. G., Hansen, E. C., Eiasman, E., Daly, T., and Kashgarian, M.
   2007. Elucidating eolian dune history from lacustrine sand records in the Lake
   Michigan coastal zone, USA. The Holocene 17, 789-801.
Reconstructing Water Levels in the Lake Michigan Basin from Embayed Lakes

Más contenido relacionado

La actualidad más candente

Cumulative Impact Summary 1997-2010 HPAs
Cumulative Impact Summary 1997-2010 HPAsCumulative Impact Summary 1997-2010 HPAs
Cumulative Impact Summary 1997-2010 HPAsBSH Admin
 
How the Drought Has Affected Business - Scott Hall, Lower Neches Valley Autho...
How the Drought Has Affected Business - Scott Hall, Lower Neches Valley Autho...How the Drought Has Affected Business - Scott Hall, Lower Neches Valley Autho...
How the Drought Has Affected Business - Scott Hall, Lower Neches Valley Autho...The Texas Network, LLC
 
High heat flow, skarn formation and mineralisation in the eastern Cobar Basin...
High heat flow, skarn formation and mineralisation in the eastern Cobar Basin...High heat flow, skarn formation and mineralisation in the eastern Cobar Basin...
High heat flow, skarn formation and mineralisation in the eastern Cobar Basin...NSW Environment and Planning
 
Carbon Sequestration: Potential of the Early Pennsylvanian Breathitt Group, P...
Carbon Sequestration: Potential of the Early Pennsylvanian Breathitt Group, P...Carbon Sequestration: Potential of the Early Pennsylvanian Breathitt Group, P...
Carbon Sequestration: Potential of the Early Pennsylvanian Breathitt Group, P...rpgrimm
 
Jennings tdec stream small
Jennings tdec stream smallJennings tdec stream small
Jennings tdec stream smallGreg Jennings
 
Boothroyd climate change-symposium-18nov2011-final
Boothroyd climate change-symposium-18nov2011-finalBoothroyd climate change-symposium-18nov2011-final
Boothroyd climate change-symposium-18nov2011-finalriseagrant
 
Rc201 day 3 jennings 10
Rc201 day 3 jennings 10Rc201 day 3 jennings 10
Rc201 day 3 jennings 10Greg Jennings
 
Groundwater management
Groundwater managementGroundwater management
Groundwater managementgeographypods
 
Rc401 construction jennings intro
Rc401 construction jennings introRc401 construction jennings intro
Rc401 construction jennings introGreg Jennings
 

La actualidad más candente (18)

Lemay Shores
Lemay ShoresLemay Shores
Lemay Shores
 
Cumulative Impact Summary 1997-2010 HPAs
Cumulative Impact Summary 1997-2010 HPAsCumulative Impact Summary 1997-2010 HPAs
Cumulative Impact Summary 1997-2010 HPAs
 
6 month review.pptx
6 month review.pptx6 month review.pptx
6 month review.pptx
 
Nature10705
Nature10705Nature10705
Nature10705
 
EAGE2002presentation2
EAGE2002presentation2EAGE2002presentation2
EAGE2002presentation2
 
How the Drought Has Affected Business - Scott Hall, Lower Neches Valley Autho...
How the Drought Has Affected Business - Scott Hall, Lower Neches Valley Autho...How the Drought Has Affected Business - Scott Hall, Lower Neches Valley Autho...
How the Drought Has Affected Business - Scott Hall, Lower Neches Valley Autho...
 
SWC2012Projects-Steelhead Haven
SWC2012Projects-Steelhead HavenSWC2012Projects-Steelhead Haven
SWC2012Projects-Steelhead Haven
 
High heat flow, skarn formation and mineralisation in the eastern Cobar Basin...
High heat flow, skarn formation and mineralisation in the eastern Cobar Basin...High heat flow, skarn formation and mineralisation in the eastern Cobar Basin...
High heat flow, skarn formation and mineralisation in the eastern Cobar Basin...
 
Carbon Sequestration: Potential of the Early Pennsylvanian Breathitt Group, P...
Carbon Sequestration: Potential of the Early Pennsylvanian Breathitt Group, P...Carbon Sequestration: Potential of the Early Pennsylvanian Breathitt Group, P...
Carbon Sequestration: Potential of the Early Pennsylvanian Breathitt Group, P...
 
Jennings tdec stream small
Jennings tdec stream smallJennings tdec stream small
Jennings tdec stream small
 
Boothroyd climate change-symposium-18nov2011-final
Boothroyd climate change-symposium-18nov2011-finalBoothroyd climate change-symposium-18nov2011-final
Boothroyd climate change-symposium-18nov2011-final
 
Uinta Basin baseline water quality study
Uinta Basin baseline water quality studyUinta Basin baseline water quality study
Uinta Basin baseline water quality study
 
Future gen feis_noa_64618
Future gen feis_noa_64618Future gen feis_noa_64618
Future gen feis_noa_64618
 
Rc201 day 3 jennings 10
Rc201 day 3 jennings 10Rc201 day 3 jennings 10
Rc201 day 3 jennings 10
 
Groundwater management
Groundwater managementGroundwater management
Groundwater management
 
Rc401 construction jennings intro
Rc401 construction jennings introRc401 construction jennings intro
Rc401 construction jennings intro
 
James beach
James beachJames beach
James beach
 
Hydrographic Pinnacle Dredging
Hydrographic Pinnacle DredgingHydrographic Pinnacle Dredging
Hydrographic Pinnacle Dredging
 

Destacado

Development of earthquake resistant building in indonesia
Development of earthquake resistant building in indonesiaDevelopment of earthquake resistant building in indonesia
Development of earthquake resistant building in indonesiaPutika Ashfar Khoiri
 
TH4.L09 - GEOLOGICAL AND GEOHAZARD APPLICATIONS OF RADARSAT-2
TH4.L09 - GEOLOGICAL AND GEOHAZARD APPLICATIONS OF RADARSAT-2TH4.L09 - GEOLOGICAL AND GEOHAZARD APPLICATIONS OF RADARSAT-2
TH4.L09 - GEOLOGICAL AND GEOHAZARD APPLICATIONS OF RADARSAT-2grssieee
 
Extreme natural disasters
Extreme natural disastersExtreme natural disasters
Extreme natural disastersRodawg
 
Kobe Earthquake Case Study V2 0910
Kobe Earthquake Case Study V2 0910Kobe Earthquake Case Study V2 0910
Kobe Earthquake Case Study V2 0910tudorgeog
 
Land,soil,water,natural vegetation and wildlife VIII
Land,soil,water,natural vegetation and wildlife VIIILand,soil,water,natural vegetation and wildlife VIII
Land,soil,water,natural vegetation and wildlife VIIISantosh Kumar
 
Natural Hazards, Classification and Analysis
Natural Hazards, Classification and AnalysisNatural Hazards, Classification and Analysis
Natural Hazards, Classification and AnalysisPaul Wozney
 
Geohazard mapping and assessment program
Geohazard mapping and assessment programGeohazard mapping and assessment program
Geohazard mapping and assessment programMarho Realty
 

Destacado (9)

Development of earthquake resistant building in indonesia
Development of earthquake resistant building in indonesiaDevelopment of earthquake resistant building in indonesia
Development of earthquake resistant building in indonesia
 
TH4.L09 - GEOLOGICAL AND GEOHAZARD APPLICATIONS OF RADARSAT-2
TH4.L09 - GEOLOGICAL AND GEOHAZARD APPLICATIONS OF RADARSAT-2TH4.L09 - GEOLOGICAL AND GEOHAZARD APPLICATIONS OF RADARSAT-2
TH4.L09 - GEOLOGICAL AND GEOHAZARD APPLICATIONS OF RADARSAT-2
 
Extreme natural disasters
Extreme natural disastersExtreme natural disasters
Extreme natural disasters
 
Kobe Earthquake Case Study V2 0910
Kobe Earthquake Case Study V2 0910Kobe Earthquake Case Study V2 0910
Kobe Earthquake Case Study V2 0910
 
Land,soil,water,natural vegetation and wildlife VIII
Land,soil,water,natural vegetation and wildlife VIIILand,soil,water,natural vegetation and wildlife VIII
Land,soil,water,natural vegetation and wildlife VIII
 
Natural Hazards, Classification and Analysis
Natural Hazards, Classification and AnalysisNatural Hazards, Classification and Analysis
Natural Hazards, Classification and Analysis
 
Notable japanese volcanic eruptions
Notable japanese volcanic eruptionsNotable japanese volcanic eruptions
Notable japanese volcanic eruptions
 
Geohazard mapping and assessment program
Geohazard mapping and assessment programGeohazard mapping and assessment program
Geohazard mapping and assessment program
 
Geohazards
GeohazardsGeohazards
Geohazards
 

Similar a Reconstructing Water Levels in the Lake Michigan Basin from Embayed Lakes

Mountain Rivers Hydraul Geom.ppt
Mountain Rivers Hydraul Geom.pptMountain Rivers Hydraul Geom.ppt
Mountain Rivers Hydraul Geom.pptProfPGAgnihotri
 
UnconVentional Wisdom and the Effects of Dams on Downstream Coarse Sediment S...
UnconVentional Wisdom and the Effects of Dams on Downstream Coarse Sediment S...UnconVentional Wisdom and the Effects of Dams on Downstream Coarse Sediment S...
UnconVentional Wisdom and the Effects of Dams on Downstream Coarse Sediment S...byronamerson
 
DUGG 2012 Bing Final low res
DUGG 2012 Bing Final low resDUGG 2012 Bing Final low res
DUGG 2012 Bing Final low resChristiane Alepuz
 
CLIMATE CHANGE, SEA-LEVEL RISE and COASTAL GEOLOGIC HAZARDS
CLIMATE CHANGE, SEA-LEVEL RISE and COASTAL GEOLOGIC HAZARDSCLIMATE CHANGE, SEA-LEVEL RISE and COASTAL GEOLOGIC HAZARDS
CLIMATE CHANGE, SEA-LEVEL RISE and COASTAL GEOLOGIC HAZARDSriseagrant
 
Improving Ocean Literacy by Teaching the Geology of the Great Lakes
Improving Ocean Literacy by Teaching the Geology of the Great LakesImproving Ocean Literacy by Teaching the Geology of the Great Lakes
Improving Ocean Literacy by Teaching the Geology of the Great LakesDerek Moy
 
Hadlari etal. 2006 baker lake rift basin sedimentology
Hadlari etal. 2006 baker lake rift basin sedimentologyHadlari etal. 2006 baker lake rift basin sedimentology
Hadlari etal. 2006 baker lake rift basin sedimentologyrad8
 
Sb lakes intro pt1
Sb lakes intro pt1Sb lakes intro pt1
Sb lakes intro pt1UmassGeo
 
A brief geological history of the ravines
A brief geological history of the ravinesA brief geological history of the ravines
A brief geological history of the ravinescolgan
 
Coyote Creek Historical Ecological Study
Coyote Creek Historical Ecological StudyCoyote Creek Historical Ecological Study
Coyote Creek Historical Ecological StudySon Lam
 
Submarine Ground Water Discharge
Submarine Ground Water Discharge Submarine Ground Water Discharge
Submarine Ground Water Discharge Tongji UNIVERSITY
 
Processes and Landforms of the Willamette River and Floodplain
Processes and Landforms of the Willamette River and FloodplainProcesses and Landforms of the Willamette River and Floodplain
Processes and Landforms of the Willamette River and FloodplainWillamette River Initiative
 
thesis summary bowen basin symposium poster meggie doran
thesis summary bowen basin symposium poster meggie doranthesis summary bowen basin symposium poster meggie doran
thesis summary bowen basin symposium poster meggie doranMeggie Doran
 
Site B site analysis
Site B site analysisSite B site analysis
Site B site analysis16swafaa
 
Wl Network Wdnr Lakes Team Feb4 2010
Wl Network Wdnr Lakes Team Feb4 2010Wl Network Wdnr Lakes Team Feb4 2010
Wl Network Wdnr Lakes Team Feb4 2010UWEX Lakes
 

Similar a Reconstructing Water Levels in the Lake Michigan Basin from Embayed Lakes (20)

Mountain Rivers Hydraul Geom.ppt
Mountain Rivers Hydraul Geom.pptMountain Rivers Hydraul Geom.ppt
Mountain Rivers Hydraul Geom.ppt
 
Geofluids Poster
Geofluids PosterGeofluids Poster
Geofluids Poster
 
UnconVentional Wisdom and the Effects of Dams on Downstream Coarse Sediment S...
UnconVentional Wisdom and the Effects of Dams on Downstream Coarse Sediment S...UnconVentional Wisdom and the Effects of Dams on Downstream Coarse Sediment S...
UnconVentional Wisdom and the Effects of Dams on Downstream Coarse Sediment S...
 
DUGG 2012 Bing Final low res
DUGG 2012 Bing Final low resDUGG 2012 Bing Final low res
DUGG 2012 Bing Final low res
 
CLIMATE CHANGE, SEA-LEVEL RISE and COASTAL GEOLOGIC HAZARDS
CLIMATE CHANGE, SEA-LEVEL RISE and COASTAL GEOLOGIC HAZARDSCLIMATE CHANGE, SEA-LEVEL RISE and COASTAL GEOLOGIC HAZARDS
CLIMATE CHANGE, SEA-LEVEL RISE and COASTAL GEOLOGIC HAZARDS
 
Improving Ocean Literacy by Teaching the Geology of the Great Lakes
Improving Ocean Literacy by Teaching the Geology of the Great LakesImproving Ocean Literacy by Teaching the Geology of the Great Lakes
Improving Ocean Literacy by Teaching the Geology of the Great Lakes
 
Hadlari etal. 2006 baker lake rift basin sedimentology
Hadlari etal. 2006 baker lake rift basin sedimentologyHadlari etal. 2006 baker lake rift basin sedimentology
Hadlari etal. 2006 baker lake rift basin sedimentology
 
Sb lakes intro pt1
Sb lakes intro pt1Sb lakes intro pt1
Sb lakes intro pt1
 
Great Lakes Climate Global Warming Presentation
Great Lakes Climate Global Warming PresentationGreat Lakes Climate Global Warming Presentation
Great Lakes Climate Global Warming Presentation
 
GLM-Long
GLM-LongGLM-Long
GLM-Long
 
Anthony_GIS
Anthony_GISAnthony_GIS
Anthony_GIS
 
A brief geological history of the ravines
A brief geological history of the ravinesA brief geological history of the ravines
A brief geological history of the ravines
 
Butler
ButlerButler
Butler
 
Coyote Creek Historical Ecological Study
Coyote Creek Historical Ecological StudyCoyote Creek Historical Ecological Study
Coyote Creek Historical Ecological Study
 
Submarine Ground Water Discharge
Submarine Ground Water Discharge Submarine Ground Water Discharge
Submarine Ground Water Discharge
 
Processes and Landforms of the Willamette River and Floodplain
Processes and Landforms of the Willamette River and FloodplainProcesses and Landforms of the Willamette River and Floodplain
Processes and Landforms of the Willamette River and Floodplain
 
thesis summary bowen basin symposium poster meggie doran
thesis summary bowen basin symposium poster meggie doranthesis summary bowen basin symposium poster meggie doran
thesis summary bowen basin symposium poster meggie doran
 
Site B site analysis
Site B site analysisSite B site analysis
Site B site analysis
 
Glaciation
GlaciationGlaciation
Glaciation
 
Wl Network Wdnr Lakes Team Feb4 2010
Wl Network Wdnr Lakes Team Feb4 2010Wl Network Wdnr Lakes Team Feb4 2010
Wl Network Wdnr Lakes Team Feb4 2010
 

Más de SERC at Carleton College

StatVignette03_Sig.Figs_v04_07_15_2020.pptx
StatVignette03_Sig.Figs_v04_07_15_2020.pptxStatVignette03_Sig.Figs_v04_07_15_2020.pptx
StatVignette03_Sig.Figs_v04_07_15_2020.pptxSERC at Carleton College
 
Cretaceous Coatlines and Modern Voting Patterns Presentation
Cretaceous Coatlines and Modern Voting Patterns PresentationCretaceous Coatlines and Modern Voting Patterns Presentation
Cretaceous Coatlines and Modern Voting Patterns PresentationSERC at Carleton College
 
Presentation: Unit 1 Introduction to the hydrological cycle
Presentation: Unit 1 Introduction to the hydrological cyclePresentation: Unit 1 Introduction to the hydrological cycle
Presentation: Unit 1 Introduction to the hydrological cycleSERC at Carleton College
 
KSKL_Chapter 4_ Chem Properties of Soils.pptx
KSKL_Chapter 4_ Chem Properties of Soils.pptxKSKL_Chapter 4_ Chem Properties of Soils.pptx
KSKL_Chapter 4_ Chem Properties of Soils.pptxSERC at Carleton College
 
Presentation: Unit 3 background information
Presentation: Unit 3 background informationPresentation: Unit 3 background information
Presentation: Unit 3 background informationSERC at Carleton College
 
Presentation: Unit 2 Measuring Groundwater Background Information
Presentation: Unit 2 Measuring Groundwater Background InformationPresentation: Unit 2 Measuring Groundwater Background Information
Presentation: Unit 2 Measuring Groundwater Background InformationSERC at Carleton College
 

Más de SERC at Carleton College (20)

StatVignette03_Sig.Figs_v04_07_15_2020.pptx
StatVignette03_Sig.Figs_v04_07_15_2020.pptxStatVignette03_Sig.Figs_v04_07_15_2020.pptx
StatVignette03_Sig.Figs_v04_07_15_2020.pptx
 
StatVignette06_HypTesting.pptx
StatVignette06_HypTesting.pptxStatVignette06_HypTesting.pptx
StatVignette06_HypTesting.pptx
 
Unit 1 (optional slides)
Unit 1 (optional slides)Unit 1 (optional slides)
Unit 1 (optional slides)
 
Cretaceous Coatlines and Modern Voting Patterns Presentation
Cretaceous Coatlines and Modern Voting Patterns PresentationCretaceous Coatlines and Modern Voting Patterns Presentation
Cretaceous Coatlines and Modern Voting Patterns Presentation
 
Climate and Biomes PPT 2
Climate and Biomes PPT 2Climate and Biomes PPT 2
Climate and Biomes PPT 2
 
weather tracking ppt
weather tracking pptweather tracking ppt
weather tracking ppt
 
Presentation: Unit 1 Introduction to the hydrological cycle
Presentation: Unit 1 Introduction to the hydrological cyclePresentation: Unit 1 Introduction to the hydrological cycle
Presentation: Unit 1 Introduction to the hydrological cycle
 
StatVignette05_M3_v02_10_21_2020.pptx
StatVignette05_M3_v02_10_21_2020.pptxStatVignette05_M3_v02_10_21_2020.pptx
StatVignette05_M3_v02_10_21_2020.pptx
 
KSKL chapter 8 PPT
KSKL chapter 8 PPTKSKL chapter 8 PPT
KSKL chapter 8 PPT
 
KSKL chap 5 PPT
KSKL chap 5 PPTKSKL chap 5 PPT
KSKL chap 5 PPT
 
KSKL_Chapter 4_ Chem Properties of Soils.pptx
KSKL_Chapter 4_ Chem Properties of Soils.pptxKSKL_Chapter 4_ Chem Properties of Soils.pptx
KSKL_Chapter 4_ Chem Properties of Soils.pptx
 
Degraded Soil Images.pptx
Degraded Soil Images.pptxDegraded Soil Images.pptx
Degraded Soil Images.pptx
 
Educators PPT file chapter 7
Educators PPT file chapter 7Educators PPT file chapter 7
Educators PPT file chapter 7
 
Educators PPT file chapter 2
Educators PPT file chapter 2Educators PPT file chapter 2
Educators PPT file chapter 2
 
Educators PPT file chapter 6
Educators PPT file chapter 6Educators PPT file chapter 6
Educators PPT file chapter 6
 
Educators PPT chapter 3
Educators PPT chapter 3Educators PPT chapter 3
Educators PPT chapter 3
 
Unit 4 background presentation
Unit 4 background presentationUnit 4 background presentation
Unit 4 background presentation
 
Presentation: Unit 3 background information
Presentation: Unit 3 background informationPresentation: Unit 3 background information
Presentation: Unit 3 background information
 
Presentation: Unit 2 Measuring Groundwater Background Information
Presentation: Unit 2 Measuring Groundwater Background InformationPresentation: Unit 2 Measuring Groundwater Background Information
Presentation: Unit 2 Measuring Groundwater Background Information
 
Introduction to GPS presentation
Introduction to GPS presentationIntroduction to GPS presentation
Introduction to GPS presentation
 

Reconstructing Water Levels in the Lake Michigan Basin from Embayed Lakes

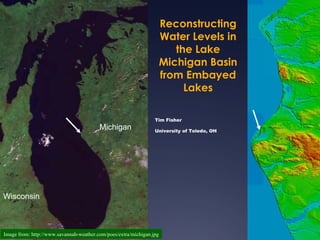
  • 1. Reconstructing Water Levels in the Lake Michigan Basin from Embayed Lakes Tim Fisher Michigan University of Toledo, OH Wisconsin Image from: http://www.savannah-weather.com/poes/extra/michigan.jpg
  • 2. 2003 1974 How do you make investments?
  • 3. Embayed Lakes Outline  Location  Michigan Lake Level History  Geomorphic Evidence  Sedimentologic Evidence  Working with cores & geomorphic data to generate a lake level curve  Eolian sand as a LL proxy Images from Google Maps
  • 5. L Strandlines of glacial Lake Chicago Nip iss ing Calume t Glenwood Michigan Lake Level History
  • 6. Late glacial & Holocene lake levels in the Lake Michigan basin 14 C Fisher (2002) modified from Hansel et al. (1985)
  • 7. Two Creeks Site Logs in lake sediment and overlying till Dated at 11,850 14 C yr BP or 13,600 cal yr BP till Lac . till
  • 8. >5 0 s ta tm p s /<0 . 1k m 2 14 C D u es 8 12 0 ±10 0 B P 8 3 2 0 ±7 0 B P 8 3 2 0 ±7 0 B P Olson site 8 3 8 0 ±10 0 B P ~9300 cal yr BP Olsen site in Lake Michigan, 26 m depth Chrzastowski et al. (1991)
  • 9. Late glacial & Holocene lake levels in the Lake Michigan basin Fisher (2002) modified from Hansel et al. (1985)
  • 10. NBS Cause of Nipissing transgression is uplift of the North Bay sill (NBS)
  • 11. Late glacial & Holocene lake levels in the Lake Michigan basin Fisher (2002) modified from Hansel et al. (1985)
  • 12. Platte Embayment, Sleeping Bear Dunes, MI
  • 15. Thompson with peels Todd Thompson, IGS
  • 16. Calendar years 1 2 3 4 5 Distance landwards from modern shoreline (km) Elevation (m) Thompson & Baedke (GSA Bull 1997)
  • 17. New ridge ~1985 2011 Lake Michigan relative lake level curve Composite Baedke and Thompson, JGLR 2000
  • 19.
  • 20.
  • 22. Coring Targets Shallow Barrier-dune Wetland Lake Michigan Complex Lake Michigan Barrier-dune Small Lake Complex Big lake records preserved in a little lake’s sediment:
  • 23. DEM of Study area
  • 24. Kelly Weyer Amber Boudreau (nee Lahners) In review
  • 25. Field Methods RV Perforator Coring Tube Piston
  • 26.
  • 29. Laminated mud marl peat peat Laminated marl ? Fisher et al. 2007 (J Paleolim)
  • 30. Silver Lake lithostratigraphic logs Fisher et al. 2007 (J. Paleolim)
  • 31. Stony Lake Contact Lake Michigan Barrier-dune embayed lake Small Lake Complex i Gyttja Model of contact Silver Lake Contact Gyttja Marl Peat
  • 32. Fisher et al. 2012 J. Paleolim
  • 33.
  • 34. Figure 6. Contour map of ICE-3G global postglacial r ebound–derived velocities in the Great Lakes area. Contour interval—3 cm/century. From Mainville & Craymer (2005) GSA Bull Figure 7. Contour map of vertical velocities derived from water level gauges over the Great Lakes surrounded with ICE-3G–derived velocities. Contour inter val—3 cm/century.
  • 35. peat gyttja Hamlin Pentwater Silver Stony White
  • 36. Active sand sheet Cabins at great prices! Hansen et al. (Aeol R) Exhumed forest
  • 37. Niveo-aeolian activity, Silver Lake State Park, MI
  • 38. Evidence of Active Sand on the Dunes
  • 39.
  • 40. 140 100 144 152 156 75 160 160R % 164 50 168 172 176 25 179 179R 209 Sand in Core SL01-5 0 223 225 1 2 3 4 5 phi 235 244
  • 41. sand curve compared to Baedke & Thompson (2000) curve Fisher & Loope, 2005
  • 43.
  • 46. Summary Lake levels at embayed lakes can be reconstructed by: -Strandline geomorphology -Drowned Subaerial deposits -Lacustrine deposits
  • 47. References  Fisher, T. G., and Loope, W. L. 2004. Lake-level variability in Silver Lake, Michigan: A response to fluctuations in lake levels of Lake Michigan. Michigan Academician 35, 373-385.  Fisher, T. G., and Loope, W. L. 2005. Aeolian sand preserved in Silver lake: A reliable signal of Holocene high stands of Lake Michigan. The Holocene 15, 1072-1078.  Fisher, T. G., Loope, W. L., Pierce, W. C., and Jol, H. M. 2007. Big lake records preserved in a little lake’s sediment: an example form Silver Lake, Michigan, USA. Journal of Paleolimnology 37, 365-382.  Fisher, T. G., Weyer, K. A., Boudreau, A. M., Martin-Hayden, J. M., Krantz, D. E., and Breckenridge, A. 2012. Constraining Holocene lake levels and coastal dune activity in the Lake Michigan basin. Journal of Paleolimnology 47, 373-390.  Hansen, E. C., Fisher, T. G., Arbogast, A. F., and Bateman, M. D. 2010. Geomorphic history of low-perched, transgressive dune complexes along the southeastern shore of Lake Michigan. Aeolian Research 1, 111-127.  Timmons, E. A., Fisher, T. G., Hansen, E. C., Eiasman, E., Daly, T., and Kashgarian, M. 2007. Elucidating eolian dune history from lacustrine sand records in the Lake Michigan coastal zone, USA. The Holocene 17, 789-801.

Notas del editor

  1. More documentation of the active sand and snow. The upper right photo shows snow on top of fresh sand, which is on top of a frozen crest of sand. The lower left shows a similar sequence, but we didn’t dig down to the frozen crest and note there are more snow layers in the top layer.
  2. The following are pictures documenting the deposition of sand on the lake ice of Lake Michigan showing that the sand is indeed blowing on the lake. Here you can see the dunes in the background with the sand along with some snow deposited here on the ice
  3. Radiocarbon dates were obtained from 3 locations throughout the unit to aid in comparison to the Baedke and Thompson curve. When these results were compared to the Baedke and Thompson curve, there appeared to be a positive correlation between high lake levels and high sand percents.