1. SUPPLEMENTAL FIGURES
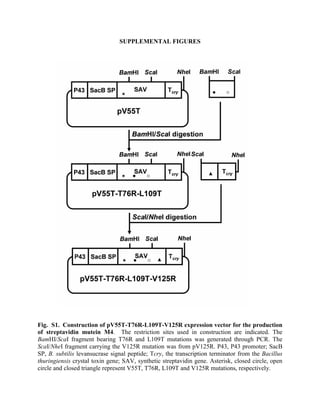
Fig. S1. Construction of pV55T-T76R-L109T-V125R expression vector for the production
of streptavidin mutein M4. The restriction sites used in construction are indicated. The
BamHI/ScaI fragment bearing T76R and L109T mutations was generated through PCR. The
ScaI/NheI fragment carrying the V125R mutation was from pV125R. P43, P43 promoter; SacB
SP, B. subtilis levansucrase signal peptide; Tcry, the transcription terminator from the Bacillus
thuringiensis crystal toxin gene; SAV, synthetic streptavidin gene. Asterisk, closed circle, open
circle and closed triangle represent V55T, T76R, L109T and V125R mutations, respectively.
2. Fig. S2. Gel filtration analyses of streptavidin muteins. A. Determination of apparent
molecular mass of streptavidin muteins in the absence of biotin using Bio-Prep SE 100/17 gel
filtration column. Bovine gamma-globulin (158 kDa), bovine serum albumin (66 kDa),
ovalbumin (44 kDa), myoglobin (17 kDa) and vitamin B-12 (1.35 kDa) were used as molecular
mass markers (closed circles) to calibrate the column. The logarithm of molecular mass was
plotted versus Kav (Kav = (Ve-Vo)/(Vt-Vo); Ve, elution volume; Vo, void volume; Vt, bed volume).
Positions of wild-type streptavidin (wt) and streptavidin muteins are represented by solid squares.
B. Elution profile of M4 mutein (loaded at 2 mg/ml) on the gel filtration column.
Fig. S3. Kinetic parameters for the interaction between M4 streptavidin mutein and biotin
as monitored by BIAcore biosensor. A. On-rate (ka) determination. ka is derived from
association analysis using a plot of ks versus protein concentration (35) B. Off-rate (kd)
determination. kd is the slope of the plot of ln(Ro/Rt) versus (t-to) where Ro is the response at an
arbitrary starting time to; Rt is the response at time t.