Investment in The Coconut Industry by Nancy Cheruiyot
Combating corruption in india some suggestions
1. PURPOSE OF RESEARCH: Strategies for combating
corruption in an established and developing democracy
The objective of this paper is to highlight the extent of
corruption in India by identifying the main causes for
corruption in major sectors such as the bureaucracy, judiciary
and polity and suggest remedial measures. Unlike other middle-
income newly independent nations that are yet to build up their
political, judicial and executive governance infrastructure, India
has a well—established governance system with all the requisite
institutions in place for over half a century now. This research
therefore, takes into account the natural and human resources,
industrial and technological skills available within India and
contrasts it with the underlying corruption as a way of life
retarding progress and development and depriving citizens of
their legitimate right to ensure a better quality of life for
themselves. The weak rule of law and a drastic overhaul of the
legal system and other accountability systems therefore feature
prominently in this paper. Deregulation and outsourcing too
occupy a significant position being major elements in devolving
power to citizens and assuring indirect popular participation in
governance. While there may be more than an alternate opinion
on many of the suggestions made as being Draconian, the fact
would, nonetheless, remain that perhaps only such Draconian
changes and enforcement alone can lift India from the morass it
has sunk into in the last six decades since independence.
Unless corruption as a national way of life is jettisoned to the
extent of at least 70-80 per cent of its present level, annual GDP
growth rate of over 8 per cent would remain only an impressive
statistic and not translate to a better quality of life for India‘s
citizens who belong to the world‘s two largest ‗tiger‘ economies.
It is this issue that my research would seek to investigate. In
doing so such research would also touch upon several other
SHANTANU BASU
2. SHANTANU BASU 2
facets that would be of interest not only to other relatively
smaller and less complex developing countries but also many
international organisations and multinational corporations and
other bodies corporate who are investing substantial capital and
resources in these countries. Such research may also be of help
not only to academic researchers but also foreign educational
institutions and other corporate bodies as they cross the seven
seas to establish their satellite campuses or seek to invest in
educational systems, health services, transportation and a host
of other infrastructure areas.
Therefore the purpose of this research is to briefly analyse
corruption in seven key sectors in public administration in
India:
Bureaucracy
Elections and political party funding
Judicial administration
Police administration
Municipal administration
Health administration
Education administration
So far anti-corruption measures have mainly confined
themselves to addressing administrative corruption by
reforming public administration and public financial
management. However, with increasing recognition that the
roots of corruption extend much beyond lacunae in government,
suggestions for redressal are focusing on broader structural
relationships such as those relating to the organisation of the
political system, states and firms and states and civil society. No
single strategy would succeed, instead a healthy mix of coercion
and incentives in varying measures may provide answers to the
3. SHANTANU BASU 3
complexities of the Indian situation. Such strategies would also
have to take into account the presence of powerful vested
interest, political compulsions, considerations of caste,
community, geographical and linguistic chauvinism, etc. The
following diagram would show the symbiotic interplay of various
forces that would recall the need for a multi-pronged strategy to
combat corruption:
Competitive Private Sector Political Accountability
Economic policy reform Political competition, credible political
Competitive restructuring of monopolies parties
Regulatory simplification for entry Transparency in party financing
Transparency in corporate governance Disclosure of parliamentary votes
Collective business associations Asset declaration, conflict of interest rules
ANTI-CORRUPTION
Institutional Restraints Civil Society Participation
Independent and effective judiciary Freedom of Information
Legislative oversight Public hearings of draft laws
Independent prosecution, enforcement Role for media/NGOs
Public Management
Meritocratic civil service with monetized,
adequate pay
Budget management (coverage, treasury,
procurement, audit)
Tax and customs
Sectoral service delivery (health, education,
energy)
Decentralisation with accountability
Source: The World Bank, 2000: Anticorruption in Transition – A Contribution to the
Policy debate
Although corrective models may vary by practice and
experience, yet the goals remain identical, viz. enhancing state
capacity and public sector management, strengthening political
accountability, enabling civil society and increasing economic
competition. Though a formidable task, a healthy interplay
between the executive, polity and judiciary and a country‘s
4. SHANTANU BASU 4
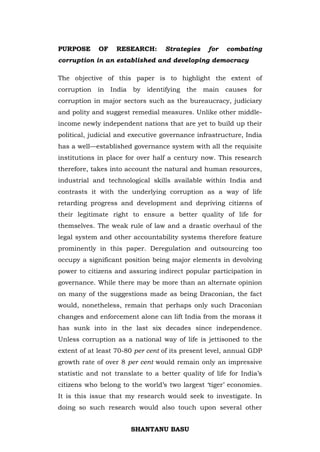
citizens can bring such reform to life. The following chart would
illustrate the symbiotic interplay of these forces in assuring
accountability:
Civil Society - Media
Judiciary
Legislature
Subnational governments and
autonomous oversight
agencies
Executive
Source: Global Monitoring Report, 2006: pp. 159, The World Bank, Washington DC
5. SHANTANU BASU 5
Strategies to Combat Corruption
in Public Management in India
1.1 India: The Geographical Background
India, the second largest country in the world population wise
and seventh territory wise, lies north of the Equator, between
8'4''to 37'6" North latitude and 68'7"to 97'25" East longitude.
The country's landmass is flanked by the Bay of Bengal and the
Arabian Sea, along the southeast and along the southwest
respectively. On the western border is situated Pakistan and in
the east, Bangladesh and Myanmar. Along her northern
boundary are Bhutan, Nepal, and Tibet and Sinkiang region of
China. The Gulf of Mannar and the Palk Strait separate India
from Sri Lanka. From North to South, India measures about
3214 km and from east to west, about 2933 km. The total land
area is 3,268,090 sq. km. Its land frontier is 15,200km and
coastline, 6,103km. The Andaman and Nicobar Islands in the
Bay of Bengal and Lakshadweep in the Arabian Sea are parts of
Indian territory.
1.2 India’s natural resources
India has a large number of economically useful minerals and
they constitute one-quarter of the world's known mineral
resources. India also has the world's largest deposits of coal.
Next to Russia, India has the largest supply of manganese. India
also produces three quarters of the world's mica. The country
has substantial resources in chromite, bauxite, gypsum, nickel,
copper, ileminite, silimanite, gold, uranium and rare earths.
Petroleum deposits are found mainly in Assam and Gujarat and
off the Western coast. India ranks 3rd in production of coal,
lignite and barytes, fourth in iron ore, sixth in bauxite and
6. SHANTANU BASU 6
manganese ore, tenth in aluminum and eleventh in crude steel
in the World.
1.3 India’s demographic profile
The population of India has grown from around 300 million in
1947 to 1.02 billion as per the Census 20011 marking a 23 per
cent rise over the previous decennial census of 1991. Of this
532 million is the male population while the female population
is 496 million. India accounted for 17 per cent of the world‘s
population with just 2.40 per cent of the world‘s landmass. This
population is forecast to rise to 1.26 billion by 2016 by the
Registrar General of India- a five-fold rise over 1871 (211.7
million). Given the relatively young demographic profile of the
present population 500 million would be added to the
7. SHANTANU BASU 7
population in the next few decades taking the total population
by World Bank estimates to 1.57 billion by 2051.Translated into
population density terms the 2001 census has added 57
persons per sq. km. to the existing 267 persons per sq. km. per
the census report of 1991. This is in stark contrast to a density
of 77 per sq. km in 1901. The following population density
graph would amplify the growth race of India‘s population:
350
300
250
200
150
100
50
0
01
11
21
31
41
51
61
71
81
91
01
19
19
19
19
19
19
19
19
19
19
20
Source: Adapted from Registrar General of India Census 2001
The crude literacy rate for males is 64 while that for females is
only 46 per cent. Despite this phenomenal growth of population
the net per capita national product has risen by a factor of eight
in the last fifty years while life expectancy has risen to 61.6
years for males and 63.3 for females. Satellites in space, nuclear
reactors in operation, a world I-T leader; yet India remains at
127th position in the UNDP‘s Human Development Index 2 for
2005 having dropped a further nine notches from 2004. India
ranks 58th in terms of human poverty with 31 per cent of its
population living below the poverty line with 72 per cent of its
8. SHANTANU BASU 8
population in the villages, 33 per cent under the age of 15 years
and 21 per cent being malnourished. About 260 million people
live on less than a dollar a day. India‘s Constitution recognizes
22 official languages, in addition to English, although the
country has about 800 languages and 2,000 dialects. However,
India does not have any state religion and all religions have
equal rights of preaching and practicing.
1.4 India’s economic indicators
Despite the single largest handicap of a burgeoning population,
India sustained a growth rate of 7.5 per cent in 2004-05 which
is projected to rise to 8.1 per cent in 2005-063. Inflation has
mainly stabilized around the 4 per cent per annum mark and
the total GDP (PPP basis) in 2005 is estimated to be US$3.699
trillion with per capita GDP being US$3400. Agriculture has
remained largely stagnant and contributed 20.6 per cent to GDP
while services provided 51.4 per cent and industry 28.1 per cent.
The balance of trade remained unfavourable and foreign debt
totaled 22 per cent of GNP. Regrettably, the per capita income
remained at an abominable US$285 in 2004-05.
1.5 India’s infrastructure
Despite several centuries of neglect and colonial administration,
India today boasts of 50,000 km of national highways and
3,000,000 km of secondary and other roads, 11 major and 163
minor ports along its 6,000 km long coastline. India's 21.59
million-line land telephone and 41 million cellular networks are
one of the largest in the world and the 3rd largest among
emerging economies (after China and Republic of Korea). Given
the low telephone penetration rate - 2.2 per 100 people of
population, which is much below the global average, India offers
vast scope for growth. It is therefore not surprising that India
9. SHANTANU BASU 9
has one of the fastest growing telecommunication systems in
the world with system size (total connections) growing at an
average of more than 20 per cent over the last 4 years. This is
despite only 31 per cent of India‘s population living in urban
agglomerations. Indian Railways extend over 60,000 route km
and carry 25 million passengers annually. India‘s information
technology industry has become a global phenomenon.
1.6 Paradox of development and future growth
Vision 20204, a document published by the Planning
Commission of the Government of India envisages the creation
of 150-200 million jobs by 2020 distributed over commercial
agriculture, tourism, construction, housing, I-T and I-T enabled
services, transport and communication, education and health.
This, in turn, would require doubling of allocation of resources
for education to about 6-7 per cent of GDP per annum and a
four-fold rise in health. Expenditure on R&D would raise
manifold from its present level of 1/60th of South Korea‘s. Public
mass transportation and telecommunications too would witness
a manifold rise. For India to rise to the world‘s fourth largest
economy by 2020, the country would have to produce 10 per
cent annual GDP growth rate during 2007-11 and 13 per cent
during 2012-20, both within the realm of the possible. A
colossal sum of US $ 72 billion is estimated to be required for a
cent per cent literate India by 2010.
At the same time India produces 441,000 technical graduates,
nearly 2.3 million other graduates and more than 300,000 post-
graduates every year. Bharat Forge, a private Indian company is
the world‘s second largest maker of forgings for car-engine and
chassis components, behind Thyssen-Krupp of Germany5. The
production efficiencies of Indian private industry too are
improving rapidly. While in the early 1990s, Bajaj Auto, a
10. SHANTANU BASU 10
leading Indian manufacturer of two-wheelers, was producing a
million vehicles with 24,000 workers; in 2005 it produced 2.4
million vehicles with only 10,500 workers. While Indian garment
exports climbed to US$ 7.5 billion of total textile exports of US$
17 billion, nevertheless they remained a poor second to China
with figures of US$ 40 billion of a total of US$ 107 billion, after
accounting for trade safeguards. Peak electricity supply falls 11
per cent short and 56 per cent of households live without
connections. Although India‘s has a road network of 65,000 km,
of national highways only 9 per cent have four-lane traffic.
Although domestic air travel have increased by over 25 per cent
per annum and Bombay-Delhi air fares down to an all-time low
of US$40 (one-way), aircraft often have to circle overhead for
over 30 minutes for want of runways at airports. India‘s annual
expenditure on infrastructure has fallen to 3.5 per cent of GDP
at US$ 21 billion compared to China where the corresponding
figures were 10.5 per cent and US$ 150 billion. While
investment of US$ 55 billion is required for airports and
railways, power would require US$ 75 billion and
telecommunications US$ 25 billion. Poor and slow inland
transport causes 35-40 per cent of fresh farm produce to rot
before distribution while it takes a transport lorry 32 hours to
transit between Delhi and Bombay, a distance of about 1,400
kms.
Yet Indian industry has not given up. Reliance Industries
Limited, India‘s largest private conglomerate plans to establish
over the next four years a mega chain of 1,000 hypermarkets
and 2,000 supermarkets that would be an ―integrated farm-to-
fork supply chain‖. Similarly, Indian industry estimates that the
number of mobile telephone users would cross the half-billion
mark by the next decade. The market capitalization of major
Indian companies too has undergone a sea change with
11. SHANTANU BASU 11
traditional leaders falling behind and even some public sector
enterprises forging ahead as the following graph shows:
Market capitalisation of select Indian companies
45
40
US $ in billion
35
30
25
20
15
10
5
0
s
es
s
n
n
n
ro
r
C
rie
ve
sy
tio
tio
tio
IT
ic
ip
fo
Le
st
rv
ra
ra
ra
W
In
du
Se
po
po
po
an
In
or
or
or
y
st
nc
du
e
C
C
C
nc
lta
as
in
il
er
lia
O
su
H
G
w
Re
Po
on
an
al
ur
di
C
al
In
at
ta
rm
N
Ta
he
&
lT
il
na
O
io
at
N
Name of company
Source: Adapted from The Economist, London,
Indian public and private sector companies too have lately
acquired coal mines in Australia, tea gardens in Kenya, a $
32.50 billion 49.4 per cent shareholding in Arcelor Steel (now
called Arcelor-Mittal with an annual output of 100 million tones)
and Tata Coffee‘s $220 million takeover of the century-old Eight
O‘Clock Coffee Company (EOC) based in Montvale, NJ, from its
US owners, Gryphon Investors6. A similar bid by United
Breweries to take over a large German brewery is on the cards.
Indian pharmaceutical companies hold patents for several life-
saving generic drugs and a conglomerate of Indian pharma
companies is presently scouting for a large dispensing
pharmacy chain in the US on outright purchase basis on a cash
budget of US$ 800 million. A company of the Indian railways
12. SHANTANU BASU 12
provided the software, its operation and maintenance for the
London Tube while a combine of two public sector companies
has bagged orders for the turnkey construction of thermal
power plants in Australia, Belgium and a number of other
countries in Europe in global competitive bidding.
But would the Indian bureaucracy be able to fulfill such
expectations despite the inherent strength and resilience of the
Indian people, entrepreneurship and knowledge and the natural
resources of the land? The answer would seem to lie in the
ability of the country to combat corruption which has engulfed
almost every aspect of national life and is retarding it progress
and development.
2. Defining corruption
Corruption involves behavior on the part of officials in the
public and private sectors, in which they improperly and
unlawfully enrich themselves and/or those close to them, or
induce others to do so, by misusing the position in which they
are placed. Transparency International (TI)7, the leading NGO in
the global anticorruption effort defines corruption as:
“Corruption involves behavior on the part of officials in the
public sector, whether politicians or civil servants, in which
they improperly and unlawfully enrich themselves, or those
close to them, by the misuse of the public power entrusted
to them.”
An illustrative List of Corrupt Behaviours8 published by the
Asian Development Bank includes the following:
The design or selection of uneconomical projects because
of opportunities for financial kickbacks and political
patronage.
13. SHANTANU BASU 13
Procurement fraud, including collusion, overcharging, or
the selection of contractors, suppliers, and consultants on
criteria other than the lowest evaluated substantially
responsive bidder.
Illicit payments of "speed money" to government officials
to facilitate the timely delivery of goods and services to
which the public is rightfully entitled, such as permits
and licenses.
Illicit payments to government officials to facilitate access
to goods, services, and/or information to which the public
is not entitled, or to deny the public access to goods and
services to which it is legally entitled.
Illicit payments to prevent the application of rules and
regulations in a fair and consistent manner, particularly
in areas concerning public safety, law enforcement, or
revenue collection.
Payments to government officials to foster or sustain
monopolistic or oligopolistic access to markets in the
absence of a compelling economic rationale for such
restrictions.
The misappropriation of confidential information for
personal gain, such as using knowledge about public
transportation routings to invest in real estate that is
likely to appreciate.
The deliberate disclosure of false or misleading
information on the financial status of corporations that
would prevent potential investors from accurately valuing
their worth, such as the failure to disclose large
contingent liabilities or the undervaluing of assets in
enterprises slated for privatization.
The theft or embezzlement of public property and monies.
14. SHANTANU BASU 14
The sale of official posts, positions, or promotions;
nepotism; or other actions that undermine the creation of
a professional, meritocratic civil service.
Extortion and the abuse of public office, such as using the
threat of a tax audit or legal sanctions to extract personal
favors.
Obstruction of justice and interference in the duties of
agencies tasked with detecting, investigating, and
prosecuting illicit behavior.
The Oxford Unabridged Dictionary defines corruption as
“perversion or destruction of integrity in the discharge of public
duties by bribery or favor.” The Merriam Webster‘s Collegiate
Dictionary defines it as “inducement to wrong by improper or
unlawful means (as bribery).” It is often useful to differentiate
between grand corruption, which typically involves senior
officials, major decisions or contracts, and the exchange of large
sums of money; and petty corruption, which involves low-level
officials, the provision of routine services and goods, and small
sums of money9. It is also useful to differentiate between
systemic corruption, which permeates an entire government or
ministry; and individual corruption, which is more isolated and
sporadic. Finally, it is useful to distinguish between syndicated
corruption in which elaborate systems are devised for receiving
and disseminating bribes, and non-syndicated corruption, in
which individual officials may seek or compete for bribes in an
ad hoc and uncoordinated fashion. Some types of corruption are
internal, in that they interfere with the ability of a government
agency to recruit or manage its staff, make efficient use of its
resources, or conduct impartial in-house investigations. Others
are external, in that they involve efforts to manipulate or extort
money from clients or suppliers, or to benefit from inside
information. Still others involve unwarranted interference in
15. SHANTANU BASU 15
market operations, such as the use of state power to artificially
restrict competition and generate monopoly rents. The World
Bank labels this as administrative corruption and refers to it as
the “intentional imposition of distortions in the prescribed
implementation of existing laws, rules and regulations to provide
advantages to either state or non-state actors as a result of the
illicit and non-transparent provision of private gains to public
officials”5. Joseph S. Nye10 posits a fairly comprehensive
definition of corruption:
“Corruption is behavior which deviates from the formal duties of a
public role because of private-regarding (family, close family,
private clique) pecuniary or status gains; or violates rules against
the exercise of certain types of private-regarding influence. This
includes such behavior as bribery; use of a reward to pervert the
judgment of a person in a position of trust; nepotism (bestowal of
patronage by reason of ascriptive relationship rather than merit);
and misappropriation (illegal appropriation of public resources for
private-regarding uses).
In continuation of Nye‘s definition, Mushtaq Khan11 defines
corruption as “behaviour that deviates from the formal rules of
private-regarding motives such as wealth, power, or status”. In a
statistical study of 106 countries during the late 1970s and
early 1980s, IMF economist Paolo Mauro12 found that
corruption ―is strongly negatively associated with the investment
rate, regardless of the amount of red tape.‖ Mauro‘s model
indicates that a one standard deviation improvement in the
―corruption index‖ will translate into an increase of 4 per cent in
the investment rate and more than a 0.5 per cent increase in the
annual per capita rate of GDP growth. Thus ―if Bangladesh (with
a score of 4.7) were to improve the integrity and efficiency of its
bureaucracy to the level of that of Uruguay (score 6.8), its
investment rate would rise by almost five percentage points and
16. SHANTANU BASU 16
its yearly GDP growth rate would rise by over half a percentage
point‖.
2.1 The extent and forms of corruption
That corruption in various forms is endemic to all nations is a
universally acknowledged fact. It only differs in content and
direction. The following instances would show the extent of
corruption worldwide13:
Some estimates calculate that as much as $30 billion in
aid for Africa has ended up in foreign bank accounts. This
amount is twice the annual gross domestic product (GDP)
of Ghana, Kenya, and Uganda combined;
Over the last 20 years, one East Asian country is
estimated to have lost $48 billion due to corruption,
surpassing its entire foreign debt of $40.6 billion;
An internal report of another Asian government found
that over the past decade, state assets have fallen by more
than $50 billion, primarily because corrupt officials have
deliberately undervalued them in trading off big property
stakes to private interests or to international investors in
return for payoffs;
In one South Asian country, recent government reports
indicate that $50 million daily is misappropriated due to
mismanagement and corruption. The Prime Minister
stated publicly recently that the majority of bureaucrats
and the administrative machinery from top to bottom are
corrupt;
In one North American city, businesses were able to cut
$330 million from an annual waste disposal bill of $1.5
billion by ridding the garbage industry of Mafia
domination. A particular problem was the permeation of
regulatory bodies by organized crime;
17. SHANTANU BASU 17
Studies of the impact of corruption upon government
procurement policies in several Asian countries reveal
that these governments have paid from 20% to 100%
more for goods and services than they would have
otherwise;
Corruption can cost many governments as much as 50%
of their tax revenues. When customs officials in a Latin
American country were allowed to receive a percentage of
what they collected, there was a 60% increase in customs
revenues within one year;
Some estimates of the role of corruption in a European
country concluded that it has inflated this country's total
outstanding government debt by as much as 15 per cent
or $200 billion. In one city, anticorruption initiatives have
reduced the cost of infrastructure outlays by 35-40 per
cent, allowing the city to significantly increase its outlays
for the maintenance of schools, roads, street lamps, and
social services.
Academicians over the decades have provided various
classifications of corruption. Amundsen14 provides a useful
classification. The basic level of corruption is grand and petty
corruption that plagues the political leadership and the
bureaucracy. This can be further sub-classified into private and
collective (institutionalised) corruption and redistributive (from
below) and extractive (from above) corruption. While private
corruption is normally limited to an individual or a small set of
individuals, collective corruption is a societal phenomenon with
more pronounced negative economic effect by
extortion/extraction in collusion between groups/classes of
individuals for their respective group/class benefit. Similarly,
while extractive corruption is limited to extraction by select
ruling elite (such as the Duvaliers of Haiti 1957-86 or Mobutu of
Zaire 1965-97), redistributive corruption stems from powerful
18. SHANTANU BASU 18
interest groups based on caste, community, tribes, etc. that
corner certain strategic benefits for themselves. In the final
analysis, the State and its regulating capacity remains the
ultimate sufferer. Rose-Ackerman15 has correctly related the
bargaining power of the state vis-à-vis those of non-
governmental or private actors. She has argued that the nature
of corruption depends on the organisation of government as well
as that of non-governmental actors and the final advantage is
derived from monopoly power of the respective parties in their
dealings.
Another classification of corruption made by the World Bank16,
particularly in emerging nations, is between state capture and
administrative corruption. “State capture refers to the acts of
individuals, groups or firms both in the public and private sectors
to influence the formation of laws, regulations, decrees, and other
government policies to their own advantage as a result of the
illicit and non-transparent provision of private benefits to public
officials”. In this group would fall “the legislature, executive,
judiciary and regulatory agencies. This form of corruption is
generally prevalent in an economy where economic power is
highly concentrated, countervailing social interests are weak, and
the formal channels of political influence and interest
intermediation are underdeveloped”. On the other hand
administrative corruption refers to “the intentional imposition of
distortions in the prescribed implementation of existing laws,
rules and regulations to provide advantages to either state or
non-state actors as a result of the illicit and non-transparent
provision of private gains to public officials”. However, the World
Bank‘s classification is in tune with various other similar
classifications attempted.
19. SHANTANU BASU 19
2.2 The impact of corruption
Corruption delays, disturbs, distorts and diverts growth and
development. It lowers foreign and domestic investment,
reduces incentives for entrepreneurs and heightens risks of
investment. High levels of corruption threaten economic
stability, slow down growth, weaken institutional capacities and
reduce resources available for social development. It violates
basic human rights and introduces preferential treatment in
exchange for consideration. Corruption also has a devastating
impact on the environment. For private industry, it distorts the
growth of sectors, engenders unfair competition and
discourages capital investment. The economic costs of
corruption not only create inefficiencies in the operation of
markets but also distort patterns of public expenditure. Finally,
corruption is divisive and makes a significant contribution to
social inequality and conflict.
Corruption disrupts and even prevents orderly competition and
weakens institutions. Klitgaard17 has explained this with the
following schematic equation:
Corruption = Monopoly + Discretion – Accountability
In his view, corruption thrives where officials have exclusive
control over valuable goods and can use their discretion in
farming these out without having to answer to anyone.
Monopoly plus discretion undermines competitive participation
while discretion minus accountability weakens official
institutions and creates illicit ones. Citizens seeking redress
through established channels against such entrenched
corruption may be reasonably expected to adopt what Alam18
calls evasive ways. Such ways may include dropping out of
politics or the mainstream economy, foregoing economic
20. SHANTANU BASU 20
benefits or even use corrupt links of their own. In fact they can
swell the ranks of corrupt interests.
For some time viewed as an agent for promoting economic
growth by creating informal markets and price systems and
integrating political systems (Leff)19 corruption is today viewed
as a major source of economic and political retardation of
nations keeping in view its long-term effects (Rose-Ackerman)20.
In the process of replacing fair competition by illegal payments,
corruption severely undermines entrepreneurial activity from
productive action into rent seeking. Ironically, corruption also is
seen as an aid to augmenting efficiency (Kaufmann and
Kaliberda)21 - efficiency of extortion. Decline in investments for
human development also leads to a corresponding decline in the
quality of public services (Mauro and Rauch)22. The value and
positive inclination of prospective investors too takes a hit as
corruption becomes a tax on such investment (Wei)23.
Corruption also fosters crime. Corrupt businesses are sheltered
from competition with legitimate businesses by their illegality.
In corrupt systems they also operate without fear of prosecution
by paying off the police and politicians or by incorporating them,
directly or indirectly, into their businesses. The danger for
economic development arises when organized criminal groups
begin to dominate otherwise legal business, e.g. control over
petrol bunks or coal transport contracts in India. Profits from
such illegal business are diverted to legitimate businesses often
undermining them in the process of obtaining public contracts
(Gambetta and Varese)24. Such criminality can generate
financial resources at usurious rates by threatening violence in
a scarce capital scenario in certain industries (Webster; Webster
and Charap; Yabrak and Webster)25, e.g. the Bombay film
industry which is, to a large extent, financed by the underworld.
21. SHANTANU BASU 21
Corruption distorts political development. The essence of a
welfare state is defeated when patronage networks come into
being for the sole purpose of controlling citizens and resources
rather than for improving the quality of human life. Politicised
use of divisible incentives (Johnston)26 degenerates into a
disorganized scramble for spoils (Easterly and Levine)27
culminating in corrupt elites consuming as much as possible
within a limited time (Scott)28. Such aberrations
notwithstanding, democracies are however, unlikely to lose their
basic character given the presence of independent regulators,
law enforcement agencies and popular will.
Corruption ultimately affects the poor and causes the gap
between the rich and poor to increase. The poor will invariably
receive a lower level of social services. Use of illegal price
systems to distribute pensions, public housing, education and
health will disadvantage those unable to pay. Secondly,
investment in infrastructure will be biased against anti-poverty
projects. Small and simple community projects and indigenous
small-scale enterprises that would not contribute substantially
to bribery would be placed on the back burner. Thirdly, the poor
not being able to face the taxation system without bribes may
proceed to the underground economy. Consequently, the state
would not be able to provide them the requisite social services
once faced with a fiscal crunch from falling tax revenues.
2.3 Corruption as a national issue in India
With a pessimistic 78 per cent of an interviewed population29
believing that corruption would increase in India and US$ 523
(PPP value) being the estimated average annual outgo per capita
and accounting for 10-20 per cent of GDP paid as bribes per
household, , any study must necessarily focus on the causes of
such rampant corruption. For this purpose it is proposed to
22. SHANTANU BASU 22
classify the sources in three categories, viz. historical, societal
and environmental in this study.
Transparency International‘s Report for 2005 ranks India at 88th
place out of 158 in its Corruption Perceptions Index. The
following table would amplify the position
further:
3.5
3
2.5
2
1.5
1
0.5
0
Sri Lanka Bangladesh Pakistan Myanmar China India
Source: Adapted from TI International: Corruption Perceptions Index, 2005
The major sources identified by Transparency International
globally are also the same in India as would be seen from the
following table:
4
3.5
3
2.5
2
1.5
1
0.5
0
Political Police Business Customs Medical Education Registry & Religious
parties services permit bodies
services
Source: Adapted from TI International: Corruption Perceptions Index, 2005
23. SHANTANU BASU 23
This is all-important when one considers the public perception
of basic public services as being excessively corrupt as would be
seen from the following table from Transparency International
India‘s (CMS) study in 200528:
Using
Department Direct Poor influence/ Corruption Commitment Perception Composite
experience quality middlemen perception to reduce increased Index
of bribing of of dept. corruption value
service
NEED BASED
RFI 19 23 14 25 31 29 22
Income Tax 20 30 23 62 38 38 35
(individual
assesses)
Municipalities 23 60 32 75 60 57 47
Judiciary 47 62 31 81 58 63 59
Land 48 58 37 79 63 62 59
administration
Police 8-0 74 12 88 64 77 77
BASIC
Schools (up to 18 20 9 45 27 31 26
Grade 12)
Water supply 9 33 13 56 37 38 29
Public 16 43 27 62 48 46 37
Distribution
system
Electricity 20 41 12 67 50 49 39
(consumers)
Govt. hospitals 27 44 18 67 48 50 42
Average 18 36.2 15.8 59.4 42 42.8 34.6
24. SHANTANU BASU 24
The World Bank‘s governance performance statistics30 too show
a similar picture from 1998-2004 as follows. In fact the graph
and appended show several critical parameters having
significantly worsened in 2004 over 1998, in particular
regulatory quality, rule of law and control of corruption:
Percentile Rank
Governance Indicator Year
(0-100)
2004 53.9
Voice and Accountability
1998 58.6
2004 24.3
Political Stability
1998 27.3
2004 55.8
Government Effectiveness
1998 50.8
2004 26.6
Regulatory Quality
1998 41.8
2004 50.7
Rule of Law
1998 67.0
2004 47.3
Control of Corruption
1998 59.6
Source: Kaufmann D., A. Kraay, and M. Mastruzzi 2005: Governance Matters IV:
Governance Indicators for 1996-2004.
25. SHANTANU BASU 25
2.4 The Weberian model and Indian bureaucracy
Bureaucracy plays a pivotal role in ensuring the rule of law and
preventing corruption. It is therefore necessary to trace its
evolution Max Weber‘s31 theory of bureaucracy describes a new
organizational form called a bureaucracy. To him, in a
bureaucracy leadership and authority were derived from a more
‗rational‘ framework than was the case before. Unlike in earlier
periods the bureaucracy derived its authority from logic,
efficiency and reason rather than charisma or tradition. This
new organisation functioned on the basis of rules, laws and
regulations and their legitimacy from the consistent, disciplined,
rationalised and methodical calculation of optimum means to
given ends. Weber viewed bureaucratic action as being typically
oriented towards solving problems and that bureaucratic
decision-making was guided by the objectives of efficiency,
calculability and predictability. Thus decision-making was
‗rational‘, made as these decisions were not with reference to
any person(s). Weber also believed that bureaucracies being
technically efficient instrumentalities of administration since
their institutionalised rules and regulations helped their
employees to perform their duties optimally. Notwithstanding
the value Weber attached to bureaucracies, Weber was also
critical of the bureaucracy for its tendency to impose excessive
controls on employees often imprisoning them in an ‗iron cage‘.
In sum, the key features of Weberian organisations are that they
are hierarchical, maintain division of labour and are governed
by rules. While hierarchy results in vertical differentiation,
division of labour entails horizontal differentiation within the
structure of an organisation.
In the century after Weber‘s assertion of the virtues of a
bureaucracy, most scholars have become increasingly critical of
its ways thereby giving the term ‗bureaucracy‘ a most negative
26. SHANTANU BASU 26
connotation in more modern times. Burns and Stalker32
observed that highly bureaucratic organisations were change-
resistant. The traditional hierarchical structure itself promoted
self-perpetuation and retarded innovation. Another negative
quality was the sub-optimisation‘ (Selznick)33 in bureaucracies
by which units possessing delegated powers worked at cross-
purposes with the stated objectives of the mother organisation.
Yet another criticism of the traditional theory has come from
Gouldner34 who found that the ‗govern according to rules‘
culture in bureaucratic organisations led to members following
the minimum possible rules required. This, in turn, had a
cascading effect in obtaining more than minimally acceptable
behaviour from members. Merton35 has stated that a major
failing of bureaucracy was its tendency to foster ‗goal
displacement‘. In the process of following rules and regulations
rigorously resulted in rules becoming an end in them thereby
subverting the real goals of an organisation. Further,
application of rules and regulations often in inappropriate
circumstances and the tendency to routines unique events
resulted in dysfunctional outcomes. The role of individuals in a
bureaucratic organisation has been commented upon adversely
by Blau36 who proposed that in bureaucratic organisations,
certain people who knew how to ‗play by the rules‘ shifted power
from the nominal leaders, who did not know how to play by the
rules, to with people who did. In a similar vein, Ostrom37 has
argued that the bureaucratic structures ―are necessary but not
sufficient structures for a productive and responsive public
service economy.‖ Claus Offe38 has, in his counter Weberian
analysis spoken of a bureaucratic structure as running against
the rationality of developed welfare-state capitalism unlike the
Weberian bureaucracy that was relevant to a ―specific historical
phase and contingent from the standpoint of functional
rationality‖. Mainly, scholastic studies have dwelt upon specific
27. SHANTANU BASU 27
aspects of the bureaucracy such as inefficiency, corruption,
concentration of power, managerial frustration, dissatisfaction,
low creativity, organizational conflict, poor decision-making,
misuse of power, political interference, etc.
Yet studies have found that bureaucracies work well in certain
contexts such as the evolution of society in erstwhile communist
USSR, decline of the ancient Roman army and the development
of the British pottery industry during the Industrial Revolution.
However, these appear to be more by way of exceptions than as
rules. An attempt has been made to fuse some of the above
theories and opinions in the Indian context in the succeeding
paragraphs.
2.5 Causes of corruption in India
Before delving into the causes of administrative corruption, it is
important to understand the hierarchical organisation of the
bureaucracy in India. The following diagram shows the layout of
a typical federal Ministry/Department:
28. SHANTANU BASU 28
Prime
Minister
Cabinet
Minister
Minister of Secretary
State
Secretary Same as for the other Secretary
Additional Secretary/Jt.
Secretary
Director/Dy.
Secretary
Under
Secretary
Section
Officer
Clerical staff
Chairperson, Advisory Councils
Directors-General Central Police Forces [Home only]
Autonomous body CEOs
Public sector CEOs
Average: Secretaries (2-3); Addl. Secretaries: 1-2; Jt. Secretaries: 5-7; Directors/Dy.
Secretaries: 10-15; Under Secretaries: 15-20; Section Officers: 15-20
29. SHANTANU BASU 29
2.5.1 Historical causes of administrative corruption in India
For 4850 of its 5000 year history, India remained a bevy of
feuding princely states whose sole sources of revenue came
either from land and trade or pillage. Colonial administration
relied mainly on strength of Draconian laws, police and military
might, fostering dissension amongst the Indian princes and a
fear of the State apparatus on the citizenry to govern the
country. Nor was Indian enterprise and capital encouraged to
flourish. Needless to say, democratic institutions did not have
any opportunity of formation. At the dawn of Independence in
1947, India had a band of visionary and dedicated leaders with
a colonial bureaucracy to overcome centuries of
maladministration and human suffering.
Bureaucracy in India – its structure, role, behaviour and
interrelationships – has evolved over 150 years. The Macaulay
Committee Report (1854)39 recommended a civil service based
on the merit system establishing the principle that ―henceforth,
an appointment to the civil service of the (East India) Company
will not be a matter of favour but a matter of right. He who
obtains such an appointment will owe it solely to his own
abilities and industry.‖ This was significant since a study has
shown that 23 per cent of nominations to the Indian Civil
Service between 1809 and 1850 were made to relatives of
Directors of the East India Company while 55 per cent were on
the basis of friendship (Cohn)40. This bureaucracy also had a
Weberian side to it inasmuch as it was recruited from the
affluent sections of society owing allegiance to the English
Crown- exclusivity that Weber felt was essential to a true
bureaucracy. Recognising this bureaucracy‘s imperial
significance Prime Minister Lloyd George declared in the House
of Commons in 192241 that ―they are the steel frame of the
whole structure. I do not care what you build upon it - if you
30. SHANTANU BASU 30
take the steel frame out, the fabric will collapse‖. This
perception did not change even with post-independence leaders
of the stature of Jawaharlal Nehru (India‘s first Prime Minister
1947-64) and Vallabh Bhai Patel (India‘s first Home [Interior]
Minister 1947-50). This was perhaps on account of the
bureaucracy and the political leadership sharing a common
social and cultural background42. Wedded to the Weberian
characteristics of hierarchy, status and rigidity of rules and
regulations and concerned mainly with the enforcement of law
and order and collection of revenues, the Indian bureaucracy in
its colonial form did not fit into the priorities of a developing
state.
Up to the 1930s the Indian bureaucracy was well-paid even by
contemporary international standards as Potter43 has shown in
the following table:
Top Indian Civil service Monthly pay Comparative Posts Monthly pay
Posts
(In Rupees) (In Rupees)
Governor of United Provinces 10,000 - -
Governor of Bihar 8,333 Governor, New York State 5,687
Member Viceroy‘s Council 6,666 Cabinet Minister, UK 5,555
Governor of Assam 5,500 Chief Justice, US Supreme 4,550
Court
Secretary, Govt. of India 4,000 Treasury Secretary, UK 3,333
Chief Secretary, Madras 3,750 Cabinet Member, USA 3,412
Commissioner, Bombay 3,500 President, Poland 1,560
Chief Secretary, Bihar 3,000 Governor, South Dakota 682
Secretary, Madras 2,750 Prime Minister, Japan 622
31. SHANTANU BASU 31
The idealism of the pre-Independence leaders soon gave way to
a sea of political leaders claiming to represent caste and
communal interests and whose sole interest lay in vote politics
based on caste, regional and linguistic basis while the
bureaucracy gained in strength as the ultimate arbiters of
India‘s destiny. In doing so, the bureaucracy fully ‗lived up‘ to
the words of Sir John Simon in his Indian Statutory
Commission Report (1930)44:
“In a country of small cultivators, no accumulated resources and
little experience in organisation, except along the limited and
traditional lines of the village community, private enterprise
cannot undertake new and costly experiments. The task of
bringing within reach of such a society the benefits of the
administrative experience and the applied science of the West
was possible for one agency only-Government; no other had the
necessary knowledge or machinery. Thus the civil service of
India, which in origin was little more than a revenue collecting
agency, gradually took upon itself a very wide range of duties. As
the work became specialized, new services had to be created to
carry it on, and in this way there grew up departments dealing
with public health, education, forestry, agriculture, irrigation,
archaeology, and many more. India looks to government to do
many things which in the west are done by private
entrepreneurs.”
Idealism and euphoria arising from newly found freedom
coupled with the multifarious problems from the greatest divide
in human history (Partition) and a sudden vacuum created by
the departure of colonial administrators ensured that the
colonial bureaucracy assumed control. The press and media,
stifled by years of colonial repression, neither had the networks
32. SHANTANU BASU 32
nor the capital to enhance their coverage. Neither had the
telecommunication and education sectors developed nor the
capabilities of the accountability enforcing agencies. Grinding
poverty, hunger and disease disallowed the population from
devoting its energies to enforcing accountability. The middle
class and intelligentsia also constituted a miniscule proportion
of the population and even so, were more favourably disposed to
the erstwhile colonial rulers that had created this class. The
legal system too, suffering from the ravages of Partition, was in
no position to play the role of an effective enforcer. Therefore it
was but natural that India had little choice but to fall back upon
the bureaucracy to administer the nation during this crisis and
execute the first mega development projects. A millennium of
civil strife, foreign invasion, colonial rule and societal divisions
centering on religion, community and caste, absence of political
cohesion amongst rulers, ensured that the impoverished and
hungry population, at the dawn of Independence, possessed
neither the bare minimum educational attainments nor the
capital and resolves to claim their lawful rights and participate
in government.
Conditioned by the demands of a highly stratified feudal society
and lured by an utter mismatch between a burgeoning
population and available infrastructure and services, open to
not infrequent political intervention, India‘s civil service is yet to
come to grips with the fast changing economic scenario and
desperately clings to its colonial vestiges with an adopted veneer
of modernity and a put-on concern for welfare of the community
of governed citizens. Shrouded in a veil of secrecy with an open
disdain for professionals, mainly confined to mass-scale
graduate and post-graduate degrees and deeply rooted in
colonial times, India‘s bureaucracy is partly responsible for the
country‘s abysmal rating by Transparency International. The
33. SHANTANU BASU 33
Indian bureaucracy‘s inability to deal effectively with the
complexities and ravages of a post-Partition (1947) India
stemmed from the facts that they were ill-equipped both by
training and mindset to cater to the wave of rising expectations
of a newly independent population in a democratic polity. Nor
did they possess what Bhatt45 quantifies as the sole objective to
―emphasize results, rather than procedures, team-work rather
than hierarchy and status, [and] flexibility and decentralisation
rather than control and authority‖.
It was quite unlike what Woodrow Wilson in his seminal essay
on ‗The Science of Administration‘ (1887)46 had envisioned the
role of government:
“There is scarcely a duty of government which was once simple
which is not now complex; government once had but a few
masters; it now has scores of masters. Majorities formerly
underwent government; they now conduct government. Where
government once might follow the whims of a court, it must now
follow the views of a nation.”
This essay was written when there was a public outcry against
corruption, improvement of efficiency and streamlining of
service delivery in the pursuit of public interest – a scenario that
is being presently repeated in India. Therefore it is imperative
that the Indian bureaucracy, as Esman47 says, accepts its
limitations and works in tandem with community and private
agencies. In a similar vein, Chambers48 describes the need for
‗bureaucratic reversals‘ in most situations where officials know
less than their clients; professionals should move from being
experts transferring information to become consultants and
collaborators of the poor. Disillusionment with the bureaucracy
and its inability to deliver on promises has fuelled demands
from a section of academia that sees non-governmental
34. SHANTANU BASU 34
organisations (NGOs) as agents of development (Korten)49.
Notwithstanding such opinions, one cannot wish away the
continued importance of governance and it three main organs,
viz. the executive, judiciary and legislature. Governance in the
contemporary context is as Rhodes50 states “……. the new
method by which society is governed”. “Thus the governance
concept points to the creation of a structure or an order which
cannot be externally imposed but is the result of the interasction
of a multiplicity of governing and each other influencing actors”
(Kooiman and Van Vliet)51. Thus the role of governance retains
centre stage in all lending operations of the World Bank52 as
would be seen from the following table:
Category Proportion of lending
operations with governance
content (per cent)
Legal framework 6
Participation 30
State-owned enterprises reform 33
Economic management 49
Capacity building 68
Democratisation 68
Source: World Bank, 1992. Governance and Development, Washington DC
Expansion of market concepts in the public sector is taking
place coinciding with the thrust to build administrative systems
that address the problems of a growing urban-industrial nation.
That is why the public sector appears to be large, cumbersome,
wasteful and beyond citizen control (King and Stivers)53. The
35. SHANTANU BASU 35
historical distinction between private and public sectors is
‗essentially obsolete‘ and management therefore should be
generic across sectors. (Peters and Pierre)54. However, treating
citizens as happy customers may also be equally
counterproductive. Therefore governance in India needs to be
dynamic, responsive and participative and deliver public
services economically and efficiently with adequate levels of
accountability.
2.5.2 Societal causes of administrative corruption in India
Any bureaucracy arises from society and there can be no
different yardstick for the Indian bureaucracy. Recruitment to
the ‗Covenanted Services‘ such as the Indian Civil Service,
Imperial Police and Indian Audit and Accounts Service,
although based on competitive examinations conducted in
England, were restrictive in nature and other considerations
such as those relating to family connections, caste, religion, etc.
played significant roles in determining selection. There was also
selection by nomination without any benchmarking
examination. It was therefore natural that only the miniscule
and land-owning rich middle class (the biggest single supporters
and beneficiaries of colonial administration) were represented in
the upper echelons of India‘s bureaucracy. Having benefited
from English education and largesse in various forms
(including, but not limited to, knighthoods, land grants, etc.)
this class, since its inception by the then Governor General of
India Lord Cornwallis in 1793, served as a surrogate
bureaucracy to the colonial administrators. There was not much
difference when it came to recruitment for subordinate
government positions either. Bulk of the jobs were low paying
but welcome to an otherwise impoverished population with
virtually no other sources of income. Having originated from
various castes and communities, the colonial civil service
36. SHANTANU BASU 36
favoured regional and caste based loyalties and was looked
upon as the saviours by fellow citizens. It was this very class of
indigenous colonial administrators that decided the distribution
of projects, their executors, funding, and deployment of
personnel and shaping of a nascent nation‘s laws. Centuries of
deprivation and impoverishment coupled with the laxity of the
post-independence polity enabled the Indian bureaucracy to
make inroads into every sphere of life in India, irrespective of
their capabilities.
2.5.3 Environmental causes of administrative corruption in
India
The causes under this category are mainly economic and partly
related to service conditions of the bureaucracy.
2.5.3.1 Economic causes of administrative corruption in
India
An important economic cause of corruption is the relatively low
salaries of the 20 million government work force, particularly
the senior civil services. A secretary (in his mid to late-fifties) to
the Government of India (the topmost rung of the civil service)
today earns around INR 60,000 per mensem that translates to
US$ 1350. However, added to this are non-taxable fringe
benefits such as chauffeured staff cars, orderly
messengers/attenders, other personal staff, virtually unlimited
telecom facilities, leave travel concession by air for himself and
his dependants, spacious premium government residential
family accommodation, inflation-indexed lifetime pension and
family pension thereafter, provident fund, comprehensive
lifetime health care (at US$ 3 per month) for himself and his
dependants and, in case of railway officers , the lifetime privilege
of free air-conditioned first class railway travel for himself and
his spouse. An approximate additional cost to all these items at
37. SHANTANU BASU 37
current cost would translate to INR 400,000 or US$ 9,000,
making for a gross salary liability per head for the federal
government of approx. US$ 10,350 per month. This pales into
insignificance when one considers starting salaries for a fresh
Indian Institute of Management graduate (in his early twenties)
ranging from INR 300,000 to 400,000 per month (US $ 7,000-
9,000) plus incentives that could add twice as much to the base
salary apart from self-designed rapid intra/inter-sectoral
mobility at a time of his/her choosing. However, the lower
echelons of the bureaucracy, particularly junior officers and an
army of clerks, accounting for about 95 per cent of the
bureaucracy are paid salaries ranging from INR 8,000 – 30,000
(US$ 175 – 700) although they too have scaled down non-
taxable perquisites such as pensions and health care.
In 1991, the then Government of India introduced far-reaching
reforms in the first phase of liberalization of the economy.
Subsequent interventions by successive governments have
added pace to this movement. However, by redefining the role of
government vis-à-vis the economy, liberalization has given way
to the bureaucracy to use its state power for selling/disinvesting
public enterprises in oft-criticised and low-transparent manners
as also arrogating to itself the authority to permit or deny
licenses to foreign/indigenous companies/entrepreneurs for
setting up manufacturing, service or much-needed
infrastructure facilities. However, this may be only a transitory
phenomenon as private industry comes to occupy centre stage
and a relatively limited ‗price‘ to pay for a brighter future.
Another factor that impinges on corruption is the recent trend of
coalition politics in India. Underhand political funding and
uncertain tenures of governments and ministers have
engendered an unholy nexus between the bureaucracy and the
politicians insofar as corruption is concerned. Such a strong
38. SHANTANU BASU 38
nexus also becomes apparent when one considers the utter
helplessness of accountability agencies that are either given
advisory status or have to wait endlessly for government
permission to institute prosecution proceedings against
delinquent officers/politicians. Even proceedings where
launched are stymied by poor legal follow-up and presentation,
absence/destruction of original evidence, layers of legal appeals
and ultimately, nominal exemplary punishments.
The all-pervasive lure of ill-gotten money that India‘s Central
Vigilance Commission characterizes as a ―low-risk and high-
return‖ enterprise has encouraged the average citizen to view
the Indian bureaucracy as predatory and oppressive rather than
enabling thereby reinforcing their sense of helplessness and
exclusion. By distorting development priorities such as the
execution of often-controversial single mega projects instead of
localized smaller and functional ones (without attendant
problems of rehabilitation, employment, etc.) in the search of a
bigger ‗share‘ of the ‗booty‘, the bureaucracy, in tandem with the
political leadership has skewed development to the detriment of
the population.
2.5.3.2 Service conditions as cause of administrative
corruption in India
An interesting feature about India‘s bureaucracy is that it
constitutes only around 1.2 per cent of the population against
the OECD average of 7.7 per cent (with pronounced reliance on
private sector delivery mechanisms)55 and yet exercises a
stranglehold on the country. While there is, prima facie, a strong
case for increasing the government workforce, yet there are
major angularities in the staffing patterns thereby giving an
impression that salary and pension spending at around 25 per
cent of total government expenditures is too high relative to non-
39. SHANTANU BASU 39
salary spending. Thus the State Government of Delhi has only
37 food inspectors to inspect 450,000 food outlets – a ratio of
1:12,000. Against this the Karnataka State Administrative
Reforms Commission (2001) found that 45 per cent of filled
positions in the Irrigation department, 73 per cent in the Public
Works Department and 53 per cent in the Mines and Geology
Department were in excess of requirement. The productivity of
the government workforce does not generate any cause for
optimism either. Steady salary increases in the public sector
have ensured that the salary of a graduate teacher in the Indian
state of Uttar Pradesh increased in real terms by 36 times from
1960-61 to 1995-96 (Kingdon and Muzammil)56. Mehrotra and
Buckland57 have estimated that the ratio of trained graduate
teacher salary to state domestic product per capita increased
from 8.4 in 1985-86 to 13.5 in 1995-96. This compares
unfavourably with Carnoy and Welmond‘s58 findings that show
the ratio of an average teacher‘s salary to GDP per capita for
West and Central Africa at 7.3, almost half of Uttar Pradesh‘s
average in 1995-96. The declaration of all private elementary
schools in the state of Madhya Pradesh as government schools
by the state government in the early 1980s overnight brought
650,000 teachers into government service. Thus political
compulsions in creating posts and recruitment to these posts,
except the senior federal and state civil services, has severely
skewed the structure of the Indian bureaucracy for it to be able
to act as a major agent of change and development.
Fragmentation of the civil services both at federal and state level
and the absence of any horizontal, vertical or lateral movement
between services have also added to the absence of
specialisation and recognition of good performance as a way to
obtain career advancement. Faced with slow promotions, many
of these services have sought to make good official
40. SHANTANU BASU 40
compensation with less honourable means fuelling corruption
further.
An important aspect that merits discussion is the training of
personnel. Although the Government of India has laid down that
every Ministry/Department shall earmark one per cent of its
gross annual expenditure on staff training and training
institutions have mushroomed, yet the quality and commitment
to such training remains well below par. An unwillingness to
serve in any training institution and perception of such
institutions as being anti-professional climbers has
characterized these institutions. Although the senior federal
services are trained in private institutions such as Indian
Institutes of Management and foreign universities, the training
effort for the bulk of the file-processing ranks has been
lackadaisical at best. The end result is a vast bureaucracy that
frequently oversteps its rights and obligations, is ill-equipped to
comprehend the subtleties of current-day economics and
finance, yet standing in the way of professionalisation of these
services. A standing example of bureaucratic ennui is the
almost daily multiple interventions by courts of law, including
the federal Supreme Court, on issues relating to subjects as
diverse as admissions to educational institutions, environment,
unauthorised constructions, etc.
A major factor that affects the civil services in India is that of
chronic and rampant political interference leading to frequent
suspensions from service and transfers and diluting or even
removing any accountability of these officers. This engenders
corruption by way of informal auction of posts to the highest
bidder by politicians. About two decades back, Robert Wade
noted the buying and selling of posts in his study of the
irrigation department of a major south Indian state government.
Wade59 noted that irrigation engineers were able to extract large
41. SHANTANU BASU 41
amounts from the sale of posts as well as award of contracts
and water to lobby groups. After a share for the engineers, the
bulk of this money found its way into the coffers of politicians
for elections and other purposes. The buyers of these posts, in
turn, had to work hard to recoup their investment by extracting
as much revenue as they could before either being transferred
or winning an extension with this wealth. Evidently, the more
downstream problem of chaos in administration caused by high
turnover rates is linked to the upstream imperative effacing
politicians to extract revenue from routine government functions
to finance their quest for office.
Another important factor that adds to the limited capabilities of
the bureaucracy and engenders corruption is the continued
employment uncertainties of the bureaucracy, particularly in
the wake of recent government pronouncements and action in
strategic disinvestment, winding up of unprofitable ventures,
ban on recruitment, economy instructions, scaling down of
some redundant organisations, etc. All these have been mainly
done by governments unable to make their balance sheets tally.
Lowering of revenue barriers, post-WTO, also has meant a
general decline, in real terms, of government revenues and
consequently the affordability of several government structures
in a scenario where a dynamic private sector has emerged as a
powerhouse of industry and services. With the services sector of
the economy expanding at almost breakneck speed, many
government departments would have to be eventually closed
down. Possessed of very limited educational and professional
attainments and skills vis-à-vis fast advancing technology and
skills from the private sector and the perceived absence of
alternative employment opportunities have led the bureaucracy
into believing that as a facilitator alone, their sources of
‗supplemental‘ income would eventually dry up. This perhaps
42. SHANTANU BASU 42
has also led the bureaucracy at all levels to attempt a free run
on all the resources that India has.
A bureaucracy mirrors the societal environment of any country
which also becomes its biggest negativity. Complacency arising
from excessive insulation by a maze of antiquated rules,
regulations and laws, high levels of illiteracy in the population, a
non-participatory monolithic administrative organisation vested
with unwritten discretion, regional and caste loyalties – all these
and more serve to make the Indian bureaucracy expensive and
expansive, inefficient and corrupt apart from engendering
mediocrity.
3. Elections and political party funding as a source of
corruption in India
The evolution of a democracy usually takes several centuries
and several generations of citizens to mature. While the UK
became a constitutional monarchy in 1689, established the
Tories, Whigs and Liberals as the precursors of today‘s parties,
introduced universal suffrage in 1918, it was not until 1945
that a well-defined and distinct two-party political system was
evolved. Similarly, although France became a constitutional
monarchy in 1790 and a democratic republic in 1871, yet a
stable democracy came into being only in 1958. The US too,
starting with independence in 1783, introduction of the party
system in 1824, established the present party system in 1856.
Thus while the UK took between 27 and 256 years to build its
democracy, France took 78-168 years, Germany 30-80 years,
the US 30-70 years and Japan around 50 years. However, none
of these nations had ever to carry a colonial burden or were
faced with a fragmented and fractured society, political disunity
and major social divides. Compared to these nations India‘s
democracy has found firm roots although it would yet take
43. SHANTANU BASU 43
perhaps another five decades to reach a similar level of
maturity. Nevertheless, the basic concepts of a democratic polity
such as universal franchise, popular sovereignty, and
institutionalised control of power and pluralism of political
forces are quite well established in India.
Since Independence (1947), India has witnessed series of
elections to the lower House of Parliament (Lok Sabha or the
House of the People). The official estimated figures of
expenditure on such elections are shown in the following graph:
14000
Expenditure incurred (In INR
12000
10000
million)
8000
6000
4000
2000
0
52
62
71
80
89
96
99
19
19
19
19
19
19
19
Year
Source: Adapted from data available at www.eci.gov.in
The size of the electorate too is perhaps the largest in the world,
proof of India‘s living democracy as shown in the following
graph:
44. SHANTANU BASU 44
800000000
700000000
600000000
500000000
Number of electors
400000000
300000000
200000000
100000000
0
1 2 3 4 5 6 7 8 9 10 11 12 13 14
Year
Source: Adapted from data available at www.eci.gov.in
In 1991, the conduct of general elections required some 600,000
polling stations (775,000 for 1999 and 687,000 for 2004
elections) for the country's 3,941 state legislative assembly and
543 parliamentary constituencies. To attempt to ensure fair
elections, the Election Commission in India deployed more than
3.5 million officials, most of who were temporarily seconded
from the government bureaucracy, and 2 million police,
paramilitary, and military forces. Loksatta60, an Indian NGO,
estimates expenditure incurred by parties and candidates for
Parliament and State Assembly elections to be about Rs.7000
crore. Strangely, this figure in absolute terms is comparable to
the exorbitant election expenditure in the US. In the 2000
elections in the US for the presidency, both Houses of Congress,
gubernatorial offices and state legislatures, the total
expenditure was estimated to be about US$ 3 billion. About half
of it was incurred for issue-advertising by political action
committees (PACs) and pressure groups. The actual campaign
expenditure was probably about $ 1.5 billion, which is almost
exactly the amount spent in Indian elections! When one
45. SHANTANU BASU 45
considers the high purchasing power of the INR as opposed to
its low exchange value, India‘s real expenditures are about five
to six times that in the US. Yet, India‘s income per capita is
nearly one-eightieth of that in the US. Adjusting for India‘s
higher population, and relative to per capita income, the
country‘s per capita election expenditure is several times (about
20 times in purchasing power terms and 100 times in absolute
terms) than in the US!
However, that the desired maturity level of Indian democracy is
yet to be reached is evident from the fact that there are no
meaningful laws and conventions on regulation of political party
funding. Thus a legal provision that allows only public sector
companies to contribute to political parties (an impossible task)
while the Income-Tax law provides for limited exemptions on
contributions made by corporate entities to political parties. In a
highly politically fractured polity combined with the
uncertainties of multi-party coalition politics, to expect any
corporate entity in the private sector to identify itself with any
political party is most inappropriate for reasons of vendetta at a
later date. No clear cut guidelines or laws either exist to govern
political party funding.
It is therefore a natural phenomenon that parties and their
politicians often extort finances from private companies and
businessmen either by way of denial of a license, not allowing
change of land end-use, environmental clearances, media
advertisements from government agencies, transfers and
postings of bureaucrats, budgetary support, and grants to
NGOs, etc. The administrative system similarly promotes
political corruption. Virtual auction of civil engineering officers‘
posts in public works departments, Project General Managers in
the telecommunications sector, national highway projects,
irrigation projects, out-of-turn promotions, convenient
46. SHANTANU BASU 46
placement of favourable bureaucrats, allocation of budget
outlays, – the list is endless. Raking up issues relating to
reservation of university seats on religious and caste basis is
another ploy. Forcibly imposing quotas on admissions and
reserving a part of few available seats for government nominees,
directly or indirectly, government quotas on state-run railways,
bus services, airlines, issue of food ration cards, driving and
gun licenses, issue of all-India motor transport permits,
transportation of POL products by public sector companies (the
contracts) are the usual sources of corruption arising from an
unholy nexus between the bureaucracy and politicians.
Deregulation then, more than new and often unenforceable
laws, would appear to be the sole answer to these ills.
4. Municipal administration and corruption in India
The urban population has been projected to rise by India‘s
Planning Commission61 to 40 per cent of a total estimated
population of 1.33 billion by 2020 , i.e. over half a million from
the current level of 27.80 per cent, i.e. 284 million. Such
demographic growth is expected to be confined to around 60-70
large cities in the country.
The following graph illustrates the growth of towns/urban areas
in India during the last century:
47. SHANTANU BASU 47
5000
Number of towns/cities
4000
3000
2000
1000
0
1901 1911 1921 1931 1941 1951 1961 1971 1981 1991 2001
Towns/UAs 1827 1815 1949 2072 2250 2843 2365 2590 3378 3768 4368
Source: Census of India, 2001
Concurrently, the percentage of urban population too has
shown a rise as the following graph shows:
30
25
20
15
10
5
0
1901 1911 1921 1931 1941 1951 1961 1971 1981 1991 2001
Source: Census of India, 2001
With liberalization of the economy, increasing reliance would
have to be placed on institutional financing and capital markets
for resource mobilization and on the private sector for service
delivery. Given the generally poor performance track record and
financial performance of most municipalities, apart from an all-
pervasive public perception of being amongst the most corrupt
in India, is likely to make it extremely difficult for them to raise
48. SHANTANU BASU 48
resources from the market. Issues such as those relating to
reduction of urban poverty, employment, environment
management, housing, water supply, energy, transportation,
road decongestion, town planning, zoning, sanitation, etc. would
increasingly come into focus.
Financing urban services is perhaps the single major challenge
that faces India‘s planners. In 2001-02 municipal revenues
constituted barely 3 per cent of total government revenues
although the served population was nearly 300 million. This
was after a more than 10 per cent annual revenue expenditure
growth rate over the last decade. Consequently, municipalities
have had to depend on devolution of resources from the State
governments which too did no have adequate resources. This
has translated into abysmally low levels of civic services.
Rampant corruption has further reduced the efficacy even of
these limited resources for citizens‘ welfare. Fifty to eighty per
cent of all municipal resources are consumed by salaries while
operations and maintenance expenditure account for 20-40 per
cent of the total expenditure of a municipality. Some metro area
municipalities such as those in Bombay, Calcutta and Delhi are
unmanageably large and have fallen victim to priorities of the
elected representatives that head them. Here too the unholy
nexus between municipal officers and employees and their
political masters has contributed in some measure to the
quality and distortion of urban development plans.
Some municipalities have become unmanageably large and have
indisciplined and huge departmental work forces that are
recruited in much less than transparent manner poorly
educated and virtually untrained. Efforts to break-up these
monolithic entities have not succeeded for a variety of reasons.
49. SHANTANU BASU 49
5. Education administration and corruption
India is home to 17 per cent of the world‘s total population
accommodated in an area which is 2.4 per cent of the world‘s
total area. Of 2820 languages in the world, as many as 325
languages are effectively used in India alone. The country has
witnessed phenomenal educational development – both in
quantitative and qualitative terms, since independence. The
country has also made significant strides in higher and
technical education. India spent a nominal 4.02 per cent of its
GDP on education during 2001-2002 but about 44 per cent of
its adult population still remains to be made literate62. The
following statement compares the population, area, density,
literacy rates and level of public expenditure on education in
India and some of its neighbouring countries:
Particulars Population Area Density Percentage Percentage Public expr.
(millions) (Sq. Kms) to world of adult on
(2000) illiterate education
Population as %age of
2000 GNP (1996)
World 6055.0 * 135604354 45 100 100 20.6 NA
Afghanistan 21.2 # 652090 33 0.48 0.35 63.7 N.A.
Bangladesh 129.2 143998 897 0.11 2.13 59.2 2.2
China 1277.6 9596961 133 7.08 21.10 15.0 2.3
India 1027 $ 3287590 312 2.42 16.96 44.2 3.2
Indonesia 212.1 1904569 111 1.40 3.50 13.0 1.4
Japan 126.9 377801 336 0.28 2.10 NA 3.6
Myanmar 46.4 676578 69 0.50 0.77 15.3 1.2 &
Nepal 22.5 # 140797 160 0.10 0.37 58.6 3.2 @
Pakistan 156.5 796095 197 0.59 2.58 56.7 2.7 @
Sri Lanka 18.8 # 65610 286 0.05 0.31 8.4 3.4
Thailand 62.0 # 513115 121 0.38 1.02 4.4 4.8
SOURCE: Statistical Yearbook, 1999 UNESCO
* Estimated population for 2000, # Reference year 1999, $ Reference year 2001
& Reference year 1994, @ Reference year 1997
Note: The area figures of India exclude area under illegal occupation of Pakistan and China.
The following chart shows the slow trend of public expenditure
on education as part of GDP in India during the period 1951-52
to 2001-2002:
50. SHANTANU BASU 50
4.02
4.5 3.8
4
2.92
3.5
3 2.25
2.5
1.52
2
1.5 0.64
1
0.5
0
1951-52 1961-62 971-72 1981-82 1991-92 2001-02
Source: Adapted from data available at www.education.nic.in
Another chart would show the growth of educational facilities in
India during the same period:
2000-01
1990-91
1980-81
1970-71
1960-61
1950-51
0% 20% 40% 60% 80% 100%
Primary Upper Primary + High Colleges Universities
Source: Adapted from data available at www.education.nic.in
Colonial rule introduced concepts of a modern state, economy
and an education system. By linking entrance and advancement
in government service to academic education, colonial rule
contributed to the legacy of an education system geared to
preserving the position and prerogatives of the more privileged
(Lall)63. In order to correct this and provide for more broad-