
Recomendados
Más contenido relacionado
La actualidad más candente
La actualidad más candente (20)
Similar a Pten jurado
Similar a Pten jurado (20)
Más de shiraknafo
Más de shiraknafo (10)
Pten jurado
- 1. The EMBO Journal (2010) 29, 2827–2840 |& 2010 European Molecular Biology Organization | All Rights Reserved 0261-4189/10 THE www.embojournal.org EMBO JOURNAL PTEN is recruited to the postsynaptic terminal for NMDA receptor-dependent long-term depression Sandra Jurado1,3, Marion Benoist2, (3,4,5,)-trisphosphate (PIP3) to generate phosphatiylinositol- Argentina Lario2, Shira Knafo2, (4,5)-bisphosphate (PIP2) (Maehama and Dixon, 1999). As a Cortney N Petrok1 and Jose A Esteban2,* ´ negative regulator of the PI3K-PIP3 pathway, PTEN restrains 1 cell proliferation and survival during embryogenesis. Department of Pharmacology, University of Michigan Medical School, Ann Arbor, MI, USA and 2Department of Neurobiology, Centro de Consistent with this developmental function, PTEN null ´ Biologıa Molecular ‘Severo Ochoa’, Consejo Superior de Investigaciones mice die during embryogenesis, whereas heterozygotes are ´ Cientıficas (CSIC), Madrid, Spain tumour prone and display enlargement of multiple organs (Stiles et al, 2004). Similarly, alterations in the function of Phosphatase and tensin homolog deleted on chromosome PTEN are of major relevance for the incidence of a wide ten (PTEN) is an important regulator of phosphatidylino- variety of human cancers (Li et al, 1997; Pendaries et al, sitol-(3,4,5,)-trisphosphate signalling, which controls cell 2003). growth and differentiation. However, PTEN is also highly In the central nervous system, PTEN is expressed in most, expressed in the adult brain, in which it can be found in if not all neurons. It is present in dendrites and spines of dendritic spines in hippocampus and other brain regions. cerebral cortex, cerebellum, hippocampus and olfactory bulb Here, we have investigated specific functions of PTEN in (Perandones et al, 2004). Mutation or inactivation of PTEN the regulation of synaptic function in excitatory hippo- contributes to brain tumours, macrocephaly, seizures and campal synapses. We found that NMDA receptor activation ataxia (Backman et al, 2001; Kwon et al, 2001; Eng, 2003). triggers a PDZ-dependent association between PTEN and PTEN mutations have been also associated with mental the synaptic scaffolding molecule PSD-95. This association retardation and autism spectrum disorders (Butler et al, is accompanied by PTEN localization at the postsynaptic 2005; Kwon et al, 2006). At the cellular level, neurons lacking density and anchoring within the spine. On the other PTEN develop larger and more branched dendrites, which hand, enhancement of PTEN lipid phosphatase activity harbour more synapses (Jaworski et al, 2005; Kwon et al, is able to drive depression of AMPA receptor-mediated 2006; Fraser et al, 2008). Therefore, it is likely that the synaptic responses. This activity is specifically required neurological deficits associated to PTEN mutations are for NMDA receptor-dependent long-term depression derived from aberrant neuronal growth and connectivity (LTD), but not for LTP or metabotropic glutamate receptor- during brain development. These widespread morphological dependent LTD. Therefore, these results reveal PTEN as a changes may also be the reason for the pleiotropic effects on regulated signalling molecule at the synapse, which synaptic function and plasticity that have been reported is recruited to the postsynaptic membrane upon NMDA for mice with reduced PTEN expression (Wang et al, 2006; receptor activation, and is required for the modulation of Fraser et al, 2008). synaptic activity during plasticity. Besides these developmental aspects, the PIP3 pathway has The EMBO Journal (2010) 29, 2827–2840. doi:10.1038/ specific functions at synapses in differentiated neurons. For emboj.2010.160; Published online 13 July 2010 example, acute blockade of PI3K, the PIP3 synthesizing Subject Categories: membranes & transport; neuroscience enzyme, has been shown to impair some forms of memory Keywords: AMPA receptors; hippocampus; LTD; NMDA formation (Chen et al, 2005) and long-term potentiation receptors; spines (LTP) in hippocampal slices (Sanna et al, 2002; Tang et al, 2002; Cammalleri et al, 2003; Opazo et al, 2003). The PIP3 pathway has also been linked to AMPAR trafficking (Qin et al, 2005) and synaptic localization (Arendt et al, 2010) in hippo- campal neurons. However, a specific function for PTEN in Introduction synaptic transmission or plasticity in developed neurons has Phosphatase and tensin homolog deleted on chromosome ten not been pinpointed yet. (PTEN; also known as MMAC1 or TEP1) was originally From a mechanistic point of view, PTEN possesses a PDZ- cloned as a tumour suppressor protein (Li et al, 1997; Steck binding motif at its C-terminus (residues Thr401-Lys402-Val403- et al, 1997). PTEN antagonizes phosphatidylinositosl-30 -kinase COOH), which interacts with multiple PDZ domain-containing (PI3K) signalling by dephosphorylating phosphatidylinositol- proteins, such as the scaffolding proteins MAGI-1/2/3, hDlg/ SAP97 and the Ser/Thr kinase MAST205 (Bonifant et al, *Corresponding author. Department of Neurobiology, Centro de 2007). The physiological consequences of these PDZ-depen- ´ Biologıa Molecular ‘Severo Ochoa’, Consejo Superior de Investigaciones dent interactions remain poorly characterized; however, it has ´ Cientıficas (CSIC), Nicolas Cabrera 1, Madrid 28049, Spain. Tel.: þ 34 91 196 4637; Fax: þ 34 01 196 4420; been shown that the binding of PTEN to specific PDZ domain- E-mail: jaesteban@cbm.uam.es containing proteins contributes to PTEN protein stability 3 Present address: Department of Psychiatry and Behavioral Science, (Valiente et al, 2005). Nevertheless, no interaction between Stanford School of Medicine, Palo Alto, CA 94304, USA PTEN and synaptic PDZ proteins has been reported yet. Received: 14 September 2009; accepted: 24 June 2010; published In this study, we have investigated specific functions of online: 13 July 2010 PTEN in synaptic plasticity, separate from its developmental & 2010 European Molecular Biology Organization The EMBO Journal VOL 29 | NO 16 | 2010 2827
- 2. PTEN is recruited to synapses for LTD S Jurado et al functions. In particular, we have found that NMDA receptor partner (the NMDA receptor) was not enhanced by this treat- activation triggers the association between PTEN and post- ment (Supplementary Figure 1, PTEN versus GluN1 panels). synaptic density-95 (PSD-95) through a PDZ-dependent inter- To further characterize the structural requirements of this action. This interaction leads to the recruitment and regulated association between PSD-95 and PTEN, we ex- anchoring of PTEN to the postsynaptic membrane, and pressed GFP-tagged PTEN in organotypic slice cultures of possibly mediates a specific function of PTEN in the expres- rat hippocampus for 15–20 h (GFP is fused to the N-terminus sion of long-term depression (LTD). These results have of PTEN). Confocal imaging of infected CA1 neurons showed revealed PTEN as a regulated component of the intracellular widespread distribution of GFP-PTEN, including distal den- signalling machinery that controls synaptic transmission and drites and spines (Figure 1F). Recombinant GFP-PTEN was plasticity at hippocampal excitatory synapses. functional, as evidenced from its ability to antagonize the PI3K/PIP3 pathway, leading to a decrease in Akt phospho- rylation at Ser473 (Stambolic et al, 1998) (Supplementary Results Figure 2A and B). Total protein extracts were prepared from NMDA receptor activation regulates a PDZ-dependent untreated slices or from slices treated with NMDA, AMPA or association between PTEN and PSD-95 KCl, as described above. Immunoprecipitations were carried As an initial step to evaluate potential functions of PTEN at out with an anti-GFP antibody, and the immunoprecipitated synapses, we tested its association with PSD-95, a critical fractions were analysed by western blot. As shown in regulator of synaptic function and plasticity (El-Husseini Figure 1G, PSD-95 was co-precipitated with GFP-PTEN only et al, 2000; Ehrlich and Malinow, 2004; Bhattacharyya et al, after NMDAR activation, but not after AMPA or KCl treat- 2009). To this end, we immunoprecipitated PTEN from total ment, similar to the results obtained with endogenous PTEN hippocampal extracts, and the presence of co-immunopreci- (Figure 1C). The kinetics of GFP-PTEN association with PSD- pitated proteins was analysed by western blot (see Materials 95 were also similar to the endogenous protein (Figure 1H, and methods). As shown in Figure 1A (upper panels, right panels; inputs for all conditions are shown in the left ‘Control’ lanes), there was a detectable association between panels). As control, cytosolic GFP did not co-immunopreci- PSD-95 and PTEN, which was specific, according to the pitate with PSD-95 with or without NMDA (Figure 1H). immunoprecipitation with a non-immune (‘n.i.’) antibody. Interestingly, the association between PSD-95 and PTEN PDZ-dependent interactions anchor PTEN at dendritic appeared to be regulated by activity, as it was increased spines upon NMDA receptor activation after 5 min bath application of 20 mM NMDA (Figure 1A, To determine whether the association between PTEN and compare ‘Control’ and ‘NMDA’ lanes), and this increase PSD-95 was PDZ dependent, we generated a PTEN mutant was abolished by incubation with the NMDAR antagonist lacking the last four amino acids, which contain the PDZ AP5 (Figure 1B, ‘NMDA þ AP5’ lanes). There was also a ligand motif (-ITKV*). We then carried out co-immunopreci- weak, but detectable, interaction between PTEN and MAGI- pitations from slices expressing GFP, full-length GFP-PTEN or 2, another PDZ protein known to associate with PTEN the truncated form of PTEN lacking its PDZ-binding motif (Wu et al, 2000). However, this interaction was not altered (GFP-PTEN-DPDZ) (see Supplementary Figure 2C for a wes- by NMDAR activation (Figure 1A, middle panels). tern blot analysis of the expression of this and other PTEN We then tested whether the association between PSD-95 derivatives used in this study). As shown in Figure 2A (upper and PTEN was specifically regulated by NMDAR activation or right panel), the association with PSD-95 was only detectable whether it could also be induced by other forms of neuronal with GFP-PTEN, but not with GFP-PTEN-DPDZ or cytosolic activation or depolarization. To this end, we compared the GFP, and only after NMDAR activation. This result confirms amount of PTEN-PSD-95 co-immunoprecipitation from slices that the association between PTEN and PSD-95 requires the incubated for 5 min with NMDA (20 mM), AMPA (100 mM) or PDZ motif at the PTEN C-terminus. KCl (50 mM). A control immunoprecipitation with an n.i. PSD-95 is a well-known synaptic scaffolding molecule that antibody was also carried out. Interestingly, the association organizes multiple signalling complexes at the synapse between PTEN and PSD-95 was only enhanced in slices (Sheng, 2001). Therefore, our biochemical results described treated with NMDA, but not with AMPA or KCl (Figure 1C, above suggest that PTEN may be recruited and anchored at right panel; total protein inputs for all conditions are shown synapses after NMDAR activation. To test this possibility, we in the left panel). To evaluate the time course of this associa- evaluated real-time dynamics of PTEN in dendritic spines tion, we carried out immunoprecipitations at different times using fluorescence recovery after photobleaching (FRAP; see after the 5 min incubation with NMDA. As shown in Figure fluorescence images from a representative experiment in 1D and E, the association between PTEN and PSD-95 persists Figure 2B). GFP-tagged PTEN was expressed in organotypic for a period of time after the end of NMDAR activation, hippocampal slices, and the NMDA treatment was carried out although it gradually declines by the end of the time course. as described above. Spines expressing GFP-PTEN were photo- It should also be pointed out that the fraction of PSD-95 bleached and the extent of fluorescence recovery was mea- associated with PTEN is rather low at all times: around 1% of sured before and after NMDAR activation (‘ þ 5’, ‘ þ 15’ and the total PSD-95 under basal conditions, roughly doubling ‘ þ 25’ min; for simplicity, the ‘ þ 15-min’ time point is only after NMDA induction (see quantification in Figure 1E). The shown in the summary Figure 2F). As shown in Figure 2C regulated association between PSD-95 and PTEN was also (white circles), approximately 50% of the GFP-PTEN signal is observed after immunoprecipitation of PSD-95 and detection recovered in the spine over a time course of 10–20 s, arguing of PTEN as a co-precipitated protein (Supplementary Figure that 50% of GFP-PTEN is stable in spines (over this period of 1). This regulation appears to be specific for PTEN, because time) under basal conditions. Intriguingly, GFP-PTEN fluore- the interaction of PSD-95 with another PDZ-dependent scence recovered to a significantly greater extent (around 2828 The EMBO Journal VOL 29 | NO 16 | 2010 & 2010 European Molecular Biology Organization
- 3. PTEN is recruited to synapses for LTD S Jurado et al A B Input IP PTEN Input n.i. IP PTEN + DA + DA NM l NM l DA DA ro tro 5 5 NM NM AP AP nt NM l Co l NM l n tro tro ro DA DA Co Co nt n n Co Co PSD95 PSD95 PTEN MAGI2 Input IP PTEN n.i. C ol ol ro l nt r DA PA l nt r DA PA l nt Co NM AM KC Co NM AM KC Co PTEN PSD95 D Input IP PTEN E NM ol NM l DA DA tro 2 Bound PSD95 r nt 0′ 5′ 0′ 5′ n (% input) Co Co +1 +2 +1 +2 1.5 PSD95 1 0.5 NMDA n=5 0 PTEN 0 5 +10 +25 * Time (min) F G Input IP GFP l l ro ro DA DA PA PA nt nt l l 20 m NM NM AM AM KC KC Co Co PSD95 2 m GFP- PTEN * H Input IP GFP GFP GFP-PTEN GFP GFP-PTEN Ctrl. NMDA +10′ Ctrl. NMDA +10′ Ctrl. NMDA +10′ Ctrl. NMDA +10′ PSD95 GFP-PTEN * GFP Figure 1 NMDA receptor-dependent association between PTEN and PSD-95. (A) Total protein extracts from hippocampal slices were immunoprecipitated with anti-PTEN or with a non-immune (‘n.i’) antibody (‘Control’ lanes). Some slices were treated with 20 mM NMDA for 5 min before the immunoprecipitation (‘NMDA’ lanes). For all western blots, immunoprecipitated proteins are shown in the right panels, and 10% of the inputs in the left panels. (B) Similar to (A), but some slices were preincubated with the NMDAR antagonist AP5 before and during the NMDA treatment (‘NMDA þ AP5’). (C) Similar to (A), with slices treated for 5 min with 20 mM NMDA, 100 mM AMPA, 50 mM KCl or left untreated (‘Control’), as indicated. (D) Similar to (A), with untreated slices (‘Control’), treated with 20 mM NMDA for 5 min (‘NMDA’) or transferred to regular ACSF for 10 min ( þ 100 ) or 25 min ( þ 250 ) after the NMDA treatment. Asterisk (*) indicates the position of the IgG used for immunoprecipitation. (E) Quantification of the fraction of PSD-95 co-precipitated with PTEN (as percentage from the total PSD-95 amount in the input), from five independent experiments as the one shown in (D). The 5 min NMDA treatment is represented with a black bar. (F) Representative confocal image showing the distribution of recombinant GFP-PTEN in soma, dendrites and spines in a hippocampal neuron from organotypic slice cultures. (G) Hippocampal slices expressing GFP-PTEN were treated for 5 min with 20 mM NMDA, 100 mM AMPA, 50 mM KCl or left untreated (‘Control’), as indicated. Total protein extracts were immunoprecipitated with anti-GFP and analysed by western blot with anti-PSD-95 (upper panels) or anti-GFP antibodies (lower panels). Asterisk (*) indicates the position of the IgG used for immunoprecipitation. (H) Hippocampal slices expressing GFP or GFP-PTEN, as indicated, were left untreated (‘Ctrl.’), or were treated with 20 mM NMDA for 5 min (‘NMDA’), or were transferred to regular ACSF for 10 min after the NMDA treatment ( þ 100 ). Total protein extracts were immunoprecipitated with anti-GFP and analysed as in (G). Asterisk (*) indicates the position of the IgG used for immunoprecipitation. 70%) 5 min after the NMDA treatment (Figure 2C, red cir- Figure 2C, dark red circles; Figure 2F), implying that a larger cles). This result indicates an increase in PTEN mobility fraction of PTEN is retained in spines in a long-lasting rapidly after NMDAR activation. In contrast, 20–30 min manner after NMDAR activation. after the NMDA treatment, the recovery of fluorescence of To test the function of PDZ interactions in this behaviour, GFP-PTEN in the spine was drastically reduced (around 20%; we carried out similar experiments with the truncated form of & 2010 European Molecular Biology Organization The EMBO Journal VOL 29 | NO 16 | 2010 2829
- 4. PTEN is recruited to synapses for LTD S Jurado et al A Input IP GFP Control + NMDA Control + NMDA PTEN PTEN PTEN PTEN GFP PTEN GFP PTEN GFP PTEN GFP PTEN -ΔPDZ -ΔPDZ -ΔPDZ -ΔPDZ PSD95 GFP-PTEN * GFP B Baseline Bleaching Rcovery 1 m C Bleach PTEN D Bleach PTEN- PDZ +5 min Normalized spine Normalized spine 1 1 fluorescence +25 min fluorescence 0.8 0.8 +5 min Baseline 0.6 0.6 Baseline 0.4 0.4 0.2 +25 min 0.2 0 0 0 10 20 30 40 0 10 20 30 40 Time (s) Time (s) E Bleach GFP F *P =0.03 1 GFP Recovery fraction 1 Normalized spine Baseline 0.8 +25 min fluorescence PTEN- 0.8 +5 min *P =0.04 P =0.05 ΔPDZ 0.6 *P = 0.03 0.6 0.4 0.4 0.2 0.2 PTEN NMDA *P =0.02 *P =0.02 0 0 0 1 2 3 4 0 5 +5 +15 +25 Time (s) Time (min) Figure 2 PDZ-dependent interactions and anchoring of PTEN in spines. (A) Coimmunoprecipitation experiments were similar to those in Figure 1H, with slices expressing GFP, GFP-PTEN or the PDZ truncated mutant GFP-PTEN-DPDZ. Slices were treated with 20 mM NMDA for 5 min (‘ þ NMDA’) or left untreated (‘Control’). Western blot is representative of three independent experiments. (B) Representative confocal images from an FRAP experiment. Left panel (‘baseline’) shows GFP-PTEN expression in a dendritic branch and its spines. A specific spine (white dashed circle) was bleached (‘bleaching’) and its fluorescence partially recovered 40 s later (‘recovery’). (C) Quantitative analysis of FRAP experiments as the one shown in (B). ‘Baseline’ (white symbols) represents FRAP experiments on GFP-PTEN-expressing slices perfused with ACSF (untreated). The perfusion solution was then switched to ACSF containing 20 mM NMDA; 5 min later, the slices were washed again with standard ACSF. Further FRAP images were acquired after 5, 15 and 25 min of ACSF wash (‘ þ 5 min’, red symbols; ‘ þ 25 min’, dark red symbols; the ‘ þ 15 min’ time courses are similar to the ‘ þ 25 min’ ones and are only represented in the summary plot in (F), for simplicity). GFP fluorescence in the spine was normalized to the fluorescence in the unbleached dendritic shaft to correct for ongoing bleaching during imaging. Average values±s.e.m. are plotted normalized to the baseline before bleaching. Number of spines analysed were 12 (‘baseline’), 8 (‘ þ 5 min’) and 9 (‘ þ 25 min’) (different spines are imaged at each time point). (D, E) Similar to (C), with slices expressing GFP-PTEN-DPDZ (D) or plain GFP (E). Number of spines analysed for GFP-PTEN-DPDZ were 7 at each time point, and for GFP 6 (‘baseline’), 5 (‘ þ 5 min’) and 5 (‘ þ 25 min’). (F) Recovery fractions from experiments shown in (C–E) were calculated from the fraction of fluorescence recovered 40 s (GFP- PTEN and GFP-PTEN-DPDZ) or 4 s (GFP) after photobleaching. These values are plotted for untreated slices (0 min) or at different times after the 5 min NMDA treatment (the ‘ þ 15 min’ is not plotted in panels (C–E) for simplicity). Average values±s.e.m. are plotted for GFP-PTEN (black symbols), GFP-PTEN-DPDZ (grey symbols) and GFP (white symbols). Statistical significance was calculated with respect to the recovery fractions before NMDA treatment. There was no significant difference in the case of GFP-expressing neurons. PTEN lacking the PDZ motif, GFP-PTEN-DPDZ. As shown in white circles—versus 90% 5 min after the NMDA treatment— Figure 2D, the extent of fluorescence recovery was also red circles). But in marked contrast with full-length PTEN, greater 5 min after NMDAR activation (60% at baseline— this increase in PTEN mobility was long lasting (20–30 min 2830 The EMBO Journal VOL 29 | NO 16 | 2010 & 2010 European Molecular Biology Organization
- 5. PTEN is recruited to synapses for LTD S Jurado et al after the NMDA treatment) and was never followed by an slightly decreased (GluN1 and aCaMKII) with this treatment, enhanced retention in spines (Figure 2D, dark red circles; ruling out potential artefacts because of non-specific protein Figure 2F). aggregation or precipitation. In conclusion, these experi- As a control for potential changes in fluorophore diffusion ments indicate that PTEN biochemically associates with the in spines as a result of NMDA application, we carried out PSD scaffold after NMDAR activation, in agreement with its similar NMDA-FRAP experiments in slices expressing GFP. As co-precipitation with the PSD-95 protein complex. shown in Figure 2E and F, fluorescence recovery was nearly complete for GFP and was not altered at any time point in Local redistribution of PTEN within dendritic spines response to the NMDA treatment. In addition, neither the in response to NMDAR activation rates of recovery nor the net distribution between spines and To directly visualize the recruitment of PTEN to the post- dendrites were significantly altered for any of the recombi- synaptic scaffold, we evaluated the ultrastructural localiza- nant proteins after the NMDA treatment (Supplementary tion of endogenous PTEN within dendritic spines before and Figure 3A and B, respectively). after NMDA treatment. PTEN has been described to be Therefore, we conclude that NMDAR activation triggers a present in axonal and dendritic compartments in hippocam- biphasic regulation of PTEN mobility in dendritic spines. pal neurons (Perandones et al, 2004), but the fine-scale First, there is a rapid and transient increase in mobility, distribution of PTEN in dendritic spines had never been which is independent from PDZ interactions. This phase is evaluated before. then followed by a longer-lasting and PDZ-dependent anchor- We characterized the ultrastructural distribution of endo- ing of PTEN at the spine (Figure 2F). genous PTEN in close proximity to synaptic sites using postembedding immunogold electron microscopy (see Biochemical association of PTEN with the PSD after Materials and methods; Figure 4A for representative micro- NMDA receptor activation graphs). Most synaptic PTEN immunolabelling was found in To further investigate the recruitment of PTEN to the post- the postsynaptic terminal (70% versus 30% presynaptic; synaptic machinery upon NMDAR activation, we evaluated Figure 4B). Within the postsynaptic compartment, PTEN its association with the PSD using standard fractionation labelling was predominantly located in the intracellular methods (Carlin et al, 1980). To this end, we isolated synapto- space of the spine (Figure 4B, ‘Intra’), outside of the PSD somal fractions from 3 to 4 weeks rats (see Supplementary and the extrasynaptic membrane (‘Extra’). data). NMDARs were then activated on the purified synapto- Remarkably, upon NMDAR activation (25 min after the somes by adding 20 mM NMDA and 10 mM glycine. After 5 min NMDA treatment), PTEN fraction in the PSD increased by incubation, NMDAR activation was stopped with AP-5 and six-fold, whereas the amount of PTEN in other synaptic synaptosomes were incubated for 10 min more to allow for compartments was not significantly affected (Figure 4B, PTEN stabilization. Then, the PSD fraction was isolated black columns; representative micrographs in Figure 4A). In as a Triton-insoluble pellet from treated and untreated addition, and consistent with this redistribution of PTEN into synaptosomes and was analysed by western blot (see the PSD, we observed a global shift in the population of PTEN Supplementary data). molecules towards the PSD (Figure 4C). As shown in Figure 3, the abundance of PTEN at the PSD Therefore, and in agreement with our biochemical and was significantly enhanced (two-fold) on the synaptosomes fluorescence imaging data, these data confirm that endogen- treated with NMDA plus glycine. The PSD enrichment of ous PTEN redistributes to the postsynaptic membrane in other postsynaptic markers was not altered (PSD-95) or was response to NMDAR activation. A PSD DA DA DA DA t. p M M M M na N N N N Sy B *P = 0.01 + + – – (n =10) PTEN 3 Normalized PSD enrichment 40 PSD95 2 P = 0.5 *P = 0.03 *P = 0.03 (n =10) (n =6) (n =6) 100 GluN1 1 100 0 αCaMKII – + – + – + – + NMDA 40 PTEN PSD95 GluN1 αCaMKII Figure 3 Enrichment of PTEN at the postsynaptic density fraction after NMDA receptor activation. (A) Representative western blot analysis of PSD fractionations from synaptosomal preparations after NMDA receptor activation (‘ þ NMDA’) or untreated controls (‘ÀNMDA’). A duplicate of separately treated or untreated samples is presented. The starting material (synaptosomal fraction) is shown in the left lane. (B) Quantification of PSD enrichment in NMDA-treated samples normalized to the untreated controls, from experiments as the one shown in (A); ‘n’ represents number of independent experiments. Statistical significance was determined according to the Wilcoxon’s test for pairs of treated–untreated samples. & 2010 European Molecular Biology Organization The EMBO Journal VOL 29 | NO 16 | 2010 2831
- 6. PTEN is recruited to synapses for LTD S Jurado et al Enhancement of PTEN activity depresses AMPA this configuration, the recombinant proteins are always ex- receptor-mediated synaptic transmission pressed exclusively in the postsynaptic neuron). As shown in As an initial step to examine PTEN function in synaptic Figure 5A–C, PTEN overexpression produced a significant transmission, we overexpressed wild-type GFP-PTEN or a depression of AMPAR-mediated currents as compared with catalytically dead mutant (GFP-PTEN-C124S) in CA1 neurons uninfected cells, whereas NMDAR responses remained un- from organotypic slice cultures. Importantly, expression of changed. In contrast, the catalytically dead mutant, PTEN- this mutant produced an increase in phospho-Akt over basal C124S, did not alter AMPAR- or NMDAR-mediated transmis- levels (Supplementary Figure 2A and B), indicating that this sion (Figure 5D–F). This result verifies that the catalytic construct behaves as a dominant negative against endogen- activity of PTEN is required for the depression of AMPAR- ous PTEN activity in neurons, as it has been described earlier mediated transmission and that this is not due to virus in other cell types (Maehama and Dixon, 1998). infection or non-specific sequestration of regulatory proteins. The effect of GFP-PTEN and GFP-PTEN-C124S on synaptic Importantly, passive membrane properties, such as input transmission was evaluated by simultaneous double whole- resistance and holding current (related to basal ionic con- cell recordings from pairs of nearby infected and uninfected ductances), and whole-cell capacitance (related to cell size) CA1 neurons, under voltage-clamp configuration, while sti- were also similar in control and in PTEN-overexpressing mulating presynaptic Schaffer collateral fibres (to note, under neurons (Supplementary Figure 4). Intriguingly, the depression of AMPAR responses produced by overexpression of PTEN was observed for basal synaptic A transmission, that is conditions under which PTEN is not * * * normally recruited to the postsynaptic membrane (earlier Baseline biochemical and imaging experiments). One possible expla- nation is that overexpressed PTEN is able to reach the postsynaptic membrane in the absence of its regulated asso- 100 nm ciation with PDZ proteins at the postsynaptic scaffold. To test this possibility, we carried out similar recordings with neu- rons overexpressing the truncated PTEN mutant lacking the * * * * PDZ motif (PTEN-DPDZ). As shown in Figure 5G–I, over- +25 min expressed PTEN was able to depress AMPAR responses in the absence of PDZ-dependent interactions. This depression was 100 nm still specific for AMPARs, as compared with NMDARs. Therefore, although the recruitment of PTEN to the synaptic B POST PRE scaffold requires NMDAR activation and PDZ-dependent 60 interactions, these requirements can be overcome by over- expression of the recombinant protein. 50 Baseline (n =73) The depression of basal synaptic responses produced by % Immunogold/synapse + 25 min (n=65) PTEN might be a consequence of an abnormal cycling of 40 30 **P = 0.001 Figure 4 Local redistribution of PTEN to the postsynaptic density after NMDA receptor activation. (A) Representative micrographs of 20 CA1 stratum radiatum excitatory synapses after postembedding labelling with anti-PTEN immunogold (arrows). Presynaptic term- 10 inal is marked with an asterisk (*). Note accumulation of PTEN labelling at the PSD after 5 min NMDA treatment and 25 min recovery in ACSF (‘ þ 25 min’), with respect to untreated slices 0 (‘Baseline’). (B) Quantification of PTEN immunogold labelling at PSD Extra Intra different compartments from electron micrographs as the ones shown in (A). ‘PRE’: presynaptic terminal; ‘POST’: postsynaptic C +25 min terminal; ‘PSD’: postsynaptic density; ‘Extra’: perisynaptic mem- PSD (n =203) brane lateral from the PSD; ‘Intra’: intracellular space within the 1 **P= 0.001 spine. Percentage of immunogold labelling per synapse was calcu- lated as the number of gold particles at each compartment divided 0.8 by the total number of gold particles in each synaptic terminal (only Cumulative probability Baseline gold particles within 1 mm of the synaptic membrane were used for (n =273) this analysis). Average values±s.e.m. are plotted for untreated 0.6 slices (‘Baseline’, white columns) or for slices treated for 5 min with NMDA and recovered for 25 min in ACSF (‘ þ 25 min’, black columns); ‘n’ represents number of synaptic terminals. Statistical 0.4 significance was calculated according to the Mann–Whitney test. (C) Quantification of PTEN distribution within the spine. The distance to the synaptic cleft was calculated for each immunogold 0.2 particle before (‘Baseline’, black line) or after NMDA treatment (‘ þ 25 min’, grey line), and plotted as cumulative distributions. The 0 average thickness of the PSD from our micrographs (37 nm) is 0 100 200 300 400 500 indicated in the plot as a vertical grey bar; ‘n’ represents number Distance from synaptic cleft (nm) of gold particles. Statistical significance was calculated according to the Kolmogorov–Smirnov test. 2832 The EMBO Journal VOL 29 | NO 16 | 2010 & 2010 European Molecular Biology Organization
- 7. PTEN is recruited to synapses for LTD S Jurado et al A B P = 0.03, n =14 C P = 0.5, n =9 Uninf. PTEN 80 30 NMDA EPSC (pA) AMPA EPSC (pA) 60 ** 20 40 20 pA 10 20 20 ms 0 0 Uninf PTEN Uninf PTEN D Uninf. PTEN- E F 80 P = 0.7, n =32 P = 0.1, n =28 C124S 30 NMDA EPSC (pA) AMPA EPSC (pA) 60 20 40 10 20 20 pA 0 0 20 ms PTEN- PTEN- Uninf Uninf C124S C124S G Uninf. PTEN- H I ΔPDZ P = 0.03, n =27 35 P = 0.15, n =25 60 NMDA EPSC (pA) AMPA EPSC (pA) 50 30 25 40 20 30 ** 15 20 10 20 pA 10 5 0 0 20 ms PTEN- PTEN- Uninf Uninf ΔPDZ ΔPDZ J Uninf. (n =8) PTEN (n =9) K Uninf. (n =15) PTEN (n =13) 20 pA 10 pA 2 20 pA 20 ms 50 ms 50 ms PPF (EPSC2/EPSC1) 1 Normalized EPSC 1.5 0.5 pep2m 1 0 0 10 20 30 40 0 100 200 300 400 Time (min) Interstimulus interval (ms) Figure 5 Effects of GFP-PTEN expression on synaptic transmission. (A) Sample traces of evoked AMPAR- and NMDAR-mediated synaptic responses recorded at À60 or þ 40 mV, respectively, from CA1 neurons expressing GFP-PTEN and neighbouring control (uninfected) neurons. (B) Average AMPAR-mediated current amplitude (peak of the synaptic response recorded at À60 mV) from pairs of uninfected and GFP-PTEN- expressing neurons. For (B, C, E, F, H, I),‘n’ represents number of pairs of cells, and statistical significance was determined with the Wilcoxon’s test for paired data. (C) Average NMDAR-mediated current amplitude (recorded at þ 40 mV and measured at a latency of 60 ms) from pairs of uninfected and GFP-PTEN-expressing neurons. (D–F) Similar to (A–C), with infected neurons expressing GFP-PTEN-C124S. (G–I) Similar to (A–C), with infected neurons expressing GFP-PTEN-DPDZ. (J) Time course of AMPAR-mediated synaptic responses recorded from CA1 neurons expressing GFP-PTEN or from control (uninfected) neurons, during whole-cell pipette infusion of the GluA2-NSF interfering peptide (pep2 m). Response amplitude is normalized to a 2 min baseline from the beginning of the recording; ‘n’ represents number of cells. Inset: sample traces averaged from the first 5 min of the recording (thin lines) or from the last 5 min of the time course (thick lines). (K) Paired-pulse facilitation (PPF) recorded from control (uninfected) neurons or from neurons expressing GFP-PTEN. PPF is calculated as the ratio of the amplitude of the second response versus that of the first one; ‘n’ represents number of cells. Inset: representative traces of evoked AMAR- mediated responses with an interstimulus interval of 200 ms. AMPARs at synapses. AMPARs are believed to cycle continu- a peptide containing the NSF-binding sequence of GluA2 ously in and out of synapses in an activity-independent (pep2m/G10), AMPAR-mediated synaptic transmission manner, which depends on the interaction between the rapidly ‘runs down’ as the receptors continue to be inter- GluA2 subunit (also known as GluR2;Collingridge et al, nalized, but fail to be reinserted at the synaptic membrane 2009) and NSF (N-ethylmaleimide-sensitive fusion protein) (Nishimune et al, 1998; Luscher et al, 1999). We have used (Nishimune et al, 1998; Song et al, 1998; Luscher et al, 1999). the same approach to determine whether PTEN affects the When this interaction is impaired by intracellular infusion of constitutive cycling of AMPA receptors. To this end, we & 2010 European Molecular Biology Organization The EMBO Journal VOL 29 | NO 16 | 2010 2833
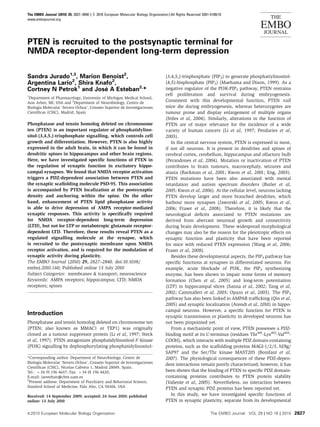
- 8. PTEN is recruited to synapses for LTD S Jurado et al recorded AMPAR-mediated synaptic responses from CA1 PTEN activity is required for NMDA receptor-dependent hippocampal neurons infected with PTEN, whereas infusing LTD them with the GluA2-NSF peptide pep2m/G10. The peptide The depression of AMPAR responses as a consequence of produced a fast ‘run-down’ of synaptic transmission in the PTEN overexpression led us to think that this phosphatase uninfected cells (Figure 5J, white symbols), as expected. This may have a function in long-lasting changes of synaptic ‘run-down’ was virtually identical in the cells expressing strength, and particularly, in LTD. In addition, the NMDA PTEN (Figure 5J, black symbols), indicating that PTEN treatments that we found to regulate the association of PTEN activity does not alter the continuous cycling of AMPARs. with postsynaptic elements (Figures 1 and 3) and its redis- Although PTEN was expressed in postsynaptic CA1 neu- tribution in spines (Figures 2 and 4) are known to lead to rons, we examined whether presynaptic properties may have synaptic depression (Lee et al, 1998). been altered retrogradely (Regalado et al, 2006; Futai et al, To directly test a potential function of PTEN in LTD in 2007). As shown in Figure 5K, paired-pulse facilitation (PPF), hippocampal slices, we used a bis-peroxivanadium deriva- an indicator of presynaptic function, was unaltered by PTEN tive, bpV(HO)pic, which has been shown to specifically overexpression. inhibit PTEN when used at a low nanomolar concentrations The PIP3 pathway is also involved in the regulation of gene (Schmid et al, 2004) (see Supplementary Figure 6 for a test of expression (Brunet et al, 2001). Nevertheless, overnight over- bpV(HO)pic specificity). LTD was induced on control or on expression of PTEN did not affect the expression levels of bpV(HO)pic-pretreated slices by pairing presynaptic stimula- GluA1 and GluA2 subunits of AMPA receptors, or their tion (1 Hz, 500 pulses) with moderate postsynaptic depolari- phosphorylation state (phospho-Ser 831 and 845 for GluA1, zation (À40 mV). Interestingly, when compared with control and phospho-Ser 880 for GluA2; Supplementary Figure 5). cells, inhibition of PTEN with bpV(HO)pic greatly reduced Therefore, these combined data strongly suggest that the magnitude of LTD (Figure 6A and D), suggesting that PTEN has a specific postsynaptic function at excitatory PTEN activity is necessary for LTD in CA1 hippocampal hippocampal synapses. synapses (bpv(HO)pic did not have significant effect on the A Control bpV(HO)pic B Control PTEN-C124S (n =5) (n =7) (n =5) (n =7) 20 pA 20 pA 20 ms 20 ms 1 Normalized EPSC Normalized EPSC 1 0.8 0.8 0.6 0.6 0.4 0.4 0.2 0.2 1 Hz 1 Hz 0 0 –10 0 10 20 30 40 –10 0 10 20 30 40 50 Time (min) Time (min) C Control PTEN-G129E D *P =0.04 (n =4) (n =8) 1.2 *P =0.03 Normalized response *P =0.04 20 pA 1 20 ms 0.8 1 Normalized EPSC 0.6 0.8 0.4 0.6 0.2 0.4 0 inf pV f 0.2 4S 9E nin bpV 24S 29E 1 Hz Un b C12 G12 U C1 G1 0 –10 0 10 20 30 40 LTD (paired) Control (unpaired) Time (min) Figure 6 PTEN lipid phosphatase activity is required for LTD. (A–C) LTD was induced in CA1 hippocampal neurons pretreated with the PTEN inhibitor bpV(HO)pic (A) or expressing the PTEN point mutants C124S (B) or G129E (C). The results from control neurons (uninfected or untreated) were carried out in an interleaved manner with their corresponding infected or treated neurons. Amplitude of the synaptic responses is normalized to a 10 min baseline. Insets: sample traces averaged from the baseline (thin lines) or from the last 10 min of the recording (thick lines). (D) Average of AMPAR-mediated responses collected from the last 10 min of the recording and normalized to the baseline. Left columns (LTD, paired) correspond to the stimulation pathway in which postsynaptic depolarization (À40 mV) was paired to low-frequency stimulation (1 Hz). Right columns (control, unpaired) correspond to the pathway that was not stimulated during depolarization; ‘n’ represents number of cells. 2834 The EMBO Journal VOL 29 | NO 16 | 2010 & 2010 European Molecular Biology Organization
- 9. PTEN is recruited to synapses for LTD S Jurado et al control pathway—Figure 6D—or on basal synaptic transmis- of 100 mM AP5 (NMDAR antagonist) (see Materials and sion—not shown). Similar blockade of LTD expression was methods). As shown in Figure 7D and F, neurons expressing observed when the PTEN inhibitor was applied only during the catalytically dead PTEN-C124S displayed similar depres- the time of LTD induction (see Supplementary Figure 7). sion to the control, uninfected neurons. Again, identical As an alternative approach to test the function of PTEN in results were obtained when blocking PTEN activity pharma- LTD, we carried out similar experiments with neurons cologically (Figure 7E and F). Therefore, we conclude that expressing the catalytically dead mutant PTEN-C124S. It PTEN is not required for mGluR-dependent LTD in CA1 is important to keep in mind that this mutant did not have neurons. any effect on basal AMPAR- or NMDAR-mediated transmis- sion (Figure 5D–F). Interestingly, PTEN-C124S displayed a Involvement of PDZ-dependent interactions of PTEN dominant negative effect on LTD. That is, PTEN-C124S during NMDAR-dependent LTD expression blocked LTD to a similar extent as the PTEN Our electrophysiological data shown above indicate that inhibitor (Figure 6B and D). PTEN activity is specifically required for NMDAR-dependent PTEN is known to have both lipid and protein phosphatase LTD, but not for basal synaptic transmission or other forms of activity, as well as phosphatase-independent functions synaptic plasticity. In part, these conclusions are based on the (Tamguney and Stokoe, 2007). To test whether the function observation that catalytically inactive forms of PTEN have a of PTEN in LTD was specifically dependent on its PIP3- dominant negative effect on endogenous PTEN to block phosphatase activity, we used a lipid phosphatase PTEN NMDAR-dependent LTD (Figure 6B and C). In other words, mutant that retains its protein phosphatase activity: these PTEN mutants appear to be competing with endogen- PTEN-G129E (Myers et al, 1998). Similar to our results with ous PTEN for some important interaction required for LTD. PTEN-C124S, neurons expressing PTEN-G129E did not An obvious candidate for this interaction is the PDZ motif at undergo long-lasting depression (Figure 6C and D). Taken the C-terminus of PTEN, which we have found to mediate the together, these pharmacological and genetic approaches anchoring of PTEN in the spine and its association with PSD- indicate that PTEN lipid phosphatase activity is required for 95 upon NMDAR activation (Figure 2). LTD in CA1 hippocampal synapses. To investigate whether PDZ-dependent interactions of To further explore the function of PTEN in synaptic depres- PTEN are important for its function in LTD, we tested sion, we evaluated LTD in neurons overexpressing wild-type whether the dominant negative effect of PTEN-C124S re- PTEN. As shown in Supplementary Figure 8, PTEN over- quires its PDZ C-terminal motif. To this end, we generated a expression did not alter LTD expression. Taking into account catalytically dead mutant (C124S) lacking the PDZ ligand that PTEN-overexpressing neurons display reduced AMPAR- motif (-ITKV*). This mutant (PTEN-C124S-DPDZ) did not mediated synaptic transmission under basal conditions affect basal synaptic transmission mediated by AMPA or (Figure 5A and B), these data suggest either that PTEN- NMDA receptors (Figure 8A–C), consistent with the results induced depression does not saturate subsequent LTD with PTEN-C124S (Figure 5D–F). Then, we carried out LTD expression, or, alternatively, that overexpressed PTEN acts experiments in CA1 neurons expressing this truncated, cata- on a different pool of AMPARs from those removed during lytically dead mutant. Interestingly, neurons expressing synaptically induced LTD. PTEN-C124S-DPDZ displayed normal LTD, undistinguishable from uninfected cells (Figure 8D and E). Therefore, these PTEN is neither required for LTP nor for metabotropic results suggest that the C-terminal PDZ-binding motif of glutamate receptor-dependent LTD PTEN is necessary for its function in LTD. After having established the importance of PTEN for LTD, we wished to investigate whether PTEN activity is required for LTP, another paradigmatic form of NMDAR-dependent synap- tic plasticity. To this end, we evaluated the effect of the Discussion catalytically dead mutant, PTEN-C124S, on LTP in CA1 In this study, we show that the lipid phosphatase PTEN, hippocampal neurons. LTP was induced on infected and typically associated with cell growth and proliferation, is uninfected CA1 neurons by pairing presynaptic stimulation recruited to synapses and is required for the expression of (3 Hz, 300 pulses) with postsynaptic depolarization (0 mV). NMDAR-dependent LTD. This is based on three main lines of As shown in Figure 7A and C, no significant difference was evidence. First, using electrophysiological assays on hippo- found between uninfected (control) and infected (PTEN- campal slices, we have determined that enhancement of C124S-expressing) neurons. PTEN-C124S did not have any PTEN activity is sufficient to depress AMPAR-mediated sy- effect on the non-potentiated (unpaired) pathway either naptic transmission, and that PTEN lipid phosphatase activity (Figure 7C). Virtually identical results were obtained with is specifically required for NMDAR-dependent LTD. Second, the specific PTEN inhibitor bpV(HO)pic (Figure 7B and C). a combination of live imaging, electron microscopy and Therefore, these data indicate that PTEN is required specifi- biochemical assays indicate that NMDAR activation triggers cally for LTD, and not for other forms of NMDAR-dependent a PDZ-dependent association between PTEN and the synaptic synaptic plasticity. scaffold, which anchors PTEN at the postsynaptic terminal. In addition, we tested whether PTEN would be required for And third, this PDZ-dependent interaction appears to be another prominent form of LTD in CA1 hippocampal sy- involved in PTEN’s action during LTD, as a dominant nega- napses, which is dependent on the activation of metabotropic tive mutant of PTEN is ineffective when lacking its PDZ glutamate receptors (mGluRs) (Oliet et al, 1997; Palmer et al, motif. These combined results reveal PTEN as a regulated 1997). mGluR-dependent LTD was induced by bath applica- signalling molecule at synapses, which is recruited to the tion of 50 mM DHPG (group I mGluR agonist) in the presence postsynaptic membrane in an activity-dependent manner and & 2010 European Molecular Biology Organization The EMBO Journal VOL 29 | NO 16 | 2010 2835