Low Soo Peng Economics in Theories
•Descargar como PPTX, PDF•
1 recomendación•542 vistas

Low Soo Peng Economics in Theories

Recomendados
Más contenido relacionado
La actualidad más candente
La actualidad más candente (19)
Destacado
Destacado (20)
Similar a Low Soo Peng Economics in Theories
Similar a Low Soo Peng Economics in Theories (20)
Más de Soo Peng Charles Low
Último
Último (20)
Low Soo Peng Economics in Theories
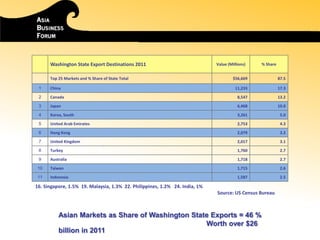
- 1. Washington State Export Destinations 2011 Value (Millions) % Share Top 25 Markets and % Share of State Total $56,669 87.5 1 China 11,233 17.3 2 Canada 8,547 13.2 3 Japan 6,468 10.0 4 Korea, South 3,261 5.0 5 United Arab Emirates 2,753 4.3 6 Hong Kong 2,079 3.2 7 United Kingdom 2,017 3.1 8 Turkey 1,760 2.7 9 Australia 1,718 2.7 10 Taiwan 1,715 2.6 11 Indonesia 1,587 2.5 Asian Markets as Share of Washington State Exports = 46 % Worth over $26 billion in 2011 16. Singapore, 1.5% 19. Malaysia, 1.3% 22. Philippines, 1.2% 24. India, 1% Source: US Census Bureau
- 2. CHINA – 2012 IN REVIEW Leadership Transition Slowing economic growth Local government debt situation Falling real estate prices Debt problems, slower growth, weak export demand Increased outbound investment Continued friction in the South China Sea
- 3. CHINA – 2012 ECONOMIC GROWTH
- 4. NEW POLITBURO STANDING COMMITTEE President Xi Jinping Premier Li Keqiang Zhang Dejiang Yu Zhengsheng Liu Yunshang Wang Qishan Zhang Gaoli
- 5. CHINA – 2013 OUTLOOK Economic growth stable Exports remain depressed Real estate prices declining Debt problems slow growth Continued emphasis on innovation Increased outbound investment
- 6. OVERALL SLOWING ECONOMIC GROWTH -1 0 1 2 3 4 5 6 7 8 Optimistic Base Pessimistic Optimistic Base Pessimistic Total FactorProductivity Capital Contribution LaborComposition LaborQuantity Percentgrowth, y-o-y Sources: The ConferenceBoard Global Economic Outlook 2013,https://www.conference-board.org/data/globaloutlook.cfm? 2013-2018 2019-2025
- 7. CHINA – GROWTH AREAS IN 2013 Planning for Demographic changes Renewable energy Online retailing Infrastructure Construction / real estate Pollution mitigation and control Clean and green food products + investment in overseas agriculture Expanded acquisition of overseas
- 8. CHINA – 2013 RISK FACTORS Diaoyutai / Senkaku Conflict Pollution Corruption & Anti-corruption efforts Rising costs Economic inequality Bankruptcy of some smaller cities Growth of unregulated lending sector
- 9. INDONESIA’S PERFORMANCE: 2012 IN REVIEW Source: Bank of Indonesia
- 10. 2012 HIGHLIGHTS Indonesia Financial Services Authority (OJK) formed Moody’s upgrades sovereign credit rating to investment grade: Baa3 from Ba1 (Outlook: Stable) Central Bank lowers BI rate to 5.75% (from 6%) Largest contract in commercial & Boeing history: Lion Air order of 230 Boeing 737 airplanes worth $22.4 billion Garuda named “Best International Airline” Foreign exchange reserves hits highest level (2012) of $114.93 billion S&P affirms sovereign credit rating at BB+ (Outlook: Positive) Jakarta elects new Governor Joko (Jokowi) Widodo (snubs political establishment) McKinsey releases “Unleashing Indonesia’s Potential Report”: Now 16th. 2030, could be world’s 7th largest economy, surpassing Germany & UK) Indonesia tops Nielson Global Consumer Confidence Survey (Q3 2012) with score of 119, (alongside India). Fitch affirmed sovereign credit rating at BBB- (Outlook: Stable) Indonesia, as next APEC Chair, announces 2013 logo & theme: Resilient Asia- Pacific – Engine of Global Growth January January 18 January February February April April 23 September September November November 21 December
- 11. GOOD BUT LOWER PERFORMANCE: WHY? • Crisis in Europe & recession in US • Instability in Middle East & Africa • Slower economic growth in emerging countries esp. China & India • Trade imbalance with declining exports (& burgeoning imports) Global economic uncertainty • Overburdened airports: Jakarta’s CGK at beyond capacity past 6 years • Poor condition of ports: Unable to keep up with economic growth • Bad roadways, bad traffic; floods • Poor connectivity between towns/cities/regions • Policies & regulations deemed as hindrance to businesses Weak infrastructure & high logistics costs Government initiatives Strong domestic consumption driven by emerging middle class Influx of investments • Master Plan MP3EI (2011- 2025): Economic development • Master Plan MP3KI (2011- 2025): Poverty reduction • Tax incentives • Highest contributor to economy: ≅ 2/3 of GDP • 240 million (World’s 4th most populous nation) • 45 million consuming class (to to 135 million in 2030) • Robust consumer confidence with surge in government & private sector projects • Second biggest contributor: ≅ 30% of GDP • Regaining of investment grade: Fitch in Dec. 2011 & Moody’s in Jan. 2012 • AT Kearney FDICI: Ranked #9 in the world (from 19 in 2010) • 2012 realization may top $31 billion (Rp. 300 trillion), a record
- 12. OUTLOOK FOR 2013 POSITIVE Annual GDP growth target set at 6.8 % (BI forecast: 6.3% - 6.8%) Domestic consumer demand 65% of GDP = less vulnerable to Europe & US drag Fitch: Affirmed RI’s investment grade at BBB- (stable outlook); boost joining BRICS Investment realization targeted to increase to Rp. 390.3 trillion (FDI $29 billion) Household consumption (to 5.8 – 6.3%) & investment (to 10%) will continue to drive growth Govt set inflation rate assumption at 3.5% - 5.5% Government to hold BI rate steady at 5.75% (since March 2012) Per capita income rising & middle class growing (to expand to > ½ total population) Oil & gas investment to increase: $26.2 billion: 274 work plans & budgets approved Exploding gas demand = efforts to reduce exports + expand downstream capacity Sales of capital goods, including machine tools, will rise 8% to $27 billion
- 13. RISKS & CONCERNS Endemic corruption/Judiciary a problem: 118 in list of 176 countries (Transparency International) Rising inflation from domestic fuel subsidies & power tariff hike Weak institutions & bureaucratic inefficiencies: 128 out of 185 globally (World Bank’s Doing Business) Political uncertainty: 2014 elections Infrastructure congested & inadequate to support growth; respond to natural disasters Lack of institutions with strong capital structure to finance planned projects Crisis in developed world: Threaten exports, foreign liquidity, investment growth Emerging trend of trade deficits fueling current account deficits & hurting the Rupiah Under-developed HR: Low-skilled workforce + Minimum pay increase not matched with increase in productivity
- 14. REASONS TO BE OPTIMISTIC + OPPORTUNITIES Master plans to guide development & growth: Impetus for change Relative political & economic stability: Conducive to business Strong & growing domestic demand: Fuel growth, limit exposure to external shocks Poverty reduction means growing middle class Growing middle class means better qualified workforce & bigger market Positive investment outlook thanks to strong economic fundamentals Abundance of fertile land & natural resources Financial markets poised for volatility: Stock market to maintain good performance Financial stability: Investor confidence evident in influx of capital investment
- 15. PUBLIC DEBT BURDENS (% OF GDP)
- 16. AT KEARNEY 2012 FDICI
Notas del editor
- The chart shows The Conference Board’s (TCB) most recent medium- and long-term projections for trend growth in real GDP for China, broken down by contributions from labor, capital and productivity. In our baseline scenario, China will grow at an average 5.5 percent over the next six years and slow further to an average 3.7 percent from 2019-2025. While one percentage point of the slowdown will occur due to slower growth in capital formation, the bulk of the slowdown will emanate from reduced total factor productivity, or said another way, the economy’s overall efficiency. The projection is based on assumptions about the reasonable utilization of China’s factor endowments; it does not factor in potential shocks or innovation influences that could see growth go down or up, respectively. Two important observations jump out from our growth estimates. The first, and most obvious, is that our medium-term projection is much lower than many current forecasts. However, accepting a slowing growth rate is a major precondition for moving China onto a more sustainable growth path. Therefore, we do not consider our projection “bearish,” per se. Rather how China slows, and how far, depends largely on the policy set introduced by China’s leadership. The second observation to note is that China has not yet reached a “new normal” for growth. That phrase is generally used to imply that growth has experienced a one-off downshift, from the average 10 percent of the past twenty years, to 7 or 8 percent for the foreseeable future. In contrast, TCB expects an ongoing, gradual deceleration in growth over the next decade, as the economy matures and transitions to services growth that is by nature less productive than manufacturing. The improvement in the high-frequency data over the last two months may obfuscate the underlying trends unfolding in the economy. First, a large portion of export demand has simply vanished. Export growth averaged 23 percent over the past 10 years. This year it has averaged 8.3 percent and is unlikely to rebound to previous rates, as advanced economies continue to see slower growth, and as China’s manufacturing competitiveness is challenged by rising costs and increasing competition. Secondly, returns to capital have slowed to a pace more indicative of an advanced economy than an emerging market. TCB estimates that China’s marginal product of capital has declined rapidly in recent years, and is much lower than other economies at its development level. From a structural standpoint, China’s economy is still under-invested, but the pace of investment will have to slow. This dynamic has been borne out in 2012, as fixed asset investment in the manufacturing sector has slowed to 23.1 percent y-o-y, from a 31.9 percent average over the previous 8 years.Slower growth need not be alarming, nor necessarily painful – but this all depends on the policy response of China’s new leadership. The first choice China faces is to rationalize inefficient formal credit markets and potentially unstable informal credit markets. Weaning the economy off its current leverage addiction is a necessary step – with corporate debt close to 130 percent of GDP and overall government debt near 70 percent (based on conservative estimates) – toward more sustainable growth. The “speed limit” of China’s economy is decelerating, and the road ahead is windy. History indicates that it is better to ride the brake and maintain control. © 2012 by The Conference Board, Inc. All rights reserved. The Conference Board® and the torch logo are registered trademarks of The Conference Board, Inc.
- GDP for 2012 expected to grow 6.3%. Target: 6.2% - 6.7%.Inflation: Remains low, 4.3%. Target: 4.5% ±B/P: Surplus in spite of pressures on C/A deficit (affected by lower demand from China; 2.4% of GDP in 2012)Supported by increasing direct & portfolio investment. = International reserves at end Dec. 2012 reached $112.8 b (equivalent to 6.1 months of imports &govt external debt services.Fiscal deficit: More of a problem than 2011. Prime culprit: energy subsidyDebt to GDP ratio: Indonesia & India only emerging countries to have shrunk public debt (between 2007 & 2011). - Even lower in 2012 at 23.3%.
- OJK:OtoritasJasaKeuanganAfter 14 years, Indonesia regains investment grade at Moody’s for the first time since Asian financial crisis. = Brings Indonesia to lowest investment grade (Baa3), same level as India. Indonesians stole limelight at S’pore Air Show. Option for 150 more aircraft ($14b). Total value: $36 billion.= > 100k US jobs.- 1st delivery 2017; the rest until 2025. Sale will be paid of over 12 years. - Lion Air: Leading airline with about 40% share of the mkt.- Domestic travel has grown 20% in recent years; mkt expected to dbl in next 5 years, reach 100mNote re: Indonesian aviationJakarta surpassed S’pore& BKK to become SE Asia’s busiest airport (by passenger traffic).For 12 mths ending Sept 2010, CGK recorded 42.5 m passenger movements to become world’s 16th busiest airport. 43.7 m passengers in 2010; 18% average yearly growth. To expand capacity: 60 m by 2016.Jokowi:- Voted 2012 3rdBest Mayor in the World by City Mayors FoundationMcKinsey:- Also surpassing BRICS nations India, Russia, Brazil…Nielson:- Went down 1pt; was at 120 (India: no change).
- 1. Vulnerable to shocks Slower growth esp. compared with 2 years ago (esp. India: from 9% to 5.5 – 6%)2.Soekarno-Hatta: > 51m passengers/year, over double designed capacity Cements costs 10x more on outer islands than Jkt after traveling through antiquated port system. 2010 World Bank Logistics Performance Index (LPI): Indonesia 75 out of 150 countries surveyed Logistic costs: 25 – 30%. M’sia: 15%, US & Japan: 10%, Thailand 16% Cost of shipping from regions to capital = local fruits more expensive than imported from China3. MP3EI: Acceleration & Expansion of Economic Development= Aims to be one of world’s biggest economies by 2025) MP3KI: Acceleration & Expansion of Poverty Reduction-- 60 m poor & near poor (24% of total population; 2007: closer to ½)- Tax incentives:Boost downstream investment; outside Java & Bali (East Indonesia)129 business sectors eligible for tax allowance4.McKinsey report: Consuming class defined as individual with an annual net income of above $3,000 [DOUBLE CHECK] at 2005 purchasing power parity (PPP)Consumer Confidence Index (CCI): 116.6 in Dec (Nov: 114.3, Jan. 13: 119.2) point. Yearly high of 117.7 in Sept. 12.5. Investment realization tgt was 283 trillion; may hit 308 trillion.Govt shooting for 390 trillion in 2013Strong fundamentals e.g. macroeconomic stability
- BI: Economy could grow 6.7% - 7.2% in 2014FDI: Expected to have hit $21 b this yearGas: expected to grow 9% to 4,020 billion BTU/day (from 3,615 billion BTU/day) In the past 8 years, gas has increased by 250%, mostly demand from power plants, manufacturing industry & fertilizer plants National interest: Need to rebalance exports & domestic sales. For 1st time: export allocation will be < for domestic use(Indonesia is 3rd largest exporter after Qatar &M’sia.) Single largest holder of proven gas reserves in the world.
- 2012:World economy contracted, only grew 3.5% (2011: 3.9%)Fuel subsidies:- 2013: subsidies amount to Rp. 274 trillion; expected to breach Rp. 300 mKADIN (Indonesian Chamber of Commerce & Industry) recommends reducing the subsidy by $150 trillion (80% goes to people who can afford unsubsidized rates) Will = bigger budget for regional infrastructure developments = big push to develop these areas (can allocate Rp. 4 – 5 trillion to each area).Poor infrastructure:- Increase cost to produce & sellJan Flood: - Affected 74 urban wards in 31 sub-districts across Jkt’s 5 municipalities- Covered 41 sq km of land (approx. 8% of Jkt’s total area) Claimed at least 17 lives Claims to exceed Rp. 15 trillion for the 2007 Greater Jkt area flood (Indonesia General Insurance Association)- State-controlled BNI: $665,000 in losses (damage to branches & ATMs) Inundated >97,000 houses Forced 18,000 people from their homes Caused 8,000 people to suffer flood-related illnesses- Renewed talks about moving capital fromJktcos of its inability to copeFor years until 2012, no monthly trade deficit. 6 between April & November (record $1.4 b in Oct, narrowed in Nov.) Rising imports coupled with falling exports = $1.33 b deficit in the 1st 11 months (compared with $25.4 b surplus a year ago)!!! Import growth 2 – 3 x higher than export growthRp weakened ≅6% against the dollar in 2012 = Worst performing Asian currency last year Deficits will pressure the Rp. = Need to manage Some analysts see Rp weakening further, as much as 3% in 2013 Central Bank hopeful deficit will decline to “sustainable level” this year, as global economy improves &dd for Indonesia’s exports e.g. crude oil, coal & palm oil increases.Lack of strong institutions:- Bureaucratic inefficiency & corruption = govt budgets w could provide stimulus (because of falling public debt) often not spent.Govt spending not optimal (to facilitate growth & rebalancing)Regional min wage:Average increase of the Provincial Min Wage (UMP: Upah Min Kabupaten/Kota) is set at abt 18.3% (up from 10.27 in 2012). Highest regional wage increase (2012) recorded in E Kalimantan: 48.86% from Rp. 1,177,000 to Rp. 1,752,013 in 2013 Lowest UMP recorded in W Sulawesi: 31.37% from Rp. 1,127,000 to Rp. 1,165,000 in 2013.Jkt admin pinned min wage at Rp. 2.2 m in 2013, an increase of 44% from last year.
- Indonesia’s PotentialFinancial markets:The JCI (Jkt Composite Index) grew by 12.9% in 2012 Has been performing very well in the 1st weeks of 2013 Asian shares have been posting strong gains on news of China’s better-than-expected pick-up in its economy so far this year- Business sectors catering to domestic consumers will retain their position as champions of the bourse