SlideShare una empresa de Scribd logo
1 de 7
Descargar para leer sin conexión
How Does Your Practice
                                                                                                                                                            Compare?
                                                                                                               • 2007 RPA Survey Report
                                                                                                                                            – 2007 Participants
                              How Does Your Practice
                                                                                                                                            – 2007 Results
                                   Compare?                                                                                                       • National
                                                                                                                                                  • Regional
                              2007 RPA Benchmarking Survey                                                                                        • Large, Mid-Size, Benchmark, VAC
                                                                                                               • Trends
                                   RPA Annual Meeting
                                                                                                               • What does this mean for your practice?
                                     March 23, 2009


                                                                                                                                                           Survey Participation


                              RPA 2007 Nephrology                                                                                                                                Survey Participation


                                Practice Business                                                                                               1600
                                                                                                                       Number of Participants


                                                                                                                                                1400                                                                                       Total Number of
                                                                                                                                                1200                                                                                       Participating Practices
                               Benchmarking Survey                                                                                              1000
                                                                                                                                                                                                                                           Total Number of
                                                                                                                                                 800
                                                                                                                                                                                                                                           Nephrologists
                                                                                                                                                 600
                                      Report                                                                                                                                                                                               Total RPA Members
                                                                                                                                                 400
                                                                                                                                                                                                                                           Represented in Data
                                                                                                                                                 200
                                                                                                                                                   0
                                                                                                                                                       2003                2004               2005                   2007
                                                                                                                                                                                       Year


                                         Survey Participation                                                                                              Survey Participation

                                    US GEOGRAPHIC REPRESENTATION OF PARTICIPATING PRACTICES
                                                                                                                                                                                Practice Characteristics
                       100%

                                                                                                                                      100.00%
                       90%
                                                                                                                                       90.00%
                                                                                                               % Reporting


                                                     30%
                                  32%                                                                                                  80.00%
                                                                        36%                   37%
                       80%                                                                                                             70.00%                                                                                                                            2007
                                                                                                                                       60.00%
Percent of Practices


                                                                                                                                       50.00%                                                                                                                            2005
                       70%
                                                                                                                                       40.00%
                                                                                                                                       30.00%                                                                                                                            2004
                                                                                                     East
                       60%
                                                                                                                                       20.00%
                                                                                                     South
                                                                                                                                       10.00%
                                                     38%
                       50%        37%                                   30%                                                             0.00%
                                                                                                     Midwest
                                                                                              38%
                                                                                                     West
                       40%
                                                                                                                                                        Sin


                                                                                                                                                                           MS


                                                                                                                                                                                          MS


                                                                                                                                                                                                             So


                                                                                                                                                                                                                             Gr


                                                                                                                                                                                                                                               Ac


                                                                                                                                                                                                                                                               Ot
                                                                                                                                                                                                                                                                  he
                                                                                                                                                                                                                                o


                                                                                                                                                                                                                                                 ad
                                                                                                                                                                                                              lo
                                                                                                                                                           gl e


                       30%
                                                                                                                                                                                                                               up
                                                                                                                                                                            w/


                                                                                                                                                                                              w/


                                                                                                                                                                                                                                                                     r
                                                                                                                                                                                                                  Pr


                                                                                                                                                                                                                                                   em


                                                                        16%
                                                     16%
                                  16%
                                                                                                                                                             Sp


                                                                                                                                                                                Pr


                                                                                                                                                                                               Sp


                                                                                                                                                                                                                                    Pr
                                                                                                                                                                                                                    ac


                                                                                                                                                                                                                                                    ic


                       20%
                                                                                                                                                                                  im


                                                                                                                                                                                                                                      ac


                                                                                              14%
                                                                                                                                                               ec


                                                                                                                                                                                                 ec


                                                                                                                                                                                                                      t ic


                                                                                                                                                                                                                                                        Pr
                                                                                                                                                                                   ar


                                                                                                                                                                                                                                        tic
                                                                                                                                                                  ialt


                                                                                                                                                                                                    ialt


                                                                                                                                                                                                                        e


                                                                                                                                                                                                                                                           a


                       10%                                              18%
                                                                                                                                                                                     yC


                                                                                                                                                                                                                                           e


                                                     16%
                                                                                                                                                                                                                                                          cti


                                  15%
                                                                                                                                                                       y


                                                                                                                                                                                                         y


                                                                                              11%
                                                                                                                                                                                                                                                              ce
                                                                                                                                                                                                        ...
                                                                                                                                                                                        ar


                        0%
                                                                                                                                                                                          e


                                  2003               2004               2005                  2007
                                                                                                                                                                                               Type of Practice
                                                              Year
             N=73, 76, 106, 212


                                                                                                                                                                                                                                                                                1
2007 National Results                                         2007 National Results
                Providers                                                       Staff
                                                                                                              per FTE
                                                per FTE
                                                                                                  Total     Nephrologist
                                     Total    Nephrologist
                                                              FTE Clerical Staff                 1,939.1        1.56
  FTE Nephrologists                 1,383.7
      Non-Interventional            1,271.4       0.96
                                                              FTE Clinical Support Staff         1,086.9        1.10
      Interventional                 112.3        0.24
                                                              FTE Ancillary Staff                 127.9         0.50
  FTE Interventional Radiologists     24.0        0.47
  FTE Vascular Surgeons              37.0         0.63        FTE Admin/Mgt Staff                 442.4         0.43
  FTE NP / PA                        297.4        0.38
                                                               Total FTE non-provider staff      3,596.3        3.59


                                                                        2007 National Results
           2007 National Results
                                                                       Mean Revenue per FTE
          Practice Characteristics
                                                                            Nephrologist
                                                              Gross FFS Charges                            $1,127,660
                                                 per FTE
                                                              Net FFS Revenue                                541,050
                                     Total     Nephrologist
   Satellite Offices                  479          0.65
   Dialysis Units Serviced           1,852         1.77
                                                              Total Other Income                              94,890
   Hospitals Serviced                1,158         1.17
   Dialysis Patients Serviced       111,718       82.01

                                                              Total Net Practice Revenue                     641,520
                                                                         (cash basis)


          2007 National Results
                                                                    2007 National Results
         Mean Expenses per FTE
                                                                 Mean Physician Compensation
              Nephrologist

Total Personnel Expenses                        $118,170
                                                                Total Physician Benefits
Total Occupancy Expenses                         34,500

                                                                            $48,090
Total Medical Supplies Expense                   68,830
Total G&A Expenses                               55,230
                                                              Total Physician Compensation
Total Operating Expenses                        $276,730

                                                                                              $283,010


                                                                                                                           2
Geographic Regions


                                                                     Regional Results


                               2007 Results (Regional)                                                                                                                                                    2007 Results (Regional)
                                                                     TOTAL INCOME PER FTE NEPHROLOGIST BY REGION                                                                                                  MEAN PHYSICIAN COMPENSATION PER FTE NEPHROLOGIST BY REGION
                                                                            (Revenue - Adjustments + Other Income)
                                                                                                                                                                                 100%
                                                                                                                                                                                                                                                                              12%
                       100%                                                                                                                                                                                                    13%
                                                                                                                                                                                                                 16%                           17%              19%
                                                                                                                                                                                 90%
                                                                             15%
                       90%      22%                                                                                                                                                                                             9%
                                                                                                                26%                26%
                                                                                              29%                                                                                80%
                       80%                                                                                                                                                                                       21%                                                          29%
                                                                                                                                                          Percent of Practices


                                                                             23%
Percent of Practices


                                                                                                                                                                                 70%                                                           26%
                       70%                                                                                                                                                                                                                                      29%
                                                                                                                                   16%
                                27%                                                                                                                                                                                                                                                  $400K or more
                                                                                                                                          $800K or more                          60%
                       60%                                                                                                                                                                                                     41%
                                                                                                                33%
                                                                                              29%                                                                                                                                                                                    $300K-$399.9K
                                                                                                                                          $600K-$799.9K
                                                                                                                                                                                 50%
                       50%
                                                                                                                                                                                                                                                                                     $200K-$299.9K
                                                                                                                                                                                                                 35%
                                                                                                                                          $400K-$599.9K                                                                                                                       29%
                       40%                                                   44%                                                                                                 40%                                                                            27%                  Under $200K
                                                                                                                                          Under $400K                                                                                          43%
                                39%                                                                                                53%
                       30%                                                                                                                                                       30%
                                                                                              29%               33%
                       20%                                                                                                                                                       20%                                           37%
                                                                                                                                                                                                                                                                              29%
                                                                                                                                                                                                                 28%
                       10%                                                                                                                                                                                                                                      25%
                                                                             18%                                                                                                 10%
                                12%                                                           13%                8%                                                                                                                            13%
                                                                                                                                   5%
                        0%
                                                                                                                                                                                  0%
                              National                                       East           M idwest            South              West
                                                                                                                                                                                           National                            East          Midwe st           South         West


                               2007 Results (Regional)                                                                                                                                                    2007 Results (Regional)
                                                                                                                                                                                                                                      Financial Highlights
                                                                                                                                                                                        Mean Rev / Exp per FTE


                                                                       Total Relative Value Units per FTE Nephrologist                                                                                            $600,000
                                                                    18,000
                                                                                          15,901
                                         RVU per FTE Nephrologist


                                                                                                       16,349
                                                                                15,566                                    16,200                                                                                  $400,000
                                                                    16,000
                                                                                                                12,999
                                                                    14,000
                                                                                                                                                                                                                  $200,000
                                                                    12,000
                                                                    10,000
                                                                                                                                                                                                                        $-
                                                                     8,000
                                                                     6,000                                                                                                                                                    National      East        South     Midwest     West
                                                                     4,000
                                                                     2,000
                                                                                                                                                                                                                       Net Practice Revenue(cash)       Total Operating Exp
                                                                         0
                                                                                                                                                                                                                       Total Other Income               Total Phys Comp
                                                                               National    East        South    Midwest   West


                                                                                                                                                                                                                                                                                                     3
2007 Results (Practice Type)
                  2007 Practice Types
• Large: 10 or more FTE Nephrologists                                 FTEs per FTE Nephrologist
     (n=34)                                                                                                                                       National         Large        Mid-size Benchmark                     VAC
                                                                       Clerical Staff                                                                 1.56          1.38            1.22      1.42                     2.04
• Mid-Size: 2 – 7 FTE Nephrologists (n=130)                            Clinical Support Staff                                                         1.10          0.80            0.92      0.96                     1.51
                                                                       Ancillary Staff                                                                0.50          0.21            0.58      0.46                     0.29
• Benchmark: Greater than median Net                                   Admin/Mgt Staff                                                                0.43          0.36            0.32      0.40                     0.44
     Income before Phys Exp ($333,098) and less                          Total non-provider staff                                                     3.59          2.75            3.04      3.24                     4.28

     than median Total Operating Exp per                              NP/PAs                                                                          0.38          0.28            0.4         0.35                   0.28
     RVU ($18) (n=39)
• VAC: participating in a Vascular Access
     Center (n=43)


                                                                                                             2007 Results (Practice Type)
    2007 Results (Practice Type)
                                                                                                                                         Financial Highlights
                       Mean RVUs per FTE Nephrologist
                                                                                           Mean Rev / Exp per FTE

                                                                                                                    $800,000
             20,000
                                                                                                                    $600,000
             18,000
             16,000
                                                                                                                    $400,000
             14,000
             12,000
      RVUs


                                                                                                                    $200,000
             10,000
              8,000
                                                                                                                          $-
              6,000
                                                                                                                                  National       Large       Mid-size    Benchmark        VAC
              4,000
              2,000
                                                                                                                         Net Practice Revenue(cash)           Total Operating Exp
                  0
                      National   Large   Mid-size   Benchmark   VAC                                                      Total Other Income                   Total Phys Comp


                                                                        Patient Load, NP/PA Trends
                                                                                                                                 Dialysis Patient, NP/PA Increases

                                                                                                                100                                                                             0.40
                                                                                                                                                                                                0.35
                                                                               Patients per FTE


                                                                                                                    80
                                                                                                                                                                                                       NP/PA per FTE


                                                                                                                                                                                                0.30
                                                                                                                                                                                                0.25
                       Survey Trends                                                                                60
                                                                                                                                                                                                0.20
                                                                                                                    40                                                                          0.15
                                                                                                                                                                                                0.10
                                                                                                                    20
                                                                                                                                                                                                0.05
                                                                                                                    0                                                                           0.00
                                                                                                                               2003            2004              2005             2007

                                                                                                                                             Dialysis patients          NP,PA


                                                                                                                                                                                                                              4
Increasing Complexity                                                                                                                                                                                                                                                                                                         Staffing Trend
                                                                                                              High Level E&M Trends
                                                                                                                                                                                                                                                                                                                                                                                                                       FTE Staff / FTE Nephrologist
                                                                     60%
                                                  percent of total


                                                                     50%
                                                                                                                                                                                                                                                                                                                                                                       4.00
                                                                     40%
                                                                                                                                                                                                                                                                                                                                                                       3.50
                                                                     30%
                                                                     20%                                                                                                                                                                                                                                                                                               3.00
                                                                     10%
                                                                                                                                                                                                                                                                                                                                                                       2.50
                                                                      0%
                                                                                                                                                                                                                                                                                                                                                                       2.00
                                                                                              99244            99245                  99254                        99255              99214 OV 99215 OV
                                                                                                                                                                                                                                                                                                                                                                       1.50
                                                                                              Office           Office                  Hosp                        Hosp                 level 4  level 5
                                                                                             Consult          Consult                 Consult                     Consult                                                                                                                                                                                              1.00
                                                                                             level 4          level 5                 level 4                     level 5                                                                                                                                                                                              0.50
                                                                                                                                                                                                                                                                                                                                                                       0.00
                                                                                                                               2003            2004               2005           2007
                                                                                                                                                                                                                                                                                                                                                                                        1999                  2000                     2001                       2003                     2004                     2005                      2007


                                                                                                     Financial Trends                                                                                                                                                                                                                                 2007 RPA Nephrology Practice
                                                                                                                                                                                                                                                                                                                                                      Business Benchmarking Custom
                                                                                                                                                                                                                                                                                                                                                                 Report
                                                                                                                                Key Financial Indicators

                                                                                             600                                                                       30.00

                                                                                             500                                                                       25.00
                                                                                                                                                                                                                    Net FFS rev/FTE
                                                                                                                                                                                     RVU in 1,000s


                                                                                             400                                                                       20.00
                                                                               $ in 1,000s


                                                                                                                                                                                                                    Total Other Inc/FTE
                                                                                             300                                                                       15.00                                        Phys comp /FTE
                                                                                                                                                                                                                                                                                                                                                             Nephrology Associates USA (NAUSA)
                                                                                                                                                                                                                    Total op exp/FTE
                                                                                             200                                                                       10.00
                                                                                                                                                                                                                    RVU / FTE
                                                                                                                                                                                                                                                                                                                                                                       6 Nephrologists
                                                                                             100                                                                       5.00

                                                                                                0                                                                      0.00
                                                                                                                                                                                                                                                                                                                                                                Located in the Eastern Region
                                                                                                      2003            2004           2005            2007


                                                                                 Your Practice is included in the following sorts:
                                          Practice ID: xxx                                                                                                                                                                                                                                        Financial Information
                                                                                National                  East                         Large           VAC
                                                                                                                                                                                                                                                                                                  Fees for Service Charges per FTE Nephrologist

                                                                                                                 2007 RPA Nephrology Practice Business Benchmarking Custom Report                                                                                                                                                                                        Your Practice                    National                                    East                                      Benchmark                                   Large                                         VAC
                                                                                                                                                              **** CONFIDENTIAL ****                                                                                                              Sources of Income (000's)                                                                               Difference                                 Difference                                  Difference                                 Difference                                   Difference
                                                                                                                                                                                                                                                                                                                                                                                               Mean                    % Difference      Mean                     % Difference      Mean                      % Difference      Mean                      % Difference      Mean                      % Difference
                                                                                                                                                                                                                                                                                                  Gross Fees for Service Charges                                           $1,050.98        $1,127.66       -$76.68      -6.80%       $1,021.65         $29.33      2.87%        $1,286.77        -$235.79     -18.32%       $1,482.70       -$431.72      -29.12%       $1,455.61        -$404.63        -27.80%
                                                                                                                                                                                                                                                                                                  Total Adjustments to Fees for Service Charges                             $544.64          $586.61        -$41.97      -7.15%        $536.49           $8.15      1.52%         $658.47         -$113.83     -17.29%        $847.16        -$302.52      -35.71%        $829.31         -$284.67        -34.33%
                                                                                                                                                                                                                                                                                                  Net Fees for Service Revenues                                             $506.34          $541.05        -$34.71      -6.42%        $485.16          $21.18      4.36%         $628.29         -$121.95     -19.41%        $635.54        -$129.20      -20.33%        $626.30         -$119.96        -19.15%
                                                                                                                                                                                                                                                                                                   Fees received by the practice and/or
                                                                                                                                                                                                                                                                                                   individuals of the practice for Dialysis Facility
                                                                                                                                                                                                                                                                                                   Medical Directors                                                          $61.99          $68.14         -$6.15       -9.02%        $56.38           $5.61       9.94%        $101.00          -$39.01 -38.62%             $81.36         -$19.37      -23.80%         $84.90          -$22.91     -26.99%
Practice Characteristics                                                                                                                                                                                                                                                                           Reimbursement for Research Activity                                         $3.85          $4.55          -$0.70      -15.40%        $6.65           -$2.80     -42.09%         $1.46             $2.39 164.29%             $9.39           -$5.54      -58.98%          $9.46           -$5.61     -59.30%
                                                                                                                                                                                                                                                                                                   Legal Work                                                                  $0.15          $0.11           $0.04      37.02%         $0.21           -$0.06     -29.78%          $0.00            $0.15                     $0.07            $0.08     115.43%           $0.21           -$0.06     -29.87%
Employees per FTE Nephrologist
                                                                                                                                                                                                                                                                                                   Royalties                                                                   $0.00         $0.003           $0.00     -100.00%        $0.00            $0.00    -100.00%         $0.003            $0.00 -100.00%            $0.004           $0.00     -100.00%         $0.003            $0.00    -100.00%
                                                                                                                                                                                                                                                                                                   Rents                                                                       $0.33          $0.26           $0.07      27.66%         $0.42           -$0.09     -21.93%          $0.02            $0.31 1557.44%            $0.07            $0.26     393.20%           $0.05            $0.28    519.47%
                                                                                     Your Practice                    National                                       East                                           Benchmark                                         Large                        Other                                                                       $10.62         $21.82        -$11.20      -51.34%        $18.01          -$7.39     -41.04%         $10.26            $0.36   3.48%             $57.08         -$46.46      -81.39%         $58.75          -$48.13     -81.92%
                                                                                                                                                                                                                                                                                                  Total Other Income                                                          $76.94         $94.89         -$17.95      -18.91%       $81.68           -$4.74      -5.81%        $112.74          -$35.80 -31.75%            $147.96         -$71.02      -48.00%        $153.38          -$76.44     -49.84%
                                                                                                                      Difference                                    Difference                                         Difference                                     Difference
                                                                                                          Mean                      % Difference       Mean                      % Difference           Mean                           % Difference      Mean                      % Difference   Total Income                                                                $583.28        $635.94        -$52.66       -8.28%       $566.85          $16.43       2.90%        $741.03         -$157.75 -21.29%            $783.50        -$200.22      -25.55%        $779.68         -$196.40     -25.19%
Non-Interventional Nephrologist                                                              0.98          0.96          0.02         2.31%            0.97            0.01        1.42%                0.93              0.05           4.93%           0.89            0.09          10.10%     *Percent change can not be calculated, because the average for the sort was zero.
Interventional Nephrologist                                                                  0.46          0.24          0.22         90.99%           0.27            0.19        70.17%               0.29              0.17          57.34%           0.14           0.32           219.99%
                                                                                                                                                                                                                                                                                                  Percentage of Total Income                                                                              Difference                                 Difference                                  Difference                                 Difference                                   Difference
                                                                                                                                                                                                                                                                                                                                                                                           Mean Percent                               Mean Percent                               Mean Percent                                Mean Percent                                Mean Percent
Interventional Radiologists                                                                  0.60          0.47          0.13         28.98%           0.70           -0.10       -14.29%               0.07              0.53         800.00%           0.17           0.43           260.30%
                                                                                                                                                                                                                                                                                                  Gross Fees for Service Charges                                           167.40%           170.10%       -2.70%                      172.10%       -4.70%                       173.59%         -6.19%                      192.43%       -25.03%                       183.54%        -16.14%
Vascular Surgeons                                                                            0.69          0.63          0.06         9.53%            0.54            0.15        28.92%               0.04              0.65         1556.00%          0.25            0.44          178.19%
                                                                                                                                                                                                                                                                                                  Net Fees for Service Revenues                                            88.20%            86.73%        1.47%                       85.30%        2.90%                         85.26%         2.94%                       83.15%         5.05%                         80.20%         8.00%
Nurse Practitioners/Physician Assistants                                                     0.40          0.38          0.02         6.40%            0.39            0.01        2.87%                0.35              0.05           14.32%          0.28            0.12          41.73%      Fees received by the practice and/or
Clerical Staff                                                                               1.22          1.56         -0.34        -21.81%           1.45           -0.23       -15.99%               1.42             -0.20          -13.82%          1.38           -0.16          -11.60%     individuals of the practice for Dialysis Facility
Clinical Support Staff                                                                       0.92          1.10         -0.18        -16.20%           0.86            0.06        7.52%                0.96             -0.04           -3.86%          0.80            0.12          15.14%      Medical Directors                                                        8.00%             9.07%        -1.07%                       9.71%        -1.71%                        13.12%         -5.12%                      10.13%        -2.13%                        11.61%         -3.61%
                                                                                                                                                                                                                                                                                                   Reimbursement for Research Activity                                      1.18%             1.03%         0.15%                       1.87%        -0.69%                        0.21%           0.97%                       1.43%        -0.25%                         2.30%         -1.12%
Ancillary Staff                                                                              0.58          0.50          0.08         17.16%           0.58            0.00        -0.77%               0.46              0.12           27.37%          0.21            0.37          171.75%
                                                                                                                                                                                                                                                                                                   Legal Work                                                               0.07%             0.04%        0.03%                        0.11%        -0.04%                        0.00%           0.07%                       0.01%         0.06%                         0.14%         -0.07%
Administrative/Management Staff                                                              0.32          0.43         -0.11        -26.11%           0.38           -0.06       -16.47%               0.40             -0.08          -20.10%          0.36           -0.04          -12.30%
                                                                                                                                                                                                                                                                                                   Royalties                                                                0.00%             0.00%         0.00%                       0.00%        0.00%                         0.00%           0.00%                       0.00%         0.00%                         0.00%          0.00%
Satellite Offices                                                                            0.62          0.65         -0.03         -3.98%           0.47            0.15        32.80%               0.52              0.10          18.49%           0.35           0.27           74.75%      Rents                                                                    0.07%             0.05%         0.02%                       0.09%        -0.02%                        0.00%           0.07%                       0.01%         0.06%                         0.01%          0.06%
Dialysis Units Serviced**                                                                    1.59          1.77         -0.18        -10.34%           1.37            0.22        16.08%               1.80             -0.21          -11.43%          1.07            0.52          48.25%      Other                                                                    2.49%             3.07%        -0.58%                       2.91%        -0.42%                        1.41%           1.08%                       5.27%        -2.78%                         5.73%         -3.24%
Hospitals Serviced**                                                                         0.99          1.17         -0.18        -15.63%           0.85            0.14        16.94%               1.03             -0.04           -3.54%          0.71            0.28          38.74%     Total Other Income                                                       11.80%            13.27%        -1.47%                      14.70%        -2.90%                        14.74%         -2.94%                      16.85%        -5.05%                        19.80%         -8.00%
                                                                                                                                                                                                                                                                                                  Total Income                                                             100.00%           100.00%        0.00%                      100.00%       0.00%                        100.00%          0.00%                      100.00%        0.00%                        100.00%         0.00%
Dialysis Patients Serviced**                                                                 69.42        82.01        -12.59        -15.35%          76.65           -7.23        -9.43%               93.87           -24.45          -26.04%         102.30         -32.88          -32.14%

**This line does not refer to employees per FTE Nephrologist instead it is either units, hospitals, or patients per FTE Nephrologist                                                                                                                                                                                                                                                                                              Comparison of Total Income per FTE Nephrologist

                                                                                                                                        Comparison of Number of Employees per FTE Nephrologist                                                                                                                                                $900
                           2.20
                                                                                                                                                                                                                                                                                                                                              $800
                           2.00
                                                                                                                                                                                                                                                                                                                                              $700
                           1.80
  Employees per FTE Neph


                                                                                                                                                                                                                                                                                                                                              $600
                                                                                                                                                                                                                                                                                                   Income (000's)


                           1.60
                                                                                                                                                                                                                                                                                                                                              $500
                           1.40
                                                                                                                                                                                                                                                                                                                                              $400
                           1.20
                                                                                                                                                                                                                                                                                                                                              $300
                           1.00
                                                                                                                                                                                                                                                                                                                                              $200
                           0.80
                                                                                                                                                                                                                                                                                                                                              $100
                           0.60
                                                                                                                                                                                                                                                                                                                                                $0
                           0.40
                                                                                                                                                                                                                                                                                                                                                      Your Practice                     National                               East                                Benchmark                                    Large                                     VAC
                           0.20

                           0.00
                                  Non-Interventional                 Interventional Nephrologist Interventional Radiologists       Vascular Surgeons                    Nurse                         Clerical Staff                Clinical Support Staff           Ancillary Staff       Admi                                                                                                                            Comparison of Sources of Total Income per FTE Nephrologist
                                    Nephrologist                                                                                                               Practitioners/Physician
                                                                                                                                                                      Assistants
                                                                                                                                                                                                                                                                                                                                               100%

                                                                                                                                                                                                                                                                                                                                                90%

                                                                                                                                                                                                                                                                                                                                                80%
                                                                                                                                                                                                                                                                                                                    Percent of Total Income


Dialysis Patient Location                                                                                                                                                                                                                                                                                                                       70%

                                                                                                                                                                                                                                                                                                                                                60%
Percentage of Dialysis Patients                                                                                                                                                                                                                                                                                                                                                                                                                                                                                                                                                     Total Other Income*
                                                                                                                                                                                                                                                                                                                                                50%
                                                                                                                                                                                                                                                                                                                                                                                                                                                                                                                                                                                    Net Fees for Service Revenue
                                                                                                                                                                                                                                                                                                                                                40%
                                                                                     Your Practice                    National                                       East                                           Benchmark                                         Large
                                                                                                                                                                                                                                                                                                                                                30%
                                                                                                                      Difference                                    Difference                                         Difference                                     Difference
                                                                                                       Mean Percent                                Mean Percent                                      Mean Percent                                     Mean Percent
                                                                                                                                                                                                                                                                                                                                                20%
In Center                                                                                    84.54%     85.52%         -0.98%                       84.23%            0.31%                           86.19%           -1.65%                          88.99%         -4.45%
                                                                                                                                                                                                                                                                                                                                                10%
At Home                                                                                      11.32%     8.99%           2.33%                       10.05%            1.27%                           8.35%             2.97%                           4.88%         6.44%
Transient                                                                                    4.14%      5.49%          -1.35%                       5.72%            -1.58%                           5.46%            -1.32%                           6.13%         -1.99%                                                                     0%
                                                                                                                                                                                                                                                                                                                                                       Your Practice                     National                              East                                Benchmark                                   Large                                     VAC

                                                                                                                                                                                                                                                                                                  *Total Other Income includes Fees for Medical Directors, Reimbursement for Research Activity, Legal Work, Royalties, Rents, and Other.


                                                                                                                                                                                                                                                                                                                                                                                                                                                                                                                                                                                                                     5
012 Am09 Presentations   Mecum

Más contenido relacionado

Más de Simon Prince

Beacon Health Partners
Beacon Health PartnersBeacon Health Partners
Beacon Health PartnersSimon Prince
 
Beacon IPA Intro 2010
Beacon IPA Intro 2010Beacon IPA Intro 2010
Beacon IPA Intro 2010Simon Prince
 
06 Am09 Presentations Gutman
06 Am09 Presentations   Gutman06 Am09 Presentations   Gutman
06 Am09 Presentations GutmanSimon Prince
 
07 Am09 Presentations Hamburger & Lawson
07 Am09 Presentations   Hamburger & Lawson07 Am09 Presentations   Hamburger & Lawson
07 Am09 Presentations Hamburger & LawsonSimon Prince
 
08 Am09 Presentations Kliger
08 Am09 Presentations   Kliger08 Am09 Presentations   Kliger
08 Am09 Presentations KligerSimon Prince
 
011 Am09 Presentations Maddux
011 Am09 Presentations   Maddux011 Am09 Presentations   Maddux
011 Am09 Presentations MadduxSimon Prince
 
05 Am09 Presentations Coeytaux
05 Am09 Presentations   Coeytaux05 Am09 Presentations   Coeytaux
05 Am09 Presentations CoeytauxSimon Prince
 
Glomerulonephritis
GlomerulonephritisGlomerulonephritis
GlomerulonephritisSimon Prince
 

Más de Simon Prince (11)

Beacon Health Partners
Beacon Health PartnersBeacon Health Partners
Beacon Health Partners
 
Beacon IPA Intro 2010
Beacon IPA Intro 2010Beacon IPA Intro 2010
Beacon IPA Intro 2010
 
Hyponatremia
HyponatremiaHyponatremia
Hyponatremia
 
Hyponatremia
HyponatremiaHyponatremia
Hyponatremia
 
06 Am09 Presentations Gutman
06 Am09 Presentations   Gutman06 Am09 Presentations   Gutman
06 Am09 Presentations Gutman
 
07 Am09 Presentations Hamburger & Lawson
07 Am09 Presentations   Hamburger & Lawson07 Am09 Presentations   Hamburger & Lawson
07 Am09 Presentations Hamburger & Lawson
 
08 Am09 Presentations Kliger
08 Am09 Presentations   Kliger08 Am09 Presentations   Kliger
08 Am09 Presentations Kliger
 
011 Am09 Presentations Maddux
011 Am09 Presentations   Maddux011 Am09 Presentations   Maddux
011 Am09 Presentations Maddux
 
05 Am09 Presentations Coeytaux
05 Am09 Presentations   Coeytaux05 Am09 Presentations   Coeytaux
05 Am09 Presentations Coeytaux
 
Glomerulonephritis
GlomerulonephritisGlomerulonephritis
Glomerulonephritis
 
Proteinuria
ProteinuriaProteinuria
Proteinuria
 

Último

Axa Assurance Maroc - Insurer Innovation Award 2024
Axa Assurance Maroc - Insurer Innovation Award 2024Axa Assurance Maroc - Insurer Innovation Award 2024
Axa Assurance Maroc - Insurer Innovation Award 2024The Digital Insurer
 
Data Cloud, More than a CDP by Matt Robison
Data Cloud, More than a CDP by Matt RobisonData Cloud, More than a CDP by Matt Robison
Data Cloud, More than a CDP by Matt RobisonAnna Loughnan Colquhoun
 
Exploring the Future Potential of AI-Enabled Smartphone Processors
Exploring the Future Potential of AI-Enabled Smartphone ProcessorsExploring the Future Potential of AI-Enabled Smartphone Processors
Exploring the Future Potential of AI-Enabled Smartphone Processorsdebabhi2
 
A Year of the Servo Reboot: Where Are We Now?
A Year of the Servo Reboot: Where Are We Now?A Year of the Servo Reboot: Where Are We Now?
A Year of the Servo Reboot: Where Are We Now?Igalia
 
Apidays New York 2024 - Scaling API-first by Ian Reasor and Radu Cotescu, Adobe
Apidays New York 2024 - Scaling API-first by Ian Reasor and Radu Cotescu, AdobeApidays New York 2024 - Scaling API-first by Ian Reasor and Radu Cotescu, Adobe
Apidays New York 2024 - Scaling API-first by Ian Reasor and Radu Cotescu, Adobeapidays
 
Strategies for Landing an Oracle DBA Job as a Fresher
Strategies for Landing an Oracle DBA Job as a FresherStrategies for Landing an Oracle DBA Job as a Fresher
Strategies for Landing an Oracle DBA Job as a FresherRemote DBA Services
 
Repurposing LNG terminals for Hydrogen Ammonia: Feasibility and Cost Saving
Repurposing LNG terminals for Hydrogen Ammonia: Feasibility and Cost SavingRepurposing LNG terminals for Hydrogen Ammonia: Feasibility and Cost Saving
Repurposing LNG terminals for Hydrogen Ammonia: Feasibility and Cost SavingEdi Saputra
 
Boost Fertility New Invention Ups Success Rates.pdf
Boost Fertility New Invention Ups Success Rates.pdfBoost Fertility New Invention Ups Success Rates.pdf
Boost Fertility New Invention Ups Success Rates.pdfsudhanshuwaghmare1
 
HTML Injection Attacks: Impact and Mitigation Strategies
HTML Injection Attacks: Impact and Mitigation StrategiesHTML Injection Attacks: Impact and Mitigation Strategies
HTML Injection Attacks: Impact and Mitigation StrategiesBoston Institute of Analytics
 
🐬 The future of MySQL is Postgres 🐘
🐬  The future of MySQL is Postgres   🐘🐬  The future of MySQL is Postgres   🐘
🐬 The future of MySQL is Postgres 🐘RTylerCroy
 
TrustArc Webinar - Stay Ahead of US State Data Privacy Law Developments
TrustArc Webinar - Stay Ahead of US State Data Privacy Law DevelopmentsTrustArc Webinar - Stay Ahead of US State Data Privacy Law Developments
TrustArc Webinar - Stay Ahead of US State Data Privacy Law DevelopmentsTrustArc
 
Workshop - Best of Both Worlds_ Combine KG and Vector search for enhanced R...
Workshop - Best of Both Worlds_ Combine  KG and Vector search for  enhanced R...Workshop - Best of Both Worlds_ Combine  KG and Vector search for  enhanced R...
Workshop - Best of Both Worlds_ Combine KG and Vector search for enhanced R...Neo4j
 
ProductAnonymous-April2024-WinProductDiscovery-MelissaKlemke
ProductAnonymous-April2024-WinProductDiscovery-MelissaKlemkeProductAnonymous-April2024-WinProductDiscovery-MelissaKlemke
ProductAnonymous-April2024-WinProductDiscovery-MelissaKlemkeProduct Anonymous
 
Deploy with confidence: VMware Cloud Foundation 5.1 on next gen Dell PowerEdg...
Deploy with confidence: VMware Cloud Foundation 5.1 on next gen Dell PowerEdg...Deploy with confidence: VMware Cloud Foundation 5.1 on next gen Dell PowerEdg...
Deploy with confidence: VMware Cloud Foundation 5.1 on next gen Dell PowerEdg...Principled Technologies
 
Bajaj Allianz Life Insurance Company - Insurer Innovation Award 2024
Bajaj Allianz Life Insurance Company - Insurer Innovation Award 2024Bajaj Allianz Life Insurance Company - Insurer Innovation Award 2024
Bajaj Allianz Life Insurance Company - Insurer Innovation Award 2024The Digital Insurer
 
MINDCTI Revenue Release Quarter One 2024
MINDCTI Revenue Release Quarter One 2024MINDCTI Revenue Release Quarter One 2024
MINDCTI Revenue Release Quarter One 2024MIND CTI
 
AWS Community Day CPH - Three problems of Terraform
AWS Community Day CPH - Three problems of TerraformAWS Community Day CPH - Three problems of Terraform
AWS Community Day CPH - Three problems of TerraformAndrey Devyatkin
 
Cloud Frontiers: A Deep Dive into Serverless Spatial Data and FME
Cloud Frontiers:  A Deep Dive into Serverless Spatial Data and FMECloud Frontiers:  A Deep Dive into Serverless Spatial Data and FME
Cloud Frontiers: A Deep Dive into Serverless Spatial Data and FMESafe Software
 
Partners Life - Insurer Innovation Award 2024
Partners Life - Insurer Innovation Award 2024Partners Life - Insurer Innovation Award 2024
Partners Life - Insurer Innovation Award 2024The Digital Insurer
 

Último (20)

Axa Assurance Maroc - Insurer Innovation Award 2024
Axa Assurance Maroc - Insurer Innovation Award 2024Axa Assurance Maroc - Insurer Innovation Award 2024
Axa Assurance Maroc - Insurer Innovation Award 2024
 
Data Cloud, More than a CDP by Matt Robison
Data Cloud, More than a CDP by Matt RobisonData Cloud, More than a CDP by Matt Robison
Data Cloud, More than a CDP by Matt Robison
 
Exploring the Future Potential of AI-Enabled Smartphone Processors
Exploring the Future Potential of AI-Enabled Smartphone ProcessorsExploring the Future Potential of AI-Enabled Smartphone Processors
Exploring the Future Potential of AI-Enabled Smartphone Processors
 
A Year of the Servo Reboot: Where Are We Now?
A Year of the Servo Reboot: Where Are We Now?A Year of the Servo Reboot: Where Are We Now?
A Year of the Servo Reboot: Where Are We Now?
 
Apidays New York 2024 - Scaling API-first by Ian Reasor and Radu Cotescu, Adobe
Apidays New York 2024 - Scaling API-first by Ian Reasor and Radu Cotescu, AdobeApidays New York 2024 - Scaling API-first by Ian Reasor and Radu Cotescu, Adobe
Apidays New York 2024 - Scaling API-first by Ian Reasor and Radu Cotescu, Adobe
 
+971581248768>> SAFE AND ORIGINAL ABORTION PILLS FOR SALE IN DUBAI AND ABUDHA...
+971581248768>> SAFE AND ORIGINAL ABORTION PILLS FOR SALE IN DUBAI AND ABUDHA...+971581248768>> SAFE AND ORIGINAL ABORTION PILLS FOR SALE IN DUBAI AND ABUDHA...
+971581248768>> SAFE AND ORIGINAL ABORTION PILLS FOR SALE IN DUBAI AND ABUDHA...
 
Strategies for Landing an Oracle DBA Job as a Fresher
Strategies for Landing an Oracle DBA Job as a FresherStrategies for Landing an Oracle DBA Job as a Fresher
Strategies for Landing an Oracle DBA Job as a Fresher
 
Repurposing LNG terminals for Hydrogen Ammonia: Feasibility and Cost Saving
Repurposing LNG terminals for Hydrogen Ammonia: Feasibility and Cost SavingRepurposing LNG terminals for Hydrogen Ammonia: Feasibility and Cost Saving
Repurposing LNG terminals for Hydrogen Ammonia: Feasibility and Cost Saving
 
Boost Fertility New Invention Ups Success Rates.pdf
Boost Fertility New Invention Ups Success Rates.pdfBoost Fertility New Invention Ups Success Rates.pdf
Boost Fertility New Invention Ups Success Rates.pdf
 
HTML Injection Attacks: Impact and Mitigation Strategies
HTML Injection Attacks: Impact and Mitigation StrategiesHTML Injection Attacks: Impact and Mitigation Strategies
HTML Injection Attacks: Impact and Mitigation Strategies
 
🐬 The future of MySQL is Postgres 🐘
🐬  The future of MySQL is Postgres   🐘🐬  The future of MySQL is Postgres   🐘
🐬 The future of MySQL is Postgres 🐘
 
TrustArc Webinar - Stay Ahead of US State Data Privacy Law Developments
TrustArc Webinar - Stay Ahead of US State Data Privacy Law DevelopmentsTrustArc Webinar - Stay Ahead of US State Data Privacy Law Developments
TrustArc Webinar - Stay Ahead of US State Data Privacy Law Developments
 
Workshop - Best of Both Worlds_ Combine KG and Vector search for enhanced R...
Workshop - Best of Both Worlds_ Combine  KG and Vector search for  enhanced R...Workshop - Best of Both Worlds_ Combine  KG and Vector search for  enhanced R...
Workshop - Best of Both Worlds_ Combine KG and Vector search for enhanced R...
 
ProductAnonymous-April2024-WinProductDiscovery-MelissaKlemke
ProductAnonymous-April2024-WinProductDiscovery-MelissaKlemkeProductAnonymous-April2024-WinProductDiscovery-MelissaKlemke
ProductAnonymous-April2024-WinProductDiscovery-MelissaKlemke
 
Deploy with confidence: VMware Cloud Foundation 5.1 on next gen Dell PowerEdg...
Deploy with confidence: VMware Cloud Foundation 5.1 on next gen Dell PowerEdg...Deploy with confidence: VMware Cloud Foundation 5.1 on next gen Dell PowerEdg...
Deploy with confidence: VMware Cloud Foundation 5.1 on next gen Dell PowerEdg...
 
Bajaj Allianz Life Insurance Company - Insurer Innovation Award 2024
Bajaj Allianz Life Insurance Company - Insurer Innovation Award 2024Bajaj Allianz Life Insurance Company - Insurer Innovation Award 2024
Bajaj Allianz Life Insurance Company - Insurer Innovation Award 2024
 
MINDCTI Revenue Release Quarter One 2024
MINDCTI Revenue Release Quarter One 2024MINDCTI Revenue Release Quarter One 2024
MINDCTI Revenue Release Quarter One 2024
 
AWS Community Day CPH - Three problems of Terraform
AWS Community Day CPH - Three problems of TerraformAWS Community Day CPH - Three problems of Terraform
AWS Community Day CPH - Three problems of Terraform
 
Cloud Frontiers: A Deep Dive into Serverless Spatial Data and FME
Cloud Frontiers:  A Deep Dive into Serverless Spatial Data and FMECloud Frontiers:  A Deep Dive into Serverless Spatial Data and FME
Cloud Frontiers: A Deep Dive into Serverless Spatial Data and FME
 
Partners Life - Insurer Innovation Award 2024
Partners Life - Insurer Innovation Award 2024Partners Life - Insurer Innovation Award 2024
Partners Life - Insurer Innovation Award 2024
 

012 Am09 Presentations Mecum

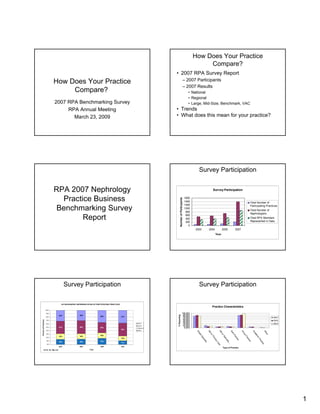
  • 1. How Does Your Practice Compare? • 2007 RPA Survey Report – 2007 Participants How Does Your Practice – 2007 Results Compare? • National • Regional 2007 RPA Benchmarking Survey • Large, Mid-Size, Benchmark, VAC • Trends RPA Annual Meeting • What does this mean for your practice? March 23, 2009 Survey Participation RPA 2007 Nephrology Survey Participation Practice Business 1600 Number of Participants 1400 Total Number of 1200 Participating Practices Benchmarking Survey 1000 Total Number of 800 Nephrologists 600 Report Total RPA Members 400 Represented in Data 200 0 2003 2004 2005 2007 Year Survey Participation Survey Participation US GEOGRAPHIC REPRESENTATION OF PARTICIPATING PRACTICES Practice Characteristics 100% 100.00% 90% 90.00% % Reporting 30% 32% 80.00% 36% 37% 80% 70.00% 2007 60.00% Percent of Practices 50.00% 2005 70% 40.00% 30.00% 2004 East 60% 20.00% South 10.00% 38% 50% 37% 30% 0.00% Midwest 38% West 40% Sin MS MS So Gr Ac Ot he o ad lo gl e 30% up w/ w/ r Pr em 16% 16% 16% Sp Pr Sp Pr ac ic 20% im ac 14% ec ec t ic Pr ar tic ialt ialt e a 10% 18% yC e 16% cti 15% y y 11% ce ... ar 0% e 2003 2004 2005 2007 Type of Practice Year N=73, 76, 106, 212 1
  • 2. 2007 National Results 2007 National Results Providers Staff per FTE per FTE Total Nephrologist Total Nephrologist FTE Clerical Staff 1,939.1 1.56 FTE Nephrologists 1,383.7 Non-Interventional 1,271.4 0.96 FTE Clinical Support Staff 1,086.9 1.10 Interventional 112.3 0.24 FTE Ancillary Staff 127.9 0.50 FTE Interventional Radiologists 24.0 0.47 FTE Vascular Surgeons 37.0 0.63 FTE Admin/Mgt Staff 442.4 0.43 FTE NP / PA 297.4 0.38 Total FTE non-provider staff 3,596.3 3.59 2007 National Results 2007 National Results Mean Revenue per FTE Practice Characteristics Nephrologist Gross FFS Charges $1,127,660 per FTE Net FFS Revenue 541,050 Total Nephrologist Satellite Offices 479 0.65 Dialysis Units Serviced 1,852 1.77 Total Other Income 94,890 Hospitals Serviced 1,158 1.17 Dialysis Patients Serviced 111,718 82.01 Total Net Practice Revenue 641,520 (cash basis) 2007 National Results 2007 National Results Mean Expenses per FTE Mean Physician Compensation Nephrologist Total Personnel Expenses $118,170 Total Physician Benefits Total Occupancy Expenses 34,500 $48,090 Total Medical Supplies Expense 68,830 Total G&A Expenses 55,230 Total Physician Compensation Total Operating Expenses $276,730 $283,010 2
  • 3. Geographic Regions Regional Results 2007 Results (Regional) 2007 Results (Regional) TOTAL INCOME PER FTE NEPHROLOGIST BY REGION MEAN PHYSICIAN COMPENSATION PER FTE NEPHROLOGIST BY REGION (Revenue - Adjustments + Other Income) 100% 12% 100% 13% 16% 17% 19% 90% 15% 90% 22% 9% 26% 26% 29% 80% 80% 21% 29% Percent of Practices 23% Percent of Practices 70% 26% 70% 29% 16% 27% $400K or more $800K or more 60% 60% 41% 33% 29% $300K-$399.9K $600K-$799.9K 50% 50% $200K-$299.9K 35% $400K-$599.9K 29% 40% 44% 40% 27% Under $200K Under $400K 43% 39% 53% 30% 30% 29% 33% 20% 20% 37% 29% 28% 10% 25% 18% 10% 12% 13% 8% 13% 5% 0% 0% National East M idwest South West National East Midwe st South West 2007 Results (Regional) 2007 Results (Regional) Financial Highlights Mean Rev / Exp per FTE Total Relative Value Units per FTE Nephrologist $600,000 18,000 15,901 RVU per FTE Nephrologist 16,349 15,566 16,200 $400,000 16,000 12,999 14,000 $200,000 12,000 10,000 $- 8,000 6,000 National East South Midwest West 4,000 2,000 Net Practice Revenue(cash) Total Operating Exp 0 Total Other Income Total Phys Comp National East South Midwest West 3
  • 4. 2007 Results (Practice Type) 2007 Practice Types • Large: 10 or more FTE Nephrologists FTEs per FTE Nephrologist (n=34) National Large Mid-size Benchmark VAC Clerical Staff 1.56 1.38 1.22 1.42 2.04 • Mid-Size: 2 – 7 FTE Nephrologists (n=130) Clinical Support Staff 1.10 0.80 0.92 0.96 1.51 Ancillary Staff 0.50 0.21 0.58 0.46 0.29 • Benchmark: Greater than median Net Admin/Mgt Staff 0.43 0.36 0.32 0.40 0.44 Income before Phys Exp ($333,098) and less Total non-provider staff 3.59 2.75 3.04 3.24 4.28 than median Total Operating Exp per NP/PAs 0.38 0.28 0.4 0.35 0.28 RVU ($18) (n=39) • VAC: participating in a Vascular Access Center (n=43) 2007 Results (Practice Type) 2007 Results (Practice Type) Financial Highlights Mean RVUs per FTE Nephrologist Mean Rev / Exp per FTE $800,000 20,000 $600,000 18,000 16,000 $400,000 14,000 12,000 RVUs $200,000 10,000 8,000 $- 6,000 National Large Mid-size Benchmark VAC 4,000 2,000 Net Practice Revenue(cash) Total Operating Exp 0 National Large Mid-size Benchmark VAC Total Other Income Total Phys Comp Patient Load, NP/PA Trends Dialysis Patient, NP/PA Increases 100 0.40 0.35 Patients per FTE 80 NP/PA per FTE 0.30 0.25 Survey Trends 60 0.20 40 0.15 0.10 20 0.05 0 0.00 2003 2004 2005 2007 Dialysis patients NP,PA 4
  • 5. Increasing Complexity Staffing Trend High Level E&M Trends FTE Staff / FTE Nephrologist 60% percent of total 50% 4.00 40% 3.50 30% 20% 3.00 10% 2.50 0% 2.00 99244 99245 99254 99255 99214 OV 99215 OV 1.50 Office Office Hosp Hosp level 4 level 5 Consult Consult Consult Consult 1.00 level 4 level 5 level 4 level 5 0.50 0.00 2003 2004 2005 2007 1999 2000 2001 2003 2004 2005 2007 Financial Trends 2007 RPA Nephrology Practice Business Benchmarking Custom Report Key Financial Indicators 600 30.00 500 25.00 Net FFS rev/FTE RVU in 1,000s 400 20.00 $ in 1,000s Total Other Inc/FTE 300 15.00 Phys comp /FTE Nephrology Associates USA (NAUSA) Total op exp/FTE 200 10.00 RVU / FTE 6 Nephrologists 100 5.00 0 0.00 Located in the Eastern Region 2003 2004 2005 2007 Your Practice is included in the following sorts: Practice ID: xxx Financial Information National East Large VAC Fees for Service Charges per FTE Nephrologist 2007 RPA Nephrology Practice Business Benchmarking Custom Report Your Practice National East Benchmark Large VAC **** CONFIDENTIAL **** Sources of Income (000's) Difference Difference Difference Difference Difference Mean % Difference Mean % Difference Mean % Difference Mean % Difference Mean % Difference Gross Fees for Service Charges $1,050.98 $1,127.66 -$76.68 -6.80% $1,021.65 $29.33 2.87% $1,286.77 -$235.79 -18.32% $1,482.70 -$431.72 -29.12% $1,455.61 -$404.63 -27.80% Total Adjustments to Fees for Service Charges $544.64 $586.61 -$41.97 -7.15% $536.49 $8.15 1.52% $658.47 -$113.83 -17.29% $847.16 -$302.52 -35.71% $829.31 -$284.67 -34.33% Net Fees for Service Revenues $506.34 $541.05 -$34.71 -6.42% $485.16 $21.18 4.36% $628.29 -$121.95 -19.41% $635.54 -$129.20 -20.33% $626.30 -$119.96 -19.15% Fees received by the practice and/or individuals of the practice for Dialysis Facility Medical Directors $61.99 $68.14 -$6.15 -9.02% $56.38 $5.61 9.94% $101.00 -$39.01 -38.62% $81.36 -$19.37 -23.80% $84.90 -$22.91 -26.99% Practice Characteristics Reimbursement for Research Activity $3.85 $4.55 -$0.70 -15.40% $6.65 -$2.80 -42.09% $1.46 $2.39 164.29% $9.39 -$5.54 -58.98% $9.46 -$5.61 -59.30% Legal Work $0.15 $0.11 $0.04 37.02% $0.21 -$0.06 -29.78% $0.00 $0.15 $0.07 $0.08 115.43% $0.21 -$0.06 -29.87% Employees per FTE Nephrologist Royalties $0.00 $0.003 $0.00 -100.00% $0.00 $0.00 -100.00% $0.003 $0.00 -100.00% $0.004 $0.00 -100.00% $0.003 $0.00 -100.00% Rents $0.33 $0.26 $0.07 27.66% $0.42 -$0.09 -21.93% $0.02 $0.31 1557.44% $0.07 $0.26 393.20% $0.05 $0.28 519.47% Your Practice National East Benchmark Large Other $10.62 $21.82 -$11.20 -51.34% $18.01 -$7.39 -41.04% $10.26 $0.36 3.48% $57.08 -$46.46 -81.39% $58.75 -$48.13 -81.92% Total Other Income $76.94 $94.89 -$17.95 -18.91% $81.68 -$4.74 -5.81% $112.74 -$35.80 -31.75% $147.96 -$71.02 -48.00% $153.38 -$76.44 -49.84% Difference Difference Difference Difference Mean % Difference Mean % Difference Mean % Difference Mean % Difference Total Income $583.28 $635.94 -$52.66 -8.28% $566.85 $16.43 2.90% $741.03 -$157.75 -21.29% $783.50 -$200.22 -25.55% $779.68 -$196.40 -25.19% Non-Interventional Nephrologist 0.98 0.96 0.02 2.31% 0.97 0.01 1.42% 0.93 0.05 4.93% 0.89 0.09 10.10% *Percent change can not be calculated, because the average for the sort was zero. Interventional Nephrologist 0.46 0.24 0.22 90.99% 0.27 0.19 70.17% 0.29 0.17 57.34% 0.14 0.32 219.99% Percentage of Total Income Difference Difference Difference Difference Difference Mean Percent Mean Percent Mean Percent Mean Percent Mean Percent Interventional Radiologists 0.60 0.47 0.13 28.98% 0.70 -0.10 -14.29% 0.07 0.53 800.00% 0.17 0.43 260.30% Gross Fees for Service Charges 167.40% 170.10% -2.70% 172.10% -4.70% 173.59% -6.19% 192.43% -25.03% 183.54% -16.14% Vascular Surgeons 0.69 0.63 0.06 9.53% 0.54 0.15 28.92% 0.04 0.65 1556.00% 0.25 0.44 178.19% Net Fees for Service Revenues 88.20% 86.73% 1.47% 85.30% 2.90% 85.26% 2.94% 83.15% 5.05% 80.20% 8.00% Nurse Practitioners/Physician Assistants 0.40 0.38 0.02 6.40% 0.39 0.01 2.87% 0.35 0.05 14.32% 0.28 0.12 41.73% Fees received by the practice and/or Clerical Staff 1.22 1.56 -0.34 -21.81% 1.45 -0.23 -15.99% 1.42 -0.20 -13.82% 1.38 -0.16 -11.60% individuals of the practice for Dialysis Facility Clinical Support Staff 0.92 1.10 -0.18 -16.20% 0.86 0.06 7.52% 0.96 -0.04 -3.86% 0.80 0.12 15.14% Medical Directors 8.00% 9.07% -1.07% 9.71% -1.71% 13.12% -5.12% 10.13% -2.13% 11.61% -3.61% Reimbursement for Research Activity 1.18% 1.03% 0.15% 1.87% -0.69% 0.21% 0.97% 1.43% -0.25% 2.30% -1.12% Ancillary Staff 0.58 0.50 0.08 17.16% 0.58 0.00 -0.77% 0.46 0.12 27.37% 0.21 0.37 171.75% Legal Work 0.07% 0.04% 0.03% 0.11% -0.04% 0.00% 0.07% 0.01% 0.06% 0.14% -0.07% Administrative/Management Staff 0.32 0.43 -0.11 -26.11% 0.38 -0.06 -16.47% 0.40 -0.08 -20.10% 0.36 -0.04 -12.30% Royalties 0.00% 0.00% 0.00% 0.00% 0.00% 0.00% 0.00% 0.00% 0.00% 0.00% 0.00% Satellite Offices 0.62 0.65 -0.03 -3.98% 0.47 0.15 32.80% 0.52 0.10 18.49% 0.35 0.27 74.75% Rents 0.07% 0.05% 0.02% 0.09% -0.02% 0.00% 0.07% 0.01% 0.06% 0.01% 0.06% Dialysis Units Serviced** 1.59 1.77 -0.18 -10.34% 1.37 0.22 16.08% 1.80 -0.21 -11.43% 1.07 0.52 48.25% Other 2.49% 3.07% -0.58% 2.91% -0.42% 1.41% 1.08% 5.27% -2.78% 5.73% -3.24% Hospitals Serviced** 0.99 1.17 -0.18 -15.63% 0.85 0.14 16.94% 1.03 -0.04 -3.54% 0.71 0.28 38.74% Total Other Income 11.80% 13.27% -1.47% 14.70% -2.90% 14.74% -2.94% 16.85% -5.05% 19.80% -8.00% Total Income 100.00% 100.00% 0.00% 100.00% 0.00% 100.00% 0.00% 100.00% 0.00% 100.00% 0.00% Dialysis Patients Serviced** 69.42 82.01 -12.59 -15.35% 76.65 -7.23 -9.43% 93.87 -24.45 -26.04% 102.30 -32.88 -32.14% **This line does not refer to employees per FTE Nephrologist instead it is either units, hospitals, or patients per FTE Nephrologist Comparison of Total Income per FTE Nephrologist Comparison of Number of Employees per FTE Nephrologist $900 2.20 $800 2.00 $700 1.80 Employees per FTE Neph $600 Income (000's) 1.60 $500 1.40 $400 1.20 $300 1.00 $200 0.80 $100 0.60 $0 0.40 Your Practice National East Benchmark Large VAC 0.20 0.00 Non-Interventional Interventional Nephrologist Interventional Radiologists Vascular Surgeons Nurse Clerical Staff Clinical Support Staff Ancillary Staff Admi Comparison of Sources of Total Income per FTE Nephrologist Nephrologist Practitioners/Physician Assistants 100% 90% 80% Percent of Total Income Dialysis Patient Location 70% 60% Percentage of Dialysis Patients Total Other Income* 50% Net Fees for Service Revenue 40% Your Practice National East Benchmark Large 30% Difference Difference Difference Difference Mean Percent Mean Percent Mean Percent Mean Percent 20% In Center 84.54% 85.52% -0.98% 84.23% 0.31% 86.19% -1.65% 88.99% -4.45% 10% At Home 11.32% 8.99% 2.33% 10.05% 1.27% 8.35% 2.97% 4.88% 6.44% Transient 4.14% 5.49% -1.35% 5.72% -1.58% 5.46% -1.32% 6.13% -1.99% 0% Your Practice National East Benchmark Large VAC *Total Other Income includes Fees for Medical Directors, Reimbursement for Research Activity, Legal Work, Royalties, Rents, and Other. 5