Increasing the Value of a Digital Out of Home Network
•
0 recomendaciones•422 vistas

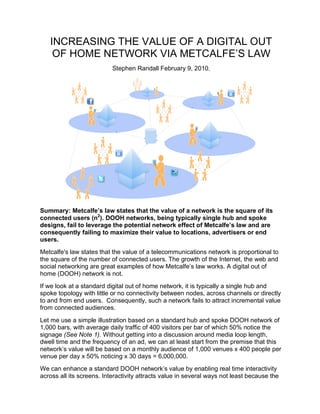
Metcalfe’s law states that the value of a network is the square of its connected users (n2). DOOH networks, being typically single hub and spoke designs, fail to leverage the potential network effect of Metcalfe’s law and are consequently failing to maximize their value to locations, advertisers or end users.

Recomendados
Recomendados
Más contenido relacionado
Más de Stephen Randall
Más de Stephen Randall (19)
Último
Último (20)
Increasing the Value of a Digital Out of Home Network
- 1. INCREASING THE VALUE OF A DIGITAL OUT OF HOME NETWORK VIA METCALFE’S LAW Stephen Randall February 9, 2010. Summary: Metcalfe’s law states that the value of a network is the square of its connected users (n2). DOOH networks, being typically single hub and spoke designs, fail to leverage the potential network effect of Metcalfe’s law and are consequently failing to maximize their value to locations, advertisers or end users. Metcalfe's law states that the value of a telecommunications network is proportional to the square of the number of connected users. The growth of the Internet, the web and social networking are great examples of how Metcalfe’s law works. A digital out of home (DOOH) network is not. If we look at a standard digital out of home network, it is typically a single hub and spoke topology with little or no connectivity between nodes, across channels or directly to and from end users. Consequently, such a network fails to attract incremental value from connected audiences. Let me use a simple illustration based on a standard hub and spoke DOOH network of 1,000 bars, with average daily traffic of 400 visitors per bar of which 50% notice the signage (See Note 1). Without getting into a discussion around media loop length, dwell time and the frequency of an ad, we can at least start from the premise that this network’s value will be based on a monthly audience of 1,000 venues x 400 people per venue per day x 50% noticing x 30 days = 6,000,000. We can enhance a standard DOOH network’s value by enabling real time interactivity across all its screens. Interactivity attracts value in several ways not least because the
- 2. network operator can now promote measurable and interactive media and the venue owners can provide more engaging venue experiences and/or reduce perceived wait time. Clearly, if users are interacting with media on such a network, advertisers will be more likely to prize that network above a similar sized network without interactivity - another way of saying “attention is the currency”. To be conservative, we will assume a user response rate in venues of 2% (See Note 2). If we now enable all real time interactive messages to be displayed on all of the network’s screens, we have what we could call a fully connected DOOH network. The potential value of the fully connected DOOH network has been enhanced over the standard DOOH network by enabling 120,000 venue interactions per month (1,000 venues x 400 people per venue per day x 50% noticing x 2% interacting x 30 days). Taking a real world example and a typical configuration for LocaModa’s place based social media applications such as Wiffiti (see LocaModa.com/apps) imagine a standard DOOH network with a New York bar displaying local messages about the Yankees and a Boston bar displaying local messages about the Red Sox. Now imagine a fully connected DOOH network in which both the New York and Boston bar screens display all Yankees and Red Sox messages. Clearly the latter example encourages more attention and interaction and, by being more engaging, is more valuable. The value of the fully connected DOOH network can be further enhanced by connecting network messages to relevant external sources of real time user generated content. Social networks such as Twitter and Facebook are good sources of this content, especially if there are advertisers’ fan pages, pages related to specific local topics (e.g. the Red Sox or Yankees) or even pages related to music playing in a venue. In practice, when connecting DOOH networks to such external sources, between 75-90% of the live messages are likely to be from those external sources (See Note 3). Once again, from experience, we can assume that the actual mix of local to external live messages will depend on the messaging application’s configuration for message type, origination, search topics or tags etc, but to be conservative, we will assume 75% of real time messages come from external sources. Taking the average “social graph” (the number of friends people have on social networks) of 120 (See Note 4) and assuming that the number of friends within the social graph actually noticing or
- 3. even responding to specific venue messages is 5%, (See Note 5,) the additional addressable audience can be calculated as 120,000 live messages per month x 75% via social networks x 120 social graph x 5% noticing = 540,000. Extending the range of place-based screens from a few feet to many miles by enabling a more connected user experience, increases the value of digital out of home networks. We might argue about the actual incremental value but if Network A is not connected and has a smaller audience, and Network B is connected and has a larger audience, not to mention the freshness and dynamic nature of real time, user generated, interactive content; which network do you think a brand or agency would rather buy? Add in the resultant measurability of the connected network and the argument becomes even more one sided. The truth today is that most DOOH networks are failing to optimize the potential network effect of Metcalfe’s law. Successful digital out-of-home networks will be those that are or plan to leverage a connected strategy. Note 1. Adjusted to take into account OVAB considerations. Note 2. LocaModa sees between 2%-33% response rates in venues depending on the type of venue, the demographic of the audience, the nature of the call to action and time/day. To be conservative the model assumes 2% Note 3. LocaModa typically sees between 75%-90% venue messaging coming from the web inc social networks. To be conservative, the model assumes 75%. Note 4. Twitter's social graph is 126. Source: The Guardian June 29th 2009. Facebook's social graph is 130. Source: Facebook Note 5. Social Network Response = 3 x Generic Call-to-Action = 5.4% (Source: Jupiter Research.) Also see Making The Most of Mobile Marketing. S.Randall June '08. To be conservative, the model assumes 5%. Furthermore, the model does not include any 2nd order impact of social graphs or other connected media such as brand websites or fan pages which would further extend audience.