Vision - Brochure
•
0 recomendaciones•192 vistas

Vision - a Banking Performance Analyzer

Recomendados
Más contenido relacionado
Destacado
Destacado (16)
Vision - Brochure
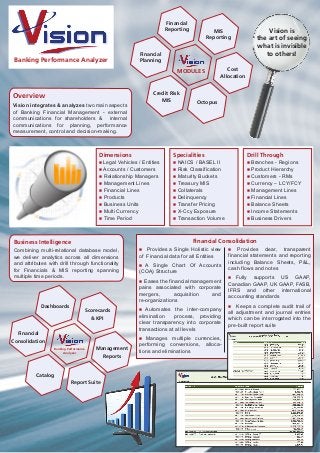
- 1. Financial Reporting MIS Vision is Reporting the art of seeing what is invisible Financial to others! Banking Performance Analyzer Planning MODULES Cost Allocation Overview Credit Risk MIS Octopus Vision integrates & analyzes two main aspects of Banking Financial Management - external communications for shareholders & internal communications for planning, performance measurement, control and decision-making. Dimensions Specialities Drill Through Legal Vehicles / Entities NAICS / BASEL II Branches - Regions Accounts / Customers Risk Classification Product Hierarchy Relationship Managers Maturity Buckets Customers - RMs Management Lines Treasury MIS Currency – LCY/FCY Financial Lines Collaterals Management Lines Products Delinquency Financial Lines Business Units Transfer Pricing Balance Sheets Multi Currency X-Ccy Exposure Income Statements Time Period Transaction Volume Business Drivers Business Intelligence Financial Consolidation Combining multi-relational database model, Provides a Single Holistic view Provides clear, transparent we deliver analytics across all dimensions of Financial data for all Entities financial statements and reporting and attributes with drill through functionality including Balance Sheets, P&L, A Single Chart Of Accounts for Financials & MIS reporting spanning cash flows and notes (COA) Structure multiple time periods. Fully supports US GAAP, Eases the financial management Canadian GAAP, UK GAAP, FASB, pains associated with corporate IFRS and other international mergers, acquisition and accounting standards re-organizations Dashboards Keeps a complete audit trail of Scorecards Automates the inter-company all adjustment and journal entries & KPI elimination process, providing which can be interrogated into the clear transparency into corporate pre-built report suite transactions at all levels Financial Manages multiple currencies, Consolidation performing conversions, alloca- Banking Performance Management tions and eliminations Analyzer Reports Catalog Report Suite
- 2. Interactive Dashboards Dynamic updates Performance Reports with Alerts / Exceptions Customized dashboards by roles & functions Mobile device compatible Business rule defined security levels Graphic representation of targets / goals Performance analysis with alerts / exceptions Review causes / effects of +/- variances Drill through dashboards Move across and between reports Multi-layer analytics to transaction level Key business drivers updated daily Scorecards & KPI Individual Performance Measurement Volume on funded & non- funded products Single Source of Information Corporate client’s Net Asset Worth Key business drivers & parameters Current month profitability distribution A Relationship Manager’s YTD earnings from various sources Performance Sheet Facilities utilized by top 10 accounts The Top 10 Customers in RM Portfolio ROA & other key indicators of key clients Management Reports Catalog True Performance Measurement Services adhoc report requirements Consistent & timely reports Security based on role and profile Create and distribute boardroom Access and analyze across data quality reports on mobile device warehouse Provide secure report access to all Save & share report definitions users over the web or email Distribute to peers via email Account / Product level profitability “What if” analysis for multi- dimensional analysis Reports: Trends and Variance Report Suite analysis 200+ pre-configured reports Triggers with alerts and exceptions Across business & financial needs Customized profiles and security levels Events & Trigger based reports Supports PDF, XLS, CSV and mobile Drill through analytics across dimensions Banking Performance Analyzer DUBAI INDIA marketing@sunoida.com | www.sunoida.com