

Recomendados
Más contenido relacionado
La actualidad más candente
La actualidad más candente (17)
Similar a Experience Matters: Insights for Growing Retail Businesses
Similar a Experience Matters: Insights for Growing Retail Businesses (20)
Más de Sumit Roy
Más de Sumit Roy (20)
Experience Matters: Insights for Growing Retail Businesses
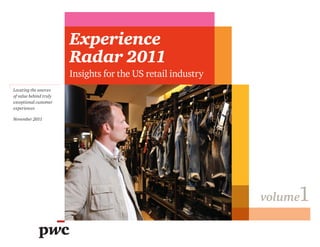
- 1. Experience Radar 2011 Insights for the US retail industry Locating the sources of value behind truly exceptional customer experiences November 2011 1 volume
- 2. Experience matters Economic conditions are forcing retailers • Experience segments are those About Experience Radar to identify new ways to set themselves apart from the competition. Delivering a distinctive, customer segments that appear once respondents are grouped together by the brand-defining customer experience is features they value, their demographics, PwC’s Experience Radar helps businesses search out and find a powerful solution. and behavioral profiles. the often hidden sources of value that drive truly exceptional, differentiating customer experiences. Experience Radar points the way to value— Indeed, companies that design true, differ- entiating experiences around their products and profits—by honing in on ways to enhance By helping retailers rank shopping features by relative how you serve all your customers, but par- and services often win in the marketplace importance to their customers and potential economic benefit ticularly those customers most in search of an while enjoying a price premium over the to themselves, Experience Radar locates opportunities to experience that’s second to none. competition. create value—pointing the way toward both top-line growth and bottom-line results. We hope you find this year’s report useful in This year’s Experience Radar insights report is intended to help you do just that—win growing your business. This year’s study measures the experiences of about 6,000 in the marketplace by delivering a customer US consumers across 11 industries.1 The Experience Radar Best, experience that attracts new profitable assigns value to a broad set of customer experience attributes customers, keeps the ones you’ve got, and broken down into industry-specific elements and then ranked increases margins. by what target segments value most. Experience Radar helps you locate two Our methodology employs an advanced conjoint survey tech- Paul D’Alessandro elements critical to pleasing your customers nique to reveal insights that can be honed to extreme precision. PwC US Customer Impact Leader and growing your business: experience Other, more traditional customer experience studies typically enhancers and experience segments. do not tie to “hard economics” like value measures, price elasticity and churn metrics. Experience Radar does. • Experience enhancers are those market insights that—when translated While the results outlined in this report are at the industry into practical actions—can create value level, PwC can use this same methodology to develop an Tom Puthiyamadam for your customers. Experience Radar study that is customized to your business. PwC US Customer Impact Leader 1 Retail (apparel, footware & consumer electronics), Retail Banking, Payments, Healthcare Provider, Health Insurance, Airlines Leisure, Airlines Business, Hotels Leisure, Hotels Business, P&C Insurance, and Life Insurance Experience Radar 2011 | US Retail Industry 1
- 3. Questions the 2011 Experience Radar helps Which channels do my you answer customers prefer? How can I drive customer loyalty and repeat purchase? How should I be grouping and targeting my customers? What aspects of in-store interactions do my shoppers value? What shopping features are my customers most willing to pay for? Experience Radar 2011 | US Retail Industry 2
- 4. Table of contents volume 1 Insights for the 3 Experience attributes measured US retail industry 5 Impact of most critical shopping features 6 The 5 experience enhancers Industry ironies uncovered 11 About moments of truth 16 The big picture—mapping out a game plan for retailers 19 20 The 5 experience segments Comparing the experience segments 26 Experience Radar 2011 | US Retail Industry 3
- 5. Experience Radar measures the core attributes of customer experience ACCESSIBILTY 1 SUPPORT 2 QUALITY 3 Ease of accessing Ease of obtaining Accuracy, speed, and using an service help, both breadth and offering before and after purchase R value of an offering #1 & PRESENTATION 4 SOCIAL BELONGING 5 5 Aesthetics, Enhancement of The core attributes of arrangement and description of customer’s personal brand and connection retail customer experience an offering e with others _ Experience Radar 2011 | US Retail Industry 4
- 6. Experience Radar uncovers the impact of experiences Hit your margin targets directly with Aces, but don’t overlook the impact of the rest Experience Radar ranks shopping features by Customer value vs. the economic impact on retailers7 relative importance to customers as well as Refund policy High Checkout process potential economic impact on retailers. The chart Issue resolution Customer value perception5 on the right maps each of the features measured Shipping options by their value to both groups. The features Table Stakes 2 Aces 1 fall into four categories that—in the game of Fold Wild Cards Store setting Store location retailing—we call aces, wild cards, table Product information Multi-channel access stakes, and fold. Ace features can help you hit Low Staff attitude3 Reward points 4 your margin targets, while other features can Low Company value realization6 High drive emotional goodwill and generate ancillary 1 Nice to have features with moderate to high economic returns benefits across the organization. 2 Must have features with low economic returns 3 Feature drives emotional goodwill & long-term gains 4 Feature generates benefits for other parts of the organization 5 Relative feature importance assigned by customers 6 Incremental feature margin contribution assuming 11% EBITDA/Sales margin average in calculation (High = 10-13%, Medium = 5-9% and Low = 0-4%) 7 Product Comparison and Price Adjustment Features not displayed due to low retailer impact and customer value Experience Radar 2011 | US Retail Industry 5
- 7. 2011 experience enhancers Growing your business EXPERIENCE ENHANCER 1 EXPERIENCE ENHANCER 2 EXPERIENCE ENHANCER 3 by designing and Understand Make your Create opportunities delivering exceptional that points don’t customers brand by helping your customer experience mean loyalty, experience does ambassadors so good deeds get customers avoid risk proper attention EXPERIENCE ENHANCER 4 EXPERIENCE ENHANCER 5 Embrace the When something anytime, anywhere bad happens, fix it economy Experience Radar 2011 | US Retail Industry 6
- 8. Understand that points EXPERIENCE ENHANCER 1 don’t mean loyalty, experience does “[The] salesman went out of his way to bring me matching Rewards programs alone don’t lead to loyalty. It’s Loyalty can’t be bought. It must be earned. outfits …[he] made me feel so born from experiences that create psychological Loyalty programs don’t result in long-term important that I returned to that connections. A loyalty program can provide the relationships—what does is friendly, helpful service and the people behind it. store in the future.” data to orient you to customer needs, then front-line staff create experiences that deliver on those needs. Loyalty programs ranked last Last Shoppers’ ranking of 55% 21% 14% Loyalty Programs 7% 2% 1% loyalty programs relative Brand Past to other purchase drivers Price Experience Convenience Recommendations When survey respondents were asked to rank factors influencing purchase decisions, loyalty programs ranked last.1 1 Sample size n = 587 Experience Radar 2011 | US Retail Industry 7
- 9. Understand that points EXPERIENCE ENHANCER 1 don’t mean loyalty, experience does Rewards programs alone don’t lead to loyalty. It’s Instead of investing in costly Invest in training knowledgeable staff to loyalty programs, focus on prevent buyer’s remorse. Shoppers utilize staff born from experiences that create psychological customer service. knowledge to affirm purchase decisions— product knowledge and recommendations connections. A loyalty program can provide the Over half of shoppers cite friendly account for almost 1/3rd of good experiences staff assistance as the key to winning data to orient you to customer needs, then front-line related to support. or losing them. staff create experiences that deliver on those needs. Break-down of good experiences1 2% 2% 100% 80% “Asked three different clerks for 40% 60% help in finding wire cutters and 40% they all sent me to the wrong 56% 20% place…was so angry that I left.” 0% Good Presentation Accessibility 3% Quality Support 31% 67% Staff friendliness Staff recommendations Others 1 Sample size n = 258 Experience Radar 2011 | US Retail Industry 8
- 10. Make your customers EXPERIENCE ENHANCER 2 brand ambassadors so good deeds get the attention they deserve Encourage consumers to own the brand with Customers—like all of us—are Younger generations prefer social media you and create a shared experience outside your social beings, seeking connection 7% and community. walls. Identify, incentivize and promote your A good experience with you, and they can brand ambassadors. 17% be your best marketers—a bad experience, Age 50+ and the damage can be wide-spread. 23% • Amplify positive experiences by creating Age 33–49 brand ambassadors. • Not all age groups are equal—though Age 18–32 sharing experiences in-person and via phone is popular, younger generations prefer social media roughly 3x more than older ones. Develop a cross-channel platform to allow ambassadors to easily spread the word. 90% • Facilitate older brand ambassadors to host community-based events [The] salesperson was with personal networks willing to recommend retailer condescending …[it] cost the • Create viral campaigns using social media tools like Facebook, store $500 in sales … and I Foursquare & Twitter to help younger after a good experience brand ambassadors generate buzz told everyone about it.” 1 Sample size n = 1058 Experience Radar 2011 | US Retail Industry 9
- 11. Make your customers EXPERIENCE ENHANCER 2 brand ambassadors so good deeds get the attention they deserve Shoppers share experiences immediately: half of shoppers share negative experiences “Salesperson was condescending with friends/family within a week of and cost the store $500 in sales Encourage consumers to own the brand with occurrence. ... and I told everyone about it.” you and create a shared experience outside your In fact, some people have bad experiences that walls. Identify, incentivize and promote your they never forget—and never stop sharing— which can cost you sales and customers. brand ambassadors. Life span of memorable experiences 70% 60% 50% All experiences fade over time, however 1.2x more bad than good experiences linger forever 40% 30% 20% 1.6x 10% 0% A week A month 6 months A year 5 years 10 years 15 years 20 years 25 years Forever Likelihood of having a good Bad experiences Good experiences rather than bad experience Leverage brand ambassadors to reduce potential impact by creating feedback loops to hear from them first. Experience Radar 2011 | US Retail Industry 10
- 12. Some industry ironies surfaced by this year’s Experience Radar 8to12% can gain by offering free shipping yet 59% of additional margin1 opportunity retailers retailers charge for shipping products2 72% of consumers are unwilling to repurchase from retailers who fail to resolve their issues yet 69% of customers The big question: say they’re dissatisfied by retailers’ resolution of bad service What might this mean for the future of your business? Last purchase drivers3 yet 95% of retailers have—or Shoppers’ ranking of loyalty programs relative to other plan to have—a loyalty rewards program4 1 Calculations based on elasticity measures from the survey and 11% EBITA/Sales industry margin average 2 Source: Comscore 2010 Survey 3 Purchase drivers: Price, Personal Experience, Convenience, Store/Brand, Recommendations, Loyalty/Rewards Programs 4 Source: Retail Horizons—Benchmark 2011 Experience Radar 2011 | US Retail Industry 11
- 13. Create opportunities EXPERIENCE ENHANCER 3 by helping your customers avoid risk comScore reports 2out of 3 1 Weak economic conditions have heightened consumers’ sensitivity Retailers can win in this economy by minimizing to risk. psychological hurdles and helping risk averse Retailers can attract new customers and increase basket size by providing features consumers make purchase decisions. that help customers overcome psychological are likely to cancel purchase hurdles. without free shipping 3 5 Overcome shoppers’ worries about losing money on shipping and press the emotional hot-button of free things. out of Shipping options Free shipping Value of free shipping spikes despite higher feature price. Hook customers value a flexible return policy Customer value Free with via free shipping options $75 purchase Additional shipping charge Feature improvements 4out of 5 value free shipping and can result in a margin opportunity of 8–12% on goods 1 “State of the US Retail Economy in Q1 2011.” ComScore, 17 May 2011. Experience Radar 2011 | US Retail Industry 12
- 14. Create opportunities EXPERIENCE ENHANCER 3 by helping your customers avoid risk Further reduce customer Personal history breeds familiarity—it purchase anxiety with a flexible emerged as the top driver, of where to shop Retailers can win in this economy by minimizing return policy. after price. Providing free trial periods for products lessens purchase risk and allows psychological hurdles and helping risk averse Benefits to you outweigh the cost as 3 out of shoppers to own it for a short period. When 5 value a flexible return policy, and a typical consumers make purchase decisions. shopper is willing to pay a 5% premium on it’s time to pay up or let go, it seems easier to part with the money than the product, goods to extend return window to 3 months. playing into the endowment effect. Flexible return policy Three month returns Extended policy offers high emotional returns for nominal effort Customer value Two week returns All sales final Feature improvements 10x Past experience influences purchase over recommendations Experience Radar 2011 | US Retail Industry 13
- 15. Embrace the anytime, EXPERIENCE ENHANCER 4 anywhere economy Your customers are shopping online and offline, Customers shop at home, “Discovered a ‘must have’ coat on-the-go, and in your stores. whether at their homes, on-the-go, or in your stores. online, but the store I usually Cannibalize your own channels before Understand their shopping preferences before someone else does by providing options to use was sold out. So I called research, purchase wherever shoppers are. someone else does. another store, and they called Most shoppers are not channel loyal- ists—40% value the option to shop across other stores, and—somehow— 40% channels (web, mobile and in-store) over one channel. they found it … g reat service!” Shoppers want the flexibility to research via one channel and purchase via another: Develop a multi-channel strategy that makes “When buying a TV, salesperson was very it easy for customers to move between chan- helpful and accommodating to answer all nels. Consider partnerships to reduce up-front of our questions even after they found out investment costs and allow for piloting. we’d be buying online.” value the option to shop across channels (web, mobile Multichannel access Store, web, mobile People value brick-and-mortar over web alone Store only and in-store) over one channel desiring the option to touch and try products Customer value Web, mobile Feature improvements Experience Radar 2011 | US Retail Industry 14
- 16. Embrace the anytime, EXPERIENCE ENHANCER 4 anywhere economy Your customers are shopping online and offline, Customers increasingly are using mobile applications at the store to obtain product whether at their homes, on-the-go, or in your stores. and pricing information and make purchase decisions. The number of shoppers who Understand their shopping preferences before value access to information in stores someone else does. nearly doubles those who value informa- tion provided via ads. Production information Info via instore QR codes 46% of respondents value information Customer value provided in stores Info via ad QR codes None Feature improvements 8% Premium shoppers are Explore technology investments and mobile tools that provide instant access to product information and reviews to facilitate imme- diate purchase. willing to pay to interact with a product in a store Experience Radar 2011 | US Retail Industry 15
- 17. Moments of truth Powerful events in 59% On the flip slide, create a negative moment the lives of consumers of truth and you have a brand detractor. that often define their attribute negative MOTs opinion of a retailer to unfriendly, unhelpful staff A positive moment of truth (MOT) can 38% create a loyal customer The words used most often by those describing a positive moment of truth attribute positive MOTs to friendly, helpful staff The words used most often by those describing a negative moment of truth Experience Radar 2011 | US Retail Industry 16
- 18. When something bad EXPERIENCE ENHANCER 5 happens, fix it Customers often won’t tell you they’re not happy. No one is perfect. Find out. And when you do, make sure they’re But if you don’t provide your customers channels for feedback, you may not know happy with the results—an apology may be enough they aren’t happy until they leave. to create an evangelist. People aren’t talking to you. But people are talking about you. 49% don’t tell a retailer about their bad experiences 50% + 19% = 69% First week Next 3 weeks “My computer died. I called and they delivered a new one within Bad experiences shared within a month 24 hours … Excellent service— no questions.” Experience Radar 2011 | US Retail Industry 17
- 19. When something bad EXPERIENCE ENHANCER 5 happens, fix it Customers often won’t tell you they’re not happy. Find out how your customers are feeling. Find out. And when you do, make sure they’re When you hear about a bad experience, fix happy with the results—an apology may be enough it—3 out of 5 are satisfied with an apology or compensation. to create an evangelist. You can increase the likelihood of repeat purchases with a simple fix. Issue resolution We go out of our way Most are satisfied with a simple gesture— so going above-and-beyond provides Customer value minimal added value We do our best You are on your own Feature improvements 88% willing to return to a retailer that apologized following a bad experience Experience Radar 2011 | US Retail Industry 18
- 20. Mapping out a How to address your challenges “game plan” for 1 2 Sales retailing eg y & M at ark Str 5 eting Organization ti o y & ra olo g ns An ly tic h a n s Te c p e O 4 3 Issues Recommendations 1 • Low customer retention • Revise go-to-market strategy So, just how might all of • Channel cannibalization • Identifying profitable revenue growth • Simulate customer response to changes prior to investment • Develop channel strategy this fit together? Here’s one 2 • Ineffective customer targeting • Low customer engagement • Create needs based segmentation • Develop customer engagement strategy • Product mix complexity • Simplify product mix attempt at a game plan that 3 • Impersonal customer experiences • Deploy personalization capabilities • Lack of sales force effectiveness • Create digital tools to track shopper behavior pulls it all together. • Increasing servicing costs • Develop digital sales force strategy and servicing strategy 4 • Impersonal customer experiences • Develop Voice of the Customer program to uncover • Multiple and disparate views of customers product, customer servicing and marketing insights • Centralize customer information into single view 5 • Disjoint customer experience • Redesign organization to support experience goals • Misaligned staff behavior with experience goals • Develop metrics and incentives structure aligned • Ineffective post sales support with experience goals • Ensure accountability of experience goals Experience Radar 2011 | US Retail Industry 19
- 21. 2011 experience segments Experience Radar’s How’s it different? Unlike traditional market segmentation How’s it done? Respondents are pooled and divided into customer segmentation which is usually based purely on demo- graphics, Experience Segments—the clusters based upon the shopping features they value, behavioural dimensions (like usage rate market segment groups identified by and loyalty, etc.) and some demographic data. Experience Radar—are defined by the types of experiences they value. How can I use it? The Experience Segments identified in this report help you target your experience- based offerings toward those who will value them most. EXPERIENCE SEGMENT 1 EXPERIENCE SEGMENT 2 EXPERIENCE SEGMENT 3 EXPERIENCE SEGMENT 4 EXPERIENCE SEGMENT 5 The 5 experience segments Experience Radar 2011 | US Retail Industry 20
- 22. Meet “Up & Coming EXPERIENCE SEGMENT 1 Ashton” He’s a young city dweller who shops frequently. He values free shipping more than any other shopping feature and is a heavy user of social media. In fact, Ashton values free shipping and uses social media more than any of the other four retail segments described in this report. AGE TOP PROVIDERS TOP FEATURES Gen Y (18–32) • Amazon • Free shipping • Best Buy • Mainstream brand access INCOME • Walmart $50–74k GENDER TOP ATTRIBUTES ADDITIONAL Equal • Social Belonging • Highest online and offline shopping frequency • Quality URBANICITY • Highest monthly (+) and (-) Major city MOT frequency • Highest satisfaction rate with (-) MOT resolution through apology or compensation Experience Radar 2011 | US Retail Industry 21
- 23. Meet “Quality Cautious EXPERIENCE SEGMENT 2 Nick” He’s among those most reluctant to switch from a current provider he’s happy with to try something new. Nick (along with “Risk Averse Harold”, who’s described later) finds design elements that ensure quality and reduce actual—or perceived—risk attractive. AGE TOP PROVIDERS TOP FEATURES Gen Y (18–32) • Amazon • Extended refund policy • Best Buy • Attendant check-out INCOME • Nordstrom $75–99k GENDER TOP ATTRIBUTES ADDITIONAL Equal • Quality • Highest percent of people unwilling to switch from current retailers • Social Belonging URBANICITY Major city Experience Radar 2011 | US Retail Industry 22
- 24. Meet “Value Seeking EXPERIENCE SEGMENT 3 Britney” Despite having the lowest income of the group, and living in the smallest city or own, she is brand-conscious and enjoys shopping at stores like Target. AGE TOP PROVIDERS TOP FEATURES Gen X (33–49) • Amazon • Attendant check-out • Walmart • Mainstream brand access INCOME • Target $25–74k GENDER TOP ATTRIBUTES Female skewed • Social Belonging • Accessibility URBANICITY Small city and town Experience Radar 2011 | US Retail Industry 23
- 25. Meet “Support Diva EXPERIENCE SEGMENT 4 Hilda” She has the highest percentage of disposable income of the group and is also the most willing to switch providers for a better experience. She values hassle-free problem resolution more than any other shopping feature—and more than any of the other four segments described in this report. AGE TOP PROVIDERS TOP FEATURES Gen X & Y (18–49) • Nordstrom • Hassle-free issue resolution • Others • Extended return policy INCOME • Best Buy $100k+ GENDER TOP ATTRIBUTES ADDITIONAL Female skewed • Quality • Highest percent of people willing to switch from current retailers • Support URBANICITY Suburb near major city Experience Radar 2011 | US Retail Industry 24
- 26. Meet “Risk Averse EXPERIENCE SEGMENT 5 Harold” He doesn’t like surprise (and along with Quality Conscious Nick) is attracted to design elements that ensure quality and reduce actual or perceived risk. AGE TOP PROVIDERS TOP FEATURES Baby Boomer (50–65) • Others • Attendant check-out • Walmart • Extended refund policy INCOME $50–74k GENDER TOP ATTRIBUTES Equal • Social Belonging • Accessibility URBANICITY Suburb near major city Experience Radar 2011 | US Retail Industry 25
- 27. Comparing the experience segments EXPERIENCE SEGMENT 1 EXPERIENCE SEGMENT 2 EXPERIENCE SEGMENT 3 EXPERIENCE SEGMENT 4 EXPERIENCE SEGMENT 5 Up & Coming Quality Cautious Value Seeking Support Diva Risk Averse Ashton Nick Britney Hilda Harold (N=43, 7%) (N=185, 32%) (N=84, 14%) (N=143, 24%) (N=132, 22%) Age Gen Y Gen Y Gen X Gen X & Y Baby Boomers (18–32) (18–32) (33–49) (18–49) (50–65) Income $50–74k $75–99k $25–74k $100k+ $50–74k EXPERIENCE SEGMENT 1 EXPERIENCE SEGMENT 2 EXPERIENCE SEGMENT 3 Gender Urbanicity Equal Major city Equal Major city Female skewed Small city and town Female skewed Suburb by major city Equal Suburb by major city Top Providers • Amazon • Amazon • Amazon • Nordstrom • Others • Best Buy • Best Buy • Walmart • Others • Walmart • Walmart • Nordstrom • Target • Best Buy Top Attributes • Social Belonging • Quality • Social Belonging • Quality • Social Belonging • Quality • Social Belonging • Accessibility • Support • Accessibility Top Features • Free shipping • E xtended refund • Attendant • Hassle-free • Attendant policy check-out issue resolution check-out • Mainstream brand access • Attendant • Mainstream brand • Extended return • Extended refund check-out access policy policy EXPERIENCE SEGMENT 4 EXPERIENCE SEGMENT 5 Additional • Highest online and offline shopping • Highest percent of people unwilling • Highest percent of people willing frequency to switch from to switch from current retailers current retailers • Highest monthly (+) and (-) MOT frequency • Highest satisfaction rate with (-) MOT resolution through apology or compensation Experience Radar 2011 | US Retail Industry 26
- 28. We hope these insights prove useful to your business While the results outlined in this report are at the industry level, PwC can use the same methodology we’ve used here to develop an Experience Radar study that is customized to your business. If you’d like to discuss these findings or how PwC can help you apply them to your business, contact: Paul D’Alessandro (312) 298-6810 pmd@us.pwc.com Tom Puthiyamadam (646) 471-1490 thomas.puthiyamadam@us.pwc.com Experience Radar 2011 | US Retail Industry 27
- 29. © 2011 PricewaterhouseCoopers LLP, a Delaware limited liability partnership. All rights reserved. PwC refers to the US member firm, and may sometimes refer to the PwC network. Each member firm is a separate legal entity. Please see www.pwc.com/structure for further details. This content is for general information purposes only, and should not be used as a substitute for consultation with professional advisors. PwC US helps organizations and individuals create the value they’re looking for. We’re a member of the PwC network of firms with 160,000 people in more than 150 countries. We’re committed to deliver quality in assurance, tax and advisory services. Tell us what matters to you and find out more by visiting us at www.pwc.com/us. NY-12-0283