
Recommended
More Related Content
What's hot
What's hot (20)
Similar to Assignment vos
Similar to Assignment vos (20)
Recently uploaded
Recently uploaded (20)
Assignment vos
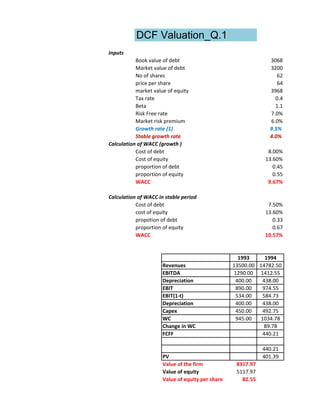
- 1. DCF Valuation_Q.1 Inputs Book value of debt 3068 Market value of debt 3200 No of shares 62 price per share 64 market value of equity 3968 Tax rate 0.4 Beta 1.1 Risk Free rate 7.0% Market risk premium 6.0% Growth rate (1) 9.5% Stable growth rate 4.0% Calculation of WACC (growth ) Cost of debt 8.00% Cost of equity 13.60% proportion of debt 0.45 proportion of equity 0.55 WACC 9.67% Calculation of WACC in stable period Cost of debt 7.50% cost of equity 13.60% propotion of debt 0.33 proportion of equity 0.67 WACC 10.57% 1993 1994 Revenues 13500.00 14782.50 EBITDA 1290.00 1412.55 Depreciation 400.00 438.00 EBIT 890.00 974.55 EBIT(1-t) 534.00 584.73 Depreciation 400.00 438.00 Capex 450.00 492.75 WC 945.00 1034.78 Change in WC 89.78 FCFF 440.21 440.21 PV 401.39 Value of the firm 8317.97 Value of equity 5117.97 Value of equity per share 82.55
- 2. Here, given Market Price = Rs. 64 whereas the Intrinsic Value = Rs. 82.55. Therefore, the share price is undervalued and is r
- 3. 1995 1996 1997 1998 16186.84 17724.59 19408.42 21252.22 1546.74 1693.68 1854.58 2030.77 479.61 525.17 575.06 629.70 1067.13 1168.51 1279.52 1401.07 640.28 701.11 767.71 840.64 479.61 525.17 575.06 629.70 451.00 493.85 452.00 494.94 1133.08 1240.72 1358.59 1487.66 98.30 107.64 117.87 129.07 482.02 527.82 577.96 632.87 10023.05 482.02 527.82 577.96 10655.91 400.76 400.13 399.51 6716.19
- 4. rice is undervalued and is recommended to BUY.
- 5. DCF Valuation_Q.2 Inputs Beta 1.15 Debt/(Debt+Equity) 20% Health Division Cost of Debt 7.50% Tax rate 40% T-Bond Rate (Rf) 7% Market Risk Premium 5.5% Assuming A. Calculation for WACC (Health Division) Cost of Equity 13.33% Cost of Debt 4.50% Proportion of Debt 0.2 Proportion of Equity 0.8 Tax Rate 40% WACC 11.56% B. Calculation Of Valuation of the Division Growth Rate 6% Stable Growth Rate 1993 1994 1995 1996 Revenue 5285 5602.10 5938.23 6294.52 EBIT 560 593.60 629.22 666.97 EBIT(1-T) 336 356.16 377.53 400.18 Capex 420 436.80 454.27 472.44 Depriciation 350 364.00 378.56 393.70 FCFF 266 283 302 321 FCFF 283 302 321 PV 254.00 242.51 231.51 Value Of the Division 4062
- 6. 4% 1997 1998 6672.19 7072.52 706.99 749.41 424.19 449.64 491.34 510.99 409.45 425.83 342 364 5014 342 5378 220.99 3112.54
- 7. DCF Valuation_Q.3 Inputs EPS 0.85 Revenue per share 12.5 Working Capital 40% of Revenue WC 5 Growth Rate 20% Declining Growth Rate 5% Beta 1.1 Risk Free rate 7% Market Risk Premium 6% Debt Ratio 15% Equity Ratio 85% Cost of Debt 7.5% Assuming WACC Calculation Cost of Debt 7.5% Proportion of Debt 0.15 Tax Rate 40% Cost of Equity 13.05% Proportion of Equity 0.85 WACC 11.77% A. Calculation of FCFE Growth Rate 20% 1993 1994 Revenue 12.50 15.00 Earning 0.85 1.02 Working Capital 5.00 6.00 Change in WC 1.00 Working capital*(1-Debt Ratio) 0.85 FCFE 0.17 PV 0.15 Value Per Share 13.14 B. There might be potential for synergy, with an acquirer with related businesses. The health C. Sensitivity Analysis of valuation with Working Capital change
- 9. 40% Debt Ratio 0.15 Decline Rate 5% 15% 10% 5% 1995 1996 1997 1998 1999 2000 2001 18.00 21.60 25.92 31.10 35.77 39.35 41.31 1.22 1.47 1.76 2.12 2.43 2.68 2.81 7.20 8.64 10.37 12.44 14.31 15.74 16.53 1.20 1.44 1.73 2.07 1.87 1.43 0.79 1.02 1.22 1.47 1.76 1.59 1.22 0.67 0.20 0.24 0.29 0.35 0.85 1.46 2.14 27.92 0.16 0.17 0.18 0.19 0.41 0.62 11.27 ith related businesses. The health division at Kodak might also be mismanaged, thereby creating the potential for additional Using Data Table WC as a % of Revenue Valuation
- 10. 40% 13.141 10% 15.959 20% 13.672 30% 11.385 35% 10.241 40% 9.097 45% 7.954 50% 6.810 60% 4.523 70% 2.236 85% -1.195 90% -2.339
- 11. DCF Valuation_Q.4 Inputs EPS 0.56 Revenue per share 2.91 Capex 13% Depriciation 8% Working Capital 60% of revenue 0.60 WC 1.746 Calculation of WACC at Growth stage Debt 0.100 Equity 0.900 Beta 1.45 T-Bond rate 7.00% Market Risk Premium 6.00% Assuming Interest rate 7.50% Assuming Tax Rate 40.00% Cost of Equity 15.70% Cost of Debt 7.50% WACC 14.58% Calculation of WACC at Stable stage Beta 1.10 Equity 0.90 Debt 0.10 T-Bond Rate 7.00% Market Risk Premium 6.00% Interest rate 7.50% Tax rate 40.00% Cost Of Equity 13.60% Cost of Debt 7.50% WACC 12.69% Growth Rate Estimation Growth rate from 1994-1998 17.00% Growth Rate From 1998 to 2003 2.40% Growth Rates 1999 2000 2001 14.60% 12.20% 9.80% WC Rate Calculation WC 60% From 1994-1998 Rate from 1998-2003 6% WC as a % of Revenue 1999 2000 2001 54% 48% 42%
- 12. A. Calculation of FCFE 1993 1994 1995 Revenue 2.91 3.40 3.98 EPS 0.56 0.66 0.77 Capex 0.13 0.15 0.18 Depriciation 0.08 0.09 0.11 Working Capital 1.75 2.04 2.39 Change in WC 0.30 0.35 FCFE 0.34 0.40 FCFE 0.34 0.40 PV 0.30 0.30 Value Per Share 3.66 Note Capital Expenditure and Depriciation offsets each other in tha stable stage.So they are n B. Working Capital stays 60% of Revenue forever 0.6 Discount Rate 0.1458 Calculation for Working Capital 1993 1994 1995 Revenue 2.91 3.4047 3.983499 EPS 0.56 0.6552 0.766584 Capex 0.13 0.1521 0.177957 Depriciation 0.08 0.0936 0.109512 Working Capital 1.746 2.04282 2.390099 Change in working Capital 0.29682 0.347279 FCFE 0.344772 0.403383 FCFF 0.344772 0.403383 PV 0.297988 0.301336 Valuation Per Share 10.95546 C. Beta remains 1.45 forever If the beta remains 1.45, then the discount rate would be the cost of equity at beta 1.45 i.e Cost of Equity 0.157 1994 1995 1996 FCFE 0.344772 0.403383 0.471958
- 13. FCFE 0.344772 0.403383 0.471958 PV 0.297988 0.301336 0.304722 Valuation Per Share 3.493451
- 14. (Remains same from 1994 to 1998) Growth rate after 2003 onwards 5% 2002 2003 7.40% 5.00% 30% from 2003 onwards 2002 2003 36% 30%
- 15. 1996 1997 1998 1999 2000 2001 2002 2003 4.66 5.45 6.38 7.31 8.20 9.01 9.67 10.16 0.90 1.05 1.23 1.05 0.92 0.83 0.77 0.73 0.21 0.24 0.29 0.24 0.21 0.19 0.18 0.17 0.13 0.15 0.18 0.15 0.13 0.12 0.11 0.10 2.80 3.27 3.83 3.95 3.94 3.78 3.48 3.05 0.41 0.48 0.56 0.12 -0.01 -0.15 -0.30 -0.44 0.47 0.55 0.65 0.87 0.87 0.91 0.99 0.30 3.60 0.47 0.55 0.65 0.87 0.87 0.91 0.99 3.90 0.30 0.31 0.31 0.36 0.31 0.28 0.27 0.91 stable stage.So they are not taken into account in FCFE for 2003. 1996 1997 1998 1999 2000 2001 2002 2003 4.660694 5.453012 6.380023784 7.311507 9.490247948 12.35 16.11332 21.07857 0.896903 1.049377 1.2277709 1.227771 0.861910028 0.602185 0.418686 0.28967 0.20821 0.243605 0.285018245 0.285018 0.200086257 0.139793 0.097195 0.067245 0.128129 0.149911 0.175395843 0.175396 0.123130004 0.086026 0.059812 0.041381 2.796416 3.271807 3.82801427 4.386904 5.694148769 7.410001 9.667991 12.64714 0.406317 0.475391 0.556207202 0.55889 1.307244415 1.715852 2.257989 2.97915 0.471958 0.552191 0.646063841 0.643649 -0.371557572 -0.98187 -1.64117 3.26882 39.91001 0.471958 0.552191 0.646063841 0.643649 -0.371557572 -0.98187 -1.64117 43.17883 0.304722 0.308146 0.31160803 0.268318 -0.133872879 -0.30576 -0.44173 10.04471 st of equity at beta 1.45 i.e,15.70% 1997 1998 1999 2000 2001 2002 2003 0.552191 0.646064 0.871059692 0.869248 0.914613234 0.988566 0.295154 2.89637
- 16. 0.552191 0.646064 0.871059692 0.869248 0.914613234 0.988566 3.191524 0.308146 0.311608 0.363117988 0.313192 0.284820083 0.266076 0.742445
- 17. Global Drug World Inputs Net Income 164497 Interest 25488 Tax Rate 0.3 Non cash Expense 56293 Fixed Expenses 143579 Change in WC 7325 Net Borrowing 27409 1 Calculation of FCFF for 2005 FCFF Net income+Int(1-T)+NCC-FC-Inc in WC FCFF 95374 2 Calculation of FCFE for 2005 FCFE FCFF-Net Debt payment FCFE 67965 3 Calculation of Sustainable growth rate Sustainable growth rate Plowback ratio*Return on Equity Plowback ratio(b) [Net Income-(Dividend per share*shares outst ROE Net Income/Beginning of the year equity Inputs Dividend 82248.8 (Dividend per share*shares outsta Total Equity 1019869 Sustainable growth rate 0.080646 4 Inputs For 2005 Net Income 164497 Interest on Long term debt 20265 Other interest 5223 Total Interest 25488 Tax rate 30% Interest (1-Tax) 17841.6
- 18. Depreciation 56293 Capex 143579 Working Capital change 7325 Net Borrowings 27409 FCFF for 2005 87727.6 FCFE for 2005 42477 5 Inputs Per Share FCFF 0.19 G1 8% Stable Growth 5% Return on Equity 10% WACC 7.5% Tax rate 30% per share FCFF FCFE PV Value
- 19. 1-T)+NCC-FC-Inc in WC Return on Equity idend per share*shares outstanding)]/Net Income nning of the year equity end per share*shares outstanding) Sales Growth 6% For 2006 2005 2006 variance Sales 4052173 4295303 243130 Expenses 3735397 3735397 Non cash Charges 56293 60000 Interest on long term Debt 20265 20265 Other interest 5223 5223 Income before income taxes 234995 474418
- 20. Less: Income tax 70499 142326 Net Income 164497 332093 Additional fixed capital 36470 Additional Working capital 24313 FCFF for 2006 349152 2005 2006 2007 2008 0.19 0.21 0.22 4.654 0.21 4.876 0.187 4.029 4.216
- 21. MWC Inc. Growth EPS Dividends 23920 G1 0.15 DEP DPS 2.3 G- Stable 0.08 FI No of shares 10400 NWC Net debt proceeds Cost of equity 13% FCFE A. Calculation as per two-stage Dividend Discount model 2005 2006 2007 2008 DPS 2.3 2.65 3.04 3.29 65.70 2.65 68.74 PV 2.34 53.84 Value of share 56.18 B. Calculation as per two-stage FCFE approach 2005 2006 2007 2008 FCFE 2.42 2.78 3.20 3.46 69.11 2.78 72.31 PV 2.46 56.63 Value per share 59.09
- 23. Telluride & Subsidiaries_Q.23 A. Growth Growth G1 0.27 Common shares G- Stable 0.13 Ke Revenue Net income Depreciation Chg in WC FCInv FCFE Growth Rate Earning per share Depreciation Working capital FCInv FCFE Terminal value Total cash flow to equity PV current value per share B. Tax rate 30% Growth 32% 13% Earning per share 0.952 Dividend per share 0.286 Earning 1 1.257 Dividend 1 0.377 Earning 2 1.659 Dividend 2 0.498 Earning 3 1.874 Dividend 3 0.562 Years 0 1 Current value of a share (Vo) 0.331 0.383 Vo
- 24. Net income 80 Depreciation 23 Working capital 41 FCInv 38 FCFE 24 million
- 25. 0.13 84 0.14 2000 2001 2002 2003 598 759.46 964.51 1089.90 80 101.60 129.03 145.81 23 29.21 37.10 41.92 41 52.07 66.13 74.73 38 48.26 61.29 69.26 24 30.48 38.71 43.74 0.27 0.27 0.13 0.952 1.210 1.536 1.736 0.274 0.348 0.442 0.499 0.488 0.620 0.787 0.890 0.452 0.575 0.730 0.824 0.286 0.363 0.461 0.521 52.074 h flow to equity 0.363 52.534 0.318 40.424 value per share 40.742 Common shares 84 million Ke 14.0% 2 56.232 43.269 43.982
- 26. Sundanci_Q.24 A. ii Calculation of ROE for the year 2000 Net Income Beginning of the year equity ROE ROE iii. Calculation of Sustainable rate of growth Sustainable growth rate b Dividend per share Share outstanding Sustainable growth rate Sustainable growth rate B. a) An increase in in the quarterly dividend to 0 .15 per share Quarterly dividend increases by 0.15 per share So, yearly increase in dividend per share is 0.15*4=0.6 So, now the dividend per share is Sustainable growth rate b) Bond Issue of 25$ million, the proceeds of which would be used to increase pr Issue of bond has nothing to do with sustainable growth rate. The proceeds of i which in turn increases the value of the firm in terms of growth in share price. B c) A 2-for-1 stock split 2-for -1 stock split indicates that the no.of outstanding shares increases by 2 tim
- 27. Now, the no. of outstanding shares Now, the no. of outstanding shares Sustainable growth rate Both the no.of shares outstanding and increase in dividend has a direct impact But the increase in the quarterly dividend has more impact on the growth rate. In both the cases the growth rate has decreased. 1st Case 2nd Case C. i. The DDM uses a strict definition of cash flow to equity, i.e. the expected divide ii. Both two-stage valuation model allow for two distinct phases of growth, initial
- 28. 80 674 Net Income/Beginning of the year Equity 0.118694 Plowback ratio* Return on equity b*ROE [Net Income-(Dividend per share*share outstandind)]/Net Income 0.286 84 b*ROE 0.08305 0.6+0.286 0.886 0.008273 uld be used to increase production capacity wth rate. The proceeds of issue of bond increases the production s of growth in share price. But it has no direct relation with sustainable growth rate. ng shares increases by 2 times whereas the price per share decreases by half.
- 29. 84*2 168 0.047407 vidend has a direct impact on the sustainable growth rate. mpact on the growth rate. But the decrease is more in the 1st case, i.e in the increase in dividend. Change in growth rate 90.04% Change in growth rate 42.92% ty, i.e. the expected dividends on the common stock. In fact, taken to its extreme, the DDM cannot be used to estimate the value of a sto ct phases of growth, initial finite period where the growth rate is abnormal, followed by a stable growt period that is expected to last inde
- 31. n the increase in dividend. sed to estimate the value of a stock that pays no dividends. The FCFE model expands the definition of cash flows to include the balance o eriod that is expected to last indefinitely. These two-stage models share the same limitations with respect to the growth assumptions. 1
- 33. ash flows to include the balance of residual cash flows after all financial obligations are met. Thus, the FCFE model explicitly recognizes the ect to the growth assumptions. 1) There, is a dufficulty of defining the duration of the extraordinary growth period. Eg: A longer period o
- 35. CFE model explicitly recognizes the firm's investment and financing policies as well as its dividend policy. In instances of a change of corpo owth period. Eg: A longer period of high growth will lead to a higher valuation and there is a temptation to assume an unrealistically long
- 37. In instances of a change of corporate control and thereafter the possibility of changing dividend policy, the FCFE model provides a better to assume an unrealistically long period of extraordinary growth. 2) The assumption of a sudden shift from high growth to lower, stable
- 39. the FCFE model provides a better estimate of value. The DDM is biased toward finding low P/E ratio stocks with high dividend yields to be rom high growth to lower, stable is unrealistic. The transformation is more likely to occur gradually over a period of time. Given that the a
- 41. cks with high dividend yields to be undervalued. It is considered a conservative model in that it tends to identify fewer undervalued firms r a period of time. Given that the assumed total horizon does not shift i.e. infinite, te timing of the shift from high to stable growth is a crit
- 43. identify fewer undervalued firms as market prices rise relative to fundamentals. The DDM does not allow for the potential tax disadvanta rom high to stable growth is a critical determinant of the valuation estimate. 3) Because the value is quite sensitive to the steady-state g
- 45. w for the potential tax disadvantage of high dividends relative to the capital gains achievable from retention of earnings. ite sensitive to the steady-state growth assumption, over or under estimating this rate can lead to large errors in value. The two models s
- 47. ntion of earnings. errors in value. The two models share other limitations as well notably dufficulties in accurately forecasting required rates of return in de
- 49. sting required rates of return in dealing with the distortions that resulta from substantial or volatile debt-ratios and in accurately valuing a
- 51. t-ratios and in accurately valuing assets that do not generate any cash flows.
- 52. Sundanci_Q.25 A. The formula for calculating a price earnings ratio (P/E) for a stable growth firm is the dividend payout ratio P/E on trailing earnings P/E = [payout ratio (1 + g)]/(r g) Growth 13% Payout 30% Cost of Equity 14% P/E Ratio 33.9 P/E on next year's earnings P/E Ratio 30.0 B. The P/E Ratio is a decreasing function of riskiness. As risk increases, the P/E ratio decreases. Increases in the riskin
- 53. m is the dividend payout ratio divided by the difference between the required rate of return and the growth rate of dividends. If the P/E is reases. Increases in the riskiness of Sundanci stock would be expected to lower the P/E. The P/E Ratio is an increasing function of growth
- 54. wth rate of dividends. If the P/E is calculated based on trailing earnings (year 0), the payout ratio is increased by the growth rate. If the P/E s an increasing function of growth rate of the firm, thus higher the P/E ratio. Sundanci would command a higher P/E if analysts increases t
- 55. ased by the growth rate. If the P/E is calculated based on next year’s earnings (year 1), the numerator is the payout ratio. a higher P/E if analysts increases the expected growth rate. The P/E ratio is a decreasing function of the market premium. An increased m
- 56. the payout ratio. market premium. An increased market risk premium increases the required rate of return, lowering the price of a stock relative to its earn
- 57. price of a stock relative to its earnings. A higher risk premium would be expected to lower Sundanci's P/E ratio.
- 58. Jones Group Inc. Calculation of FCFF of Jones Group Inc. & D.Com Corp. Q.1 WACC 0.17 A. Tax Rate 0.3 2000 2001 2002 2003 EBIT 304.55 251.23 267.98 308.02 Depr & Amor 504 654 751 849 Capex 1000 650 650 Change in WC -3.92 -15.16 -18.41 EBIT(1-T) 175.861 187.586 215.614 FCFF -166.219 303.746 433.024 FCFF -166.219 303.746 25331.9 PV in 2000 -142.068 221.8906 15816.49 Value 15896.32 D.Com Corp. A. WACC 0.17 Tax Rate 0.3 2000 2001 2002 2003 EBIT 29.45 69.68 47.51 10.52 Depr & Amor 69 129 136 144 Capex 400 50 50 Change in WC 5.19 -4.32 -6.47 EBIT(1-T) 48.776 33.257 7.364 FCFF -227.414 123.577 107.834 FCFF -227.414 123.577 6308.289 PV in 2000 -194.371 90.27467 3938.71 Value 3834.614
- 59. B. SOTP is Sum of the parts valuation. D.Com Corporations contribution towards the whole of Q.3 Calculation of Sustainable Growth Rate of Jones Group Inc.for the year 2003 A. 2003 PAT 122.69 Equity 1475.16 ROE = PAT/Equity 0.083171 Net Income 122.69 Dividend 88.18 Dividend Payout Ratio 0.718722 Retention Ratio = (b) 0.281278 Sustainable Growth Rate 2.34%
- 60. Growth till infinity 0.15 PV in 2003 24898.88 Growth till infinity 0.15 PV in 2003 6200.455
- 61. ution towards the whole of Jones Group would be approximately 24% the year 2003