6. Let’s have a look in our world ... and try to quantify what is happening ...
7. We need a unit ... to measure how much resources we use ...
8. Super Tanker TI Europe Cargo Capacity: 500.000 m 3 430.000 t The biggest ship in the world ... 380 m
9. How big is our planet ? Surface Perimeter 22600 km 30% Land 70% Water 40000 km
10. How many are we ? = ? 2.5 billion 6.7 billion 9.2 billion (estimate) 1950 2007 2050 Source: UN
11. How much land for each person ? = ? 1950 2007 2050 240 m 150 m 125 m (estimate) Source: UN; US CENSUS
12. And for different countries ? = ? (2007) Source: UN; US CENSUS BR USA CN DE IN NL 1300 million 1100 million 82 million 16.4 million 300 million 195 million 36 % World Pop.
13. And for different countries ? = ? (2007) Source: UN; US CENSUS BR USA CN DE IN NL 209 m 174 m 84 m 51 m 65 m 45 m
14. How much energy needs the human body to live ? Man Woman 2500 kcal/day 120 W 2000 kcal/day 100 W Source: FAO – Human Energy Requeriments 2001 Child 1000 kcal/day 50 W (2-3 years)
15. And all human population ? 670.000 MW (2007) 100 W 14.000 MW Itaipu Power Plant (Brazil) 48 x 100 W
17. 9 x / day (2007) Rice 4 million t/day 0.6 kg/day
18. 23 x / day (2007) Food 10 million t/day 1.5 kg/day Source: FAO - FAOSTAT
19. But how much energy do we use ? 16.000.000 MW (WEC) 1 kW 2 kW (2007) 2400 W Source: BP - Statistical Review 2008; IEA – WEO 2006 14.000 MW Itaipu Power Plant (Brazil) 1143 x
28. Where does the energy come from ? (2007) Source: BP - Statistical Review 2008; IEA – WEO 2006 0 1 2 3 4 5 6 Oil Gas Coal Nuclear Hydro Trad. Biomass GeothermalSolar, Wind, etc... (millions MW) 33.0 % 22.0 % 26.5 % 5.2 % 2.3 % 10.0 % 1.0 % Fossil fuels 13 % - Renewable Nuclear fuel 82 % 5 % 13 % 87 % Non - Renewable
29. Is it the same all over the world ? 14% 79% 7% 100% - World 4% - Sub Saharan Africa 1% 63% 36% 83% 11% 6% 52% - OECD (N. America, Europe, Japan, Australia,...) (2001) Source: UN – WEA 2004
36. In one word ... 100 W 2100 W 1.6 kg/day 1.0 kg/day 2.6 kg/day 10 g/year 1.5 kg/day (2007)
37. Grand total of non-renewable energy ... 10.2 kW 2100 W 14.000.000 MW 87% WEC (2007) Source: BP - Statistical Review 2008 BR USA CN 0.9 kW 1.8 kW 4.9 kW 7.4 kW DE IN NL 0.4 kW
38. If 10.2 kW 3400 W 23.000.000 MW 144 % WEC BR USA CN 0.9 kW 4.9 kW 4.9 kW 7.4 kW DE IN NL 4.9 kW = = ...
39. 10.2 kW 5400 W 36.000.000 MW 225 % WEC BR USA CN 0.9 kW 10.2 kW 4.9 kW 7.4 kW DE IN NL 10.2 kW If = = ...
40. 10.2 kW 10200 W 68.000.000 MW 425 % WEC BR USA CN 10.2 kW 10.2 kW 10.2 kW 10.2 kW DE IN NL 10.2 kW If = ...
42. Official Proved Reserves at constant production ... Source: BP - Statistical Review 2008; Energy Watch Group – Paper 01/2006 43 year 60 year 131 year 80 year + + + = Total 76 year (2007)
43. 26 year 37 year 80 year 49 year + + + = Total 47 year If = = ...
44. 16 year 23 year 51 year 31 year + + + = Total 30 year If = = ...
45. 9 year 12 year 27 year 16 year + + + = Total 16 year If = ...
46. = In one word ... time (year) Power (TW) 10 20 30 40 50 60 70 10 20 30 40 50 60 70 80 90 100 = = = = 87% WEC (2007)
47. NO... If we keep our total consumption constant, do we still have 76 years without worries?
48. 1) It requires an huge investment to switch of energy source ... Oil Gas Coal Uranium time (year) 10 20 30 40 50 60 70 80 90 100 110 120 130 0
49. 2) It’s not possible to keep constant production until resource exhaustion ...
50. An example of future energy mix ... Source: Hoffert et al., “Energy Implications of future stabilization of atmospheric CO2 content”, Nature 395, 1998
82. Tar Sands (80% in Canada) Heavy Oil (90% in Venezuela) Oil Shale (mainly USA) Yes ... Non-conventional Oil ... IPR: 2370 Gb URR: 710-1420 Gb (30%-60%) PR: 170 Gb Technology: Energy Demanding and High Environmental Costs IPR: 1360 Gb URR: 410-820 Gb (30%-60%) PR: ? Technology: Energy Demanding and High Environmental Costs IPR: ? URR: ? PR: ? Technology: Not likely to exist in the next decades ... Source: EIA – Caruso, G., “When will World Oil Production Peak?”, 10 th Annual Asia Oil and Gas Conference, 2005
83. The Tar Sands in Canada ... Source: Issacs, E., “Canadian Oil Sands: Development and Future Outlook”, IV International Workshop on Oil and Gas Depletion, May, 2005 20% 80 %
84. Tar Sands Canada: Steam injection ... Source: Issacs, E., “Canadian Oil Sands: Development and Future Outlook”, IV International Workshop on Oil and Gas Depletion, May, 2005
85. Tar Sands Canada: Steam injection ... Source: Issacs, E., “Canadian Oil Sands: Development and Future Outlook”, IV International Workshop on Oil and Gas Depletion, May, 2005
92. Thorium Deuterium Current World Energy Supply: a few millions years Technology: Nuclear Fusion, still at research stage (see ITER project) Radioactive Waste: None Current World Energy Supply: a few thousands years Technology: Some protoype plants builded, but still needs development. Radioactive Waste: Less than Uranium Source: IAEA, “Thorium Fuel Cycle – Potential benefits and challenges”, May, 2005; ???????????????? Uranium & Nuclear Waste Current World Energy Supply: a few thousands years Technology: Breeder Reactors can extract 100 times more energy. Still needs development. Radioactive Waste: Less than normal fission of Uranium
93. Does our planet have other sources of energy ? Solar Tidal Geothermal
94. Tidal Energy 3.2 million MW (20% of WEC) 0.5 million MW (3% of WEC) Atmospheric Tides Ocean Tides Earth Tides
129. Tidal Energy ... “ Abyssal recipes II: Ener g etics of tidal wind mixing“ W. Munk, C. Wunsch Deep-Sea Research, Part I, Vol. 45, pp. 1977-2010 1998 “ Dissipation of tidal energy, paleotides and the evolution of the Earth-Moon system “ B. A. Kagan, J. Suendermann Advances in Geophysics , Vol. 38 , pp. 1 79-266 199 6 “ Once again: once again – tidal friction “ W. Munk Progress in Oceangraphy, Vol. 4 0 , pp. 7- 35 199 7 “ Tide distribution and tapping into tidal energy “ Z. Kowalik Oceanologia, Vol. 46, 3, pp. 291-331 ( www.iopan.gda.pl/oceanologia ) 2004
130. Geothermal Energy ... “ Earth’s Heat flux revisited and linked to chemistry “ A. M. Hofmeister, R. E. Criss Tectonophysics , Vol. 395 , pp. 1 59 - 177 2005 “ Heat flow from the Earth’s interior: Analysis of the global data set “ H. N. Pollack, S. J. Hurter, J.R. Johnson Reviews of Geophysics, Vol. 31, 3, pp. 267-280 1993 “ What is Geothermal Energy ? “ M. H. Dickson, M. Fanelli International Geothermal Association ( www.geothermal-energy.org ) 2004
131. Solar Energy ... Wikipedia – Solar Power ( en.wikipedia.org/wiki/Solar_power ) Wikipedia – Earth’s Energy Budget ( en.wikipedia.org/wiki/Earth's_energy_budget ) NASA ( eosweb.larc.nasa.gov ) Wikipedia – Solar Radiation ( en.wikipedia.org/wiki/Solar_radiation ) “ Here comes the Sun” 1/1 ( www.youtube.com/watch?v=mLHBFyfvK8A ) Backlight, VPRO International, The Netherlands, Oct. 2008
132. Other Renewable Energies ... www.ted.com/index.php/talks/david_gallo_on_life_in_the_deep_oceans.html www.ted.com/index.php/talks/robert_ballard_on_exploring_the_oceans.html en.wikipedia.org/wiki/Deep_sea
134. Nuclear Energy (websites) ... World Nuclear Association ( www.world-nuclear.org ) Nuclear Energy Agency ( www.nea.fr ) Nuclear Energy Institute ( www.nei.org ) Wikipedia - Nuclear Power ( en.wikipedia.org/wiki/Nuclear_power ) Wikipedia - Thorium ( en.wikipedia.org/wiki/Thorium ) European Fusion Development Agreement ( www.efda.org ) Wikipedia - Deuterium ( en.wikipedia.org/wiki/Deuterium ) International Atomic Energy Agency ( www.iaea.org ) Wikipedia - Integral Fast Reactor ( en.wikipedia.org/wiki/Integral_Fast_Reactor ) Wikipedia - Uranium ( en.wikipedia.org/wiki/Uranium ) Wikipedia - Breeder reactor ( en.wikipedia.org/wiki/Breeder_reactor )
136. Nuclear Energy (videos) ... “ Nuclear Renaissance” 1/1 ( www.youtube.com/watch?v=9Lkh_y47XaA ) JourneymanTV, Aug. 2007 “ ITER – The Way to Fusion Power” 1/2 ( www.youtube.com/watch?v=NQE-YIzDpQc ) 2/2 ( www.youtube.com/watch?v=tF7xRYZZ7ME ) European Commission, Aug. 2007 “ Nuclear Fusion” 1/1 ( www.youtube.com/watch?v=qe7mbv7v9Zg ) National Geographic, March 2008 “ Nuclear Energy” 1/1 ( www.youtube.com/watch?v=hcY9MFN5SqU ) AGORA, June 2007 “ More Nuclear Energy: Why America needs it now” 1/1 ( fora.tv/2007/09/13/More_Nuclear_Energy_Why_America_Needs_it_Now ) Frank Bowman, The Commonwealth Club, USA, Sept. 2007 “ Nuclear Fusion” 1/1 ( video.google.com/videoplay?docid=8817177531080616947 ) Horizon, BBC, Aug. 2007 “ Why neither party promote Nuclear Power” 1/1 ( fora.tv/2008/01/28/The_Case_for_Terrestrial_aka_Nuclear_Energy ) William Tucker, Hillsdale College, USA, Jan. 2008
137. Wikipedia - Heavy Crude Oil ( en.wikipedia.org/wiki/Heavy_crude_oil ) Oil Shale & Tar Sands PEIR ( ostseis.anl.gov ) Wikipedia - Tar Sands ( en.wikipedia.org/wiki/Tar_Sands ) Non-conventional Oil ... Pembina Institute ( www.oilsandswatch.org ) Alberta’s Oil Sands ( oilsands.alberta.ca ) Alberta Energy Departament ( www.energy.gov.ab.ca/oilsands/954.asp ) Wikipedia - Oil Shale ( en.wikipedia.org/wiki/Oil_Shale ) “ Oil Change ” 1/2 ( www.youtube.com/watch?v=mHwfQXv_Tus ) 2/2 ( www. youtube .com/watch?v=qMoL3Ak2b-Y ) 2008 Wikipedia - Non-conventional_oil ( en.wikipedia.org/wiki/Non-conventional_oil )
138. Tar Sands Canada (videos) ... Youtube - Alberta oil sands ( www. youtube .com/watch?v=Ro0LWXPlTSA ) Youtube - Discover Canada's devastating oil sand s ( www. youtube .com/watch?v= CcluUYlWxUc ) Youtube - Alberta Oil Sands featured on "60 Minutes“ ( www. youtube .com/watch?v=oYML36YbXo8 ) Youtube - People & Power - Alberta's Oil Sands - 12 Mar 08 ( www. youtube .com/watch?v=Eucr370Oz60 ) Youtube - National Geographic: Megastructures - Alberta Oil Sands ( www. youtube .com/watch?v=UYwHR9yb0IM ) The Guardian – This is the dirtiest oil in the world ( www.guardian.co.uk/environment/video/2008/jul/11/canada.oil ) Youtube - Sands Oil ( www. youtube .com/watch?v=UQyRx8M9BZo )
139. Energy ... World Energy IEA ( www.iea.org ) BP ( www.bp.com ) United Nations ( www.undp.org/energy ) Energy Information Agency ( www.eia.doe.gov ) Energy Watch Group ( www.energywatchgroup.org ) WEC ( www.worldenergy.org ) Worldwatch Institute ( www.worldwatch.org ) Renewable Energy Policy Network for the 21st century ( www.ren21.net ) OPEC ( www.opec.org )
140. “ The Story of Stuff” 1/1 ( www.storyofstuff.com ) Annie Leonard, Tides Foundation & Funders Workgroup for Sustainable Production and Consumption Sustainability ... “ Waste = Food” 1/1 ( www.vpro.nl/programma/tegenlicht/afleveringen/36632706 ) or ( video.google.com/videoplay?docid=-3058533428492266222 ) Backlight, VPRO International, The Netherlands, 2006 “ The Next Industrial Revolution” 1/1 ( nl.youtube.com/watch?v=MoO_DwW4nDs ) Shelley Morhaim, Earthome Productions, USA, 2001 “ Cradle to Cradle” 1/1 ( nl.youtube.com/watch?v=IoRjz8iTVoo ) William McDonough, TED, USA, Feb. 2005 Worldwatch Institute ( www.worldwatch.org ) “ Plan B 2.0: Rescuing a Planet under Stress and a Civilization” 1/1 ( www.youtube.com/watch?v=TLlGkxPIlNg ) Lester R. Brown, Berkeley Institute of the Environment, USA, Aug. 2007
141. US Census ( www.census.gov/ipc/www ) United Nations ( esa.un.org/unpp ) CIA ( www.cia.gov/library/publications ) Demography ...
142. Peak Oil ... Association for Study of Peak Oil ( www.peakoil.net ) ( www.aspo-usa.com ) ( www.aspo-ireland.org ) www.planetforlife.com www.theviewfromthepeak.net Wikipedia - Peak Oil ( en.wikipedia.org/wiki/Peak_Oil ) www.oilcrisis.com “ The End of Cheap Conventional Oil” Zagar, J., Campbell, C. J., Zagar, J., Campbell, C. J., www.w ikipedia.com World energy resources and consumption Earth’s energy budget ( www.hubbertpeak.com ) No Peak Oil ( www.the7thfire.com/peak_oil/ending_debate_on_peak_oil.htm ) Global Public Media ( www.globalpublicmedia.org ) ODAC ( www.odac-info.org ) The Oil Drum ( www.theoildrum.com ) Energy Bulletin ( www.energybulletin.net )
144. “ 1958 - Global Warming – It’s not newly known” ( www.youtube.com/watch?v=0lgzz-L7GFg ) The Unchained Goddess, USA Television, 1958 “ Yergin and Hubbert on the same side US Govt video 1979 ” ( www.youtube.com/watch?v=ez9TRtXu8rQ ) USA Television, 1979 “ 1976 Hubbert Peak” ( www.youtube.com/watch?v=ImV1voi41YY ) USA Television, 1976 History repeating itself ... “ When the Circuit Breaks ... America Energy Crisis” 1/3 ( www.youtube.com/watch?v=aAhJQlLKWX0 ) 2/3 ( www. youtube .com/watch?v=K3DJXoPtzTQ ) 3/3 ( www. youtube .com/watch?v=USki7oDh2hk ) Federal Energy Administration, USA Television, 1975 “ US Energy Policy” 1/1 ( www.youtube.com/watch?v=RmBJG_H0PXQ ) President Jimmy Carter, USA Television, 1977 “ US Energy Crisis” 1/1 ( www.youtube.com/watch?v=ABqE0Yl12FY ) President Jimmy Carter, USA Television, 1979 “ Relation between Oil and Financial System” 1/1 ( www.youtube.com/watch?v=lDNMjV6sumQ ) Colin Campbell, Interview, May 2005
145. “ CO2 Emissions in USA” 1/1 ( www.youtube.com/watch?v=eJpj8UUMTaI ) VULCAN project, Purdue University, USA, March 2008
147. Peak Oil (Presentations) ... “ ASPO6 - Session 2” 1/1 ( www.youtube.com/watch?v=wiBX_S1d-Rg ) George Lee, ASPO 6, Cork, Ireland, Sept. 2007 “ Energy” 1/1 ( video.google.com/videoplay?docid=-2972578948020708613&ei=Wp0MSaj8HI-o2wKTq73eAw&q=breeder+reactor&hl=en ) Dr. Richard E. Smalley, ResearchChannel, Sep. 2003 “ The End of the First Half of the Age of Oil “ 1/1 ( video.google.com/videoplay?docid=-596805984521272213&ei=4pAMSZKGOoKw2gKC-uimCg&hl=en ) Colin J. Campbell, ASPO, Ireland, June 2005 “ Peak oil meets climate change” 1/5 ( www.youtube.com/watch?v=fFaNMmpbuIg ) 2/5 ( www.youtube.com/watch?v=7JpDSrROhVY ) 3/5 ( www.youtube.com/watch?v=8DCZZkyUBTM ) 4/5 ( www.youtube.com/watch?v=8nqDMr12SYo ) 5/5 ( www.youtube.com/watch?v=SAS0F5kDhVE ) Jeremy Leggett, Dublin, Ireland, July 2007 “ The Saudi Arabian Oil Miracle” Presentation Audio ( www.visualcommunications.com/csis/energy/20040224_global_oil.m3u ) Presentation Pdf ( www.csis.org/media/csis/events/040224_simmons.pdf ) Matthew Simmons, CSIS, USA, Feb 2003 “ Has Global Oil Production Reached Maximum Capacity” 1/1 ( ia301115.us.archive.org/3/items/dn2006-0428/dn2006-0428-1_64kb.mp3 ) Julian Darley & Michael Lynch, Democracy Now, USA, April 2006
148. “ The Oil Age - Turning Point for Mankind” 1/4 ( www.youtube.com/watch?v=zLodNEs6TWc ) 2/4 ( www.youtube.com/watch?v=i-bSUe73iU0 ) 3/4 ( www.youtube.com/watch?v=YLtMXC2buGo ) 4/4 ( www.youtube.com/watch?v=X89Johntn9w ) Colin J. Campbell, Feb. 2008 “ Big Event” 1/6 ( www.youtube.com/watch?v=QncjC-EzRKU ) 2/6 ( www.youtube.com/watch?v=ri_Ofl6fFhk ) 3/6 ( www.youtube.com/watch?v=bbKUoIXMCuE ) 4/6 ( www.youtube.com/watch?v=SW8qCiu4WqQ ) 5/6 ( www.youtube.com/watch?v=LmEJl9nxq-Q ) 6/6 ( www.youtube.com/watch?v=OSJ0QnUAues ) Jeremy Leggett, Bristol, UK, Nov. 2007 Peak Oil (Presentations) ... “ World Energy Outlook 2007: China and India insights” 1/1 ( www.youtube.com/watch?v=mDa81-Fgz8s ) Fatih Birol, IEA, Nov. 2007 “ Peak Everything ” 1/6 ( www. youtube .com/watch?v=ybRz91eimTg ) 2/6 ( www. youtube .com/watch?v=b3_ mYowxlEg ) 3/6 ( www. youtube .com/watch?v=nNbVVT2B5iw ) 4/6 ( www. youtube .com/watch?v=JyO0WS79Xec ) 5/6 ( www. youtube .com/watch?v=F5EcK- CdLNA ) 6/6 ( www. youtube .com/watch?v= hJpUswRKwIw ) Richard Heinberg, Orewa, New Zeland, Oct. 2007 “ Oil has peaked” 1/1 ( globalpublicmedia .com/former_head_of_saudi_aramco_oil_has_peaked ) Sadad al-Huseini, Global Plubic Media, Oct. 2007
149. Peak Oil (Presentations) ... “ Congressman Bartlett and Peak Oil Revisited” 1/5 ( www.youtube.com/watch?v=Gtkq5DdcgYA ) 2/5 ( www.youtube.com/watch?v=N2M-_5oQCik ) 3/5 ( www.youtube.com/watch?v=q6hzZ1w-1As ) 4/5 ( www.youtube.com/watch?v=hbReYdVOigs ) 5/5 ( www.youtube.com/watch?v=Mbm7Fd3E0b4 ) Roscoe Bartlett, U.S. House of Representatives , USA, May 2008 “ Out of Gas – The End of the Age of Oil” 1/6 ( nl .youtube.com/watch?v=3vLZr09kD34 ) 2/6 ( nl.youtube.com/watch?v=gc7KpDson0w ) 3/6 ( nl.youtube.com/watch?v=PBZmuKGmy2Q ) 4/6 ( nl.youtube.com/watch?v=hw_b6a5DHbg ) 5/6 ( nl.youtube.com/watch?v=aJEGLbjvOhU ) 6/6 ( nl.youtube.com/watch?v=4n-GyW08920 ) David Goodstein, USA, June 2008 “ Congressman Roscoe Bartlett on Peak Oil ” 1/7 ( nl . youtube .com/watch?v=7lwkyqFB-34 ) 2/7 ( nl . youtube .com/watch?v=506-2_ zxYns ) 3/7 ( nl . youtube .com/watch?v= YyliwrgbLvo ) 4/7 ( nl . youtube .com/watch?v=DwEZqOek0KQ ) 5/7 ( nl . youtube .com/watch?v= QNYNuGlDXLo ) 6/7 ( nl . youtube .com/watch?v= llQIfZXt _88 ) 7/7 ( nl . youtube .com/watch?v=WvAdLvaCx70 ) Roscoe Bartlett, U.S. House of Representatives , USA, April 2008 “ Technology Management Program UCSB: Energy Peak Oil” 1/1 ( www.youtube.com/watch?v=GCGsIN5TWqA ) Matt Simmons, UCSB, USA,Feb. 2008
150. Peak Oil (Presentations) ... “ Oil and Gas - The Next Meltdown ?” 1/1 ( www.youtube.com/watch?v=0Hrpv21Ubf8 ) Matthew Simmons, ASPO, USA, Sept. 2008 “ Peak Oil and its Effect on Climate Change” 1/1 ( www.youtube.com/watch?v=fAllmO8hzbQ ) Randy Udall, ASPO, USA, Sept. 2008 “ Peak Oil: How soon? How serious?” 1/1 ( www.youtube.com/watch?v=O7h4VjZhe_w ) Catherine Gautier & Jeffrey J. Brown , UCSB, USA, Sept. 2008 “ Making Financial Sense of the Coming Energy Crisis” 1/1 ( www.youtube.com/watch?v=mLrnMf1GP48 ) Jim Puplava, ASPO, USA, Sept. 2008
151. Renewable Energy (Presentations) ... “ UC Berkeley Energy Symposium” 1/1 ( www.youtube.com/watch?v=EMouRbje-js ) “ Global Dimensions of Sustainable Energy” 1/1 ( www.youtube.com/watch?v=ooGkMU8Q3xI ) UC Berkeley, March 2008 “ Sustainable Energy Consumption” 1/1 ( www.youtube.com/watch?v=n8xFHCru9ok ) Davos Open Forum, July 2007 “ Forest Products: Part of Sustainable Future” 1/1 ( www.youtube.com/watch?v=BqzPuA8R8Ws ) Ian de la Roche, UC Berkeley, Oct. 2007 “ Energy Crisis and Clean Energy” 1/1 ( www.youtube.com/watch?v=_z7cdDYP_zg ) Hermann Scheer, MIT Clean Tech, USA, July 2007
152. “ Competing in the Green Economy” 1/1 ( www.youtube.com/watch?v=aA5WUZybVSA ) New America Foundation, May 2008 “ Emerging Energy Technologies Summit - 2006” 1/4 ( www.youtube.com/watch?v=b4tJ5z4yF5E ) 2/4 ( www.youtube.com/watch?v=Scu1_bVhu8c ) 3/4 ( www.youtube.com/watch?v=ZpiLUtKha-4 ) 4/4 ( www.youtube.com/watch?v=23R2ObFlZRk ) Technology Managment Program, UCSB, USA,Nov. 2006 “ Emerging Energy Technologies Summit - 2007” 1/4 ( www.youtube.com/watch?v=gQH9vo4Rp1M ) 2/4 ( www.youtube.com/watch?v=sFUzabcfno4 ) 3/4 ( ) 4/4 ( ) Technology Managment Program, UCSB, USA,Nov. 2007 “ We must win the oil end game” 1/1 ( www.youtube.com/watch?v=kMTCNOlozTA ) Amory Lovins, TED, Feb. 2005 Renewable Energy (Presentations) ... - Algae: The World's Most Important Plants www.youtube.com/watch?v=4n5J49Th9c4 www.youtube.com/watch?v=EnOSnJJSP5c www.youtube.com/watch?v=0FrbMMwDccY
155. Documentaries (Videos) ... “ The Epic of Black Gold ” Part I - 1/5 ( www.youtube.com/watch?v=0awiPDZMedc ) Part I - 2/5 ( www. youtube .com/watch?v=syKxYOjp1FY ) Part I - 3/5 ( www. youtube .com/watch?v= luQaevMaKhc ) Part I - 4/5 ( www. youtube .com/watch?v=2tNxxkzWNYI ) Part I - 5/5 ( www. youtube .com/watch?v=z596w_ xBLII ) Part II - 1/5 ( www. youtube .com/watch?v=9-p7Xw1Bzlo ) Part II - 2/5 ( www. youtube .com/watch?v=40CoLcJrzZU ) Part II - 3/5 ( www. youtube .com/watch?v=fNKMZXF77AI ) Part II - 4/5 ( www. youtube .com/watch?v= bWNQxxaRSig ) Part II - 5/5 ( www. youtube .com/watch?v=eZMxn2QHJko ) Part III - 1/5 ( www. youtube .com/watch?v=LI-Sgk2K6D8 ) Part III - 2/5 ( www. youtube .com/watch?v=A81hBT7ZAq8 ) Part III - 3/5 ( www. youtube .com/watch?v= GwbBvGQCMVY ) Part III - 4/5 ( www. youtube .com/watch?v=TQig5w43sLU ) Part III - 5/5 ( www. youtube .com/watch?v=KWV8yU_T2yE ) Part IV - 1/5 ( www. youtube .com/watch?v=r2nJdcn3GYQ ) Part IV - 2/5 ( www. youtube .com/watch?v=HivZ7H6SZDY ) Part IV - 3/5 ( www. youtube .com/watch?v=6HO4uZiLrDU ) Part IV - 4/5 ( www. youtube .com/watch?v=Eg3Hsg1Lnj4 ) Part IV - 5/5 ( www. youtube .com/watch?v= YMccGhLqnsY ) Jean-Pierre Beaurenaut & Yves Billon, July 2008 “ Peak-oil” 1/2 ( www.youtube.com/watch?v=ZmN9_jGRvHg ) 2/2 ( www. youtube .com/watch?v=71Y2yAAHHRw ) Oct. 2007
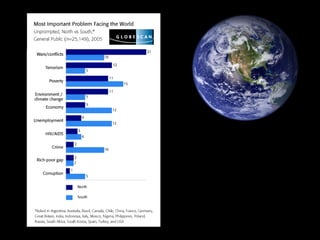
According to a survey conducted worldwide by Globescan in 2005, the biggest problem in the world ranges from war, terrorism to Poverty and economy.
Energy doesn’t seam to be a critical issue for the common public.
Is the public’s perception right ?
The main objective of this presentation is to present clear information related to the energy problem that the world is facing and raise public awareness to it. The subject is not new and there is a lot of information that can be found either in the literature or Internet. A long with all the data presented the corresponding source is always given. At the end of the presentation a set of references sorted by subject is given. Many references can be obtained easily from the Internet.
The TI Europe is the biggest ship in the world. It’s an Ultra-Large Crude Carrier (ULCC). There are only more three tankers like this one: TI Asia, TI Africa and TI Oceania. The length of the tanker is higher than the Eiffel Tower. Roughly, this tanker is big as 3 football (soccer) fields in a row.
It would take approx. 40000km to make a turn around the world. The total surface of the planet is equivalent to a square of 22600km of size, of which approx. 30% are land and 70% are water.
The world population isn’t constant like the surface of the planet but changes with time. During the last 50 years, the population more than doubled. In a period of 100 years the world population is expected to increase almost 4 times!
The total land surface of the planet and population are very big quantities, which are difficult to grasp. If we divide the world population by the world land surface with get the average amount of land that each human being has to live. Due to the increase of the world population, the amount of land for each person is decreasing. At the moment each person has a square of land with 150m size (this includes all the desserts, mountains and the Antarctica). This means that if we would spread all the human population uniformaly over the land surface of the planet, there would be an human being every 150m.
It can be very misleading looking only at world averages. Let’s take the following 6 countries as an example: Brasil and USA (from the American Continent), China and India (from the Asian continent) and Germany and the Netherlands (from the European continent). Only China and India toghether represent more than one third of the current world population.
Countries in the American Continent like Brazil and USA are not so densely populated like countries in Asia or Europe. Notice for instance India that has almost the same density of population of the Netherlands, but has a population almost 70 bigger.
The human body needs energy in order to live. Functions like thinking, walking, keeping body temperature require energy. The energy needs of the human body depends on several factors like gender, age, physical activity and ambient temperature. The numbers shown represent average energy needs for adult man, adult woman and young children with low levels of physical activity. The daily needs of energy for a human body which are expressed usually in kcal can be converted into the standard SI Unit of Power: 1 W (Watt) = 1 J/s (Joule/second). The energy spent by an human body are similar to the energy spent by an incandescent light bulb 40W-100W.
If we assume that one human being requires one average 100W of energy consumption, the total current world population would require approx. 670.000 MW = 670 GW. If we take one of the largest hydropower plants in the World (The Itaipu Power Plant in Brazil) which has 14GW of nominal power, it would require 48 dams like this one to produce the same amount of energy that biologically all human population would need.
But the human body doesn’t run on electricity. It gets its energy from food.
If we take rice as an example of food, then on average an human being would need to eat 0.6kg/day of rice to get the 100W of power. The total world population would need to eat 4 million tons of rice per day, which is equivalent to 9 TI Europe full of rice per day.
But humans can’t live on rice only. We need several kind of nutrients and vitamins. According to FAOSTAT, the average food consumption (vegetables, meat, fish, milk, etc.) is approx. 1.5 kg/day/person. This means, 10 millions tons of food per day for all human population, or equivalenty, 23 TI Europe full of food per day. Since the energy density of food on average is smaller than rice, it’s necessary more food to get the same amount of energy.
But the energy that humans use is much bigger than our bodies need biologically ... It’s on average 24 times higher that what our bodies need, approx 2400W. As an example, an electrical plate at our kitchen (big plate) running continuously dissipates approx. 2000W of power. The total world human consumption of energy is approx. 16 million MW = 16 TW (Tera Watt). To supply this amount of energy it would require over thousand Itaipu hydropower plants.
1) Where do we spent this massive amount of energy?
1) In transport of people and products ... By air, sea and land ...
To drive our industries to produce basic materials and all different kind of products. The pictures show an example of a cement, steel and car factory.
Produce electricity, which is a very handy form of energy to transport and use. Most of the electricity is produced by thermal power plants, ie. water is heated and the steam drives a turbine that generates electricity. The fuel used in the thermal power plants is usually nuclear (uranium) or coal. The efficiency if these thermal powerplants is 1/3. It means that 2/3 of the energy used is dissipated into heat that is released to the atmosphere. Only 1/3 of the energy is transformed into electricity.
At our homes, we use energy for ilumination, heating, cooking and all the electrical appliances like TV, refrigerator, washing machine, etc.
Large amounts of energy are necessary to produce food. The fertilizers, pesticies, herbicies used in modern agriculture require energy to be produced. Irrigation and all machinery to plow, seed and harvest require energy.
All the chain of food processing and transportation from the fields until the supermarkets requires energy.
Whenever we open a tap at home, there is an huge infrastrucutre behind that guarantees that the water will flow and clean enough to drink. Collecting the water, treating it and pumping it to our homes requires energy.
Where do we get all this energy that we are spending? Most of it comes from fossil fuels, approx. 82%. The main source is oil approx. 1/3 of all energy supply. Only a small fraction (approx. 5%) comes from nuclear energy. Only 13% comes from renewable energy, from which the major part is due to traditional biomass (burning wood). Modern renewable energy like solar, geothermal, wind energy corresponds to less than 1% of our supply. Hydropower plants that produce exclusively electricity only participate with a modest 2% to out total energy supply.
When we look to different regions in the world, we see that this energy mix changes substancially. In the so-called “Developed Countries” like OECD, 94% of the energy supply comes from non-renewable energy resources. In the so-called “Third World Countries” like in the Sub Saharan Africa, 63% of the energy supply comes mainly from wood.
Each person uses on average 1.6 kg of oil per day... it’s more than what a person consumes of food. The total world consumption of oil is approx. 10.8 million ton per day. It corresponds to 25 TI Europe of oil burned every day!
Each person uses on average approx. 1 kg of natural gas per day. The world natural gas consumption is approx. 6.4 million ton per day. It corresponds to 27 TI Europe of natural gas burned every day.
Each person uses on average 2.6 kg of coal per day. The world consumption of coal is approx. 17.7 million ton per day. It corresponds to 41 TI Europe of coal burned every day.
Each person uses approx. 10g of pure Uranium every year. This small amount of Uranium compared to the amounts of fossil fuels is due to the high energy density of nuclear energy. The world consumption of uranium is approx. 67000 ton per year. It corresponds to one TI Europe full of pure Uranium every 6.4 years.
Basically every day the world human population consumes 23 TI Europe full of food while burning at the same time 93 TI Europe full of fossil fuels... Can you imagine 93 buildings as big as the Eiffel tower, filled up with fossil fuels, being burned every day?
In one word, we spend 21 times more non-renewable energy than the energy that our bodies need biologically. Everyday, as consumers, we put into our shopping cart 1.5 kg of food and 5.2 kg of fossil fuels ...
Once again, world averages hide big differences between countries. On average one north american consumes more than 100 times more non-renewable energy than the biological energy needs of the human body. European countries consume a bit less but still quite above the world average. Countries like China and India and Brasil consume less than work average. The total world consumption of non-renewable energy is approx. 14 million MW = 14 TW (Tera Watt), and it corresponds to 87% of the total World Energy Consumption (WEC).
1) If China and India (the growing giant economies) would consume at the same level per capita as a country like Germany, the world consumption of non-renewable energy would grow approx. 50%.
1) If China and India (the growing giant economies) would consume at the same level per capita as a country like USA, the world consumption of non-renewable energy would be more than double.
1) If the world would consume at the same level per capita as a country like USA, the world consumption of non-renewable energy would be almost five times higher.
The higher the energy consumption rate, the faster the resources are depleted. If current rate of consumption is kept constant, the proven reserves are depleted within apporx. 76 years.
To switch from one source of energy to another requires huge investments in the extraction and distribution infrastructures. The swithing cannot occur instantaneously but requires several decades due to the lead times.
1) As resource depletion increases, the more difficult it is technically to keep production constant and consequently more expensive also.
The first graphic represents total world primary power predicted for the 21th century, taking into account the population growth and also the Different scenarios of world energy mix. The black lines represent the limit of oil, gas and coal usage for different CO2 levels in the atmosphere. The lower the C02 levels the higher need for a carbon-free energy source.
From the energy point of view, is our planet doomed to the reserves of fossil fuels or nuclear energy? Does our planet have other sources of energy? Yes ... Tidal, Geothermal and the Sun.
This tidal energy is basically energy stored in the mechanical systems Moon-Earth and Sun-Earth, in the form of kinetical and gravitic potential energy that is dissipated gradually into heat due to the deformation of the planet Earth. The deformation of the Earth occurs at the atmosphere, crust and ocean due to the cyclical changes of the centrifugal and gravity forces acting on our planet. The most visible tides are the ocean tides with extreme cases likes 16m of amplitude in the Bay of Fundy (east coast of Canada) but tides in the crust can have motions up to 50cm in the equator. The total amount of tidal energy transfered to Earth from the Moon and Sun is approx. 3.7 TW , which corresponds less than ¼ of the Human World Energy Consumption. Most of this energy comes from the Moon-Earth System. For instance, the Moon is moving away from the Earth at a rate of approx. 3.8cm/year. This value was measured very accurately with a laser beam after a mirror was placed during the Apollo mission.
Geothermal energy is basically due to the nuclear reactor that is inside of our planet, which generates an huge amount of heat. This heat generated inside our planet flows through the crust until it’s radiated to be space. This flow of heat is not known very precisely and the current estimates point to values between 30 and 44 TW (approx. 2 to 3 times the Human World Enegy Consumption). Since the Earth’s crust is not uniform, there are regions in the world where this heat flow is stronger than in other regions and therefore mre suitable for geothermal energy applications like for example in Iceland. The geothernal energy can be quite visible, like for instance whenever there is a Tsunami, an eruption of a Vulcano, an earthquake or a Geyser.
The Sun is a star and therefore radiates energy in the form of electromagnetic radiation. Only a small fraction of the total Sun’s radiated energy hits the planet Earth, which corresponds to 174 billion MW = 174 PW (Peta W). This is approx. 11000 times the current Human World energy consumption.
1) 30% of the massive amount of solar energy that hits our planet, is imeadiately reflected back into space. That’s why we can see our planet from the outer space.
1) The rest, approx. 70%, is absorbed by our planet and reradiated back into space but at the infrared range of the spectrum.
The total amount of energy that hits our planet must equal on average the amount that is absorbed & reradiated and the amount that is reflected. This balave of energy is vital. The solar energy cannot accumulate in our planet, otherwise the temperature of Earth would rise indefinetly . The absorption and reradiation occurs at the atmosphere, ocean and land of the Earth.
After being absorbed by the Earth and before it’s reradiated again back into space, the solar energy assumes different forms. The wind and ocean currents result from the non-uniform heating of the oceans and atmosphere. Masses of air and water move from the hoter locations to the colder locations. The ocean waves result from the action of the winds blowing over the surface of the oceans. The cycle of the water (evaporation and rain) results also from the non-uniform heating of our planet. All the life existing in the ocean and land are forms of solar energy. The Sun is basically the engine the drives allmost everthing we see happening on our planet.
No wonder, in the older civilizations, the sun used to be a God ... and meant “ Source of Life” ... In the Inca civilization it was called “Inti” and in the egyptian civilization was called “Aten”.
But today, in the “modern” world, the Sun seams to mean only “good weather”. We seam to have forgotten how important the Sun is to our lifes and to all life on our planet.
Life on land, learned to capture the energy from sun and store it into chemical energy using biological solar panels (the plants), using a process called photosynthesis. Other forms of life (herbivorous), capture the chemical energy stored in the plants eating them and storing it into a more dense form of energy (meat & fat). Other forms of life (carnivouros), capture the chemical energy stored in the herbivorous. Basically the food chain corresponds to a chain of energy.
The process that life found in the ocean to capture energy is the same on land. The photosyntesis is now done in different biological solar panels (phytoplancton and microalgaes).