Open 2013: Impact of Increased Water Capacity on Sustainability of Water, Sanitation, and Hygiene Facilities
•Descargar como PPTX, PDF•
1 recomendación•669 vistas


Recomendados
Recomendados
Más contenido relacionado
Más de the nciia
Más de the nciia (20)
Open 2013: Impact of Increased Water Capacity on Sustainability of Water, Sanitation, and Hygiene Facilities
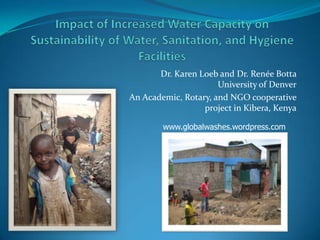
- 1. Dr. Karen Loeb and Dr. Renée Botta University of Denver An Academic, Rotary, and NGO cooperative project in Kibera, Kenya www.globalwashes.wordpress.com
- 2. Kenya & Kibera About 34% of Kenyans live in urban areas, with approximately 2.5 million living in Nairobi. The urban poor make up 55% of Nairobi’s total population and occupy 5% of the total residential land area. Kibera is an informal settlement situated on the southwestern part of the city of Nairobi. The square mile of Kibera comprises 11 villages and is home to at least half a million people living in slum conditions of single rooms, mostly made of mud and corrugated iron sheets.
- 3. Proposed Solution: Community-Run Water, Sanitation, and Hygiene (WASH) Systems Toilet, Shower (Bathroom), and Hand Washing Facilities… …plus Water, Purifiers, and Liquid Soap Enterprises
- 5. Making it Work! -Liquid Soap Making in Hygiene Training Usage & Financial Record- Keeping in Business Training- Community Governance Decision-Making
- 6. Total Usage (Feb-July 2012) Total Usage 1400 Number of Uses 1200 1000 Nyando 800 41 600 Jola 400 MSF 200 Kisinga 0 Okere Wamunyu
- 7. Expenses & Revenues Feb-July ‘12 Misc Total Expenses 5% Liq Soap Total Revenue Donations 0% 0% Showers 13% Water 18% Water 32% Attendant 55% Toilet Tissues 69% 3% Soap 5%
- 8. Net Margin: Feb – July 2012 Net Margin by Facility 1600.00 1400.00 1200.00 1000.00 Nyando 800.00 41 KSH Jola 600.00 MSF Kisinga 400.00 Okere 200.00 Wamunyu 0.00 -200.00 -400.00
- 9. Diagram of Facilities and Plan for Increased Water Capacity Wat/San Facilities in Kibera (Ndugu School not included) Pump Area 41 New Line Nyando 50m with a Gravitational Platform Flow mm 250m Wamunyu 2 levels 100m Pump Pump Pumped MSF 150m Water Jola 50m Okere 2 levels Kisinga 100m Existing Pumping Pump Station Funnel for Rain Water Existing 5000L Tank New 10,000 L Tank Catchment
- 10. Moving large tanks into place
- 11. Clearing a trash dump site for raised tank platform at Nyando
- 12. Total Usage (Aug 2012-Jan 2013) Total Usage 2500 Number of Uses 2000 1500 Nyando 41 1000 Jola MSF 500 Kisinga Okere 0 Wamunyu
- 13. Expenses & Revenues Aug 2012-Jan 2013 Total Revenue Misc Total Expenses Liq Soap Donations 5% 4% 0% Showers Water 17% 30% Attendant 42% Water 43% Toilet 49% Tissues Soap 7% 3%
- 14. Net Margins (Aug 2012 - Jan 2013) Net Margin by Facility 4000.00 3500.00 3000.00 2500.00 Nyando 2000.00 41 KSH Jola 1500.00 MSF Kisinga 1000.00 Okere Wamunyu 500.00 0.00 -500.00
- 15. Alternative Governance Models 1. CBO – SDG Hierarchical Model: Sharing Across CBOs (Kisinga) 2. CBO – Organic Operations Model: Independent Decision-Making (Jola) 3. CBO – Early Mobilization Model: Community Decision-Making (Jollyland)
- 16. Conclusions Increasing water capacity and flow to facilities: Mitigates to some degree impact of water rationing Covers major operational expenses of facilities Yields positive net margins month-to-month Creates community access to portable water More convenient, more economical, potentially safer supply Increases water-based services (e.g., showers) Drives greater usage of sanitation facilities Supports related entrepreneurial solutions (liquid soap, purifiers) Impacts Positively 3 P’s of Sustainability: Profit, People, Planet
Notas del editor
- Audience: Decision-makers from various large foundations. Problem: are we ready to submit major funding
- Renee
- Having a facility doesn’t guarantee success, from lack of water due to pipe blockages, water rationing, poor management, lack of understanding of what causes disease and death, lack of hygiene knowledge and practices. Following extensive surveying and comparative analysis of similar kiosks, we developed a model of what might change this situation.
- EG: Business (SOPs, financial records)
- From just 3 facilities over 600 in July, by January, now 5 facilities over 1000 usages/mo. With Kisinga taking off…only two that are not are Wamunyu and MSF.
- Changesin expenses and revenue %: 55% attendant to 42% , 32% water to 43%. Clearly, selling water and using it for toilets and showers. Revenues: 69% toilet, 18% water, 13% showers 49% toilet, 30% water, 17% showers.
- Kisinga before ~ 1400 July net margin, peaked in January 3400! More than double