
Recomendados
Recomendados
Más contenido relacionado
La actualidad más candente
La actualidad más candente (20)
Similar a mpact of Intellectual Property Rights in the Seed Sector on Crop Yield Growth and Social Welfare: A Case Study Approach
Similar a mpact of Intellectual Property Rights in the Seed Sector on Crop Yield Growth and Social Welfare: A Case Study Approach (20)
Último
Último (20)
mpact of Intellectual Property Rights in the Seed Sector on Crop Yield Growth and Social Welfare: A Case Study Approach
- 1. AgBioForum, 12(2): 155-171. ©2009 AgBioForum. Impact of Intellectual Property Rights in the Seed Sector on Crop Yield Growth and Social Welfare: A Case Study Approach Dermot J. Hayes, Sergio H. Lence, and A case-study approach is used to track research funding deci- Susana Goggi sions made by the private seed sector. The three cases chosen Iowa State University provide a range of intellectual property protection (IPP) environ- ments, crops, and companies, namely, (1) wheat in the United States and the European Union, (2) rootworm-resistant corn, and (3) hybrid tomatoes. The analysis suggests that IPP for US wheat is weak because growers are allowed to save seed and because breeders are responsible for the costs—both transac- tional and reputational—associated with enforcing those IPP rights that do exist. IPP in processed tomatoes is higher than in wheat because all processing tomatoes are now hybrids. How- ever, the possibility that protected tomato varieties could be asexually reproduced weakens IPP and the incentive for the pri- vate sector to fund the basic research that might lead to high- value varieties. IPP in the US corn market is strong, and as a result, the private sector dominates in all aspects of the research process. Key words: crop yield, genetic gain, intellectual property, seed sector. “I believe, in law, a seedling is regarded as the tration among firms in the private sector due to a need gift of God, and it would be hard to patent that; for cross-licensing, (c) and a misallocation of research but could we not hope to have some law fash- expenditures and genetic resources that might benefit ioned that would give a bonus to the man who industrially developed countries at the expense of coun- does such skilled and valuable work as that tries under development. which has come before us over and over again Parayil (2003, pp. 981-982) also provides a compre- during the sessions of this conference?”1 hensive review of research conducted in the social sci- ences on the impact of private sector research and By increasing the productivity of a fixed resource such development, and he concludes that, as land, successful research (in the sense of covering its associated costs) that increases crop yields leads to an “Private sector actors, which are predominantly obvious improvement in social welfare. One would multinational corporations, play the leading role therefore expect that intellectual property (IP) incentives in the innovation and diffusion of agricultural designed to reward the parties that produce innovations biotechnology related to the Genetic Revolution. that increase crop yields would be widely viewed as The technological trajectory is shaped by the beneficial. However, this is not the case. In a recent imperatives of private property institutions, mar- review article, Dunwell (2005) cites a large number of ket forces, global finance, and transnational (and academic papers that highlight the alleged negative in certain cases national) regulatory institutions. impacts of plant IP rights on the freedom to operate and The contingencies and imperatives of economic on commercial opportunities for researchers and farmers globalization shape the technological trajectory. in developing countries. Other issues cited in Dunwell’s New plants and crops are being developed not to (2005) review are (a) concerns that private sector incen- solve problems of hunger and deprivation, but tives lead to competition between the public and private mostly to increase shareholder values of compa- sectors to the detriment of the public sector, (b) concen- nies that have invested heavily in R&D efforts in the biotechnology sector.” 1. Professor Hansen’s comments were presented at the Third Moschini, Lapan, and Sobolevsky (2000) found positive International Conference on Genetics (organized by the Royal social benefits from the introduction of Roundup Ready Horticultural Society), which was held in London in 1906. soybeans but conclude that one must adjust the welfare The conference is most famous for coining the term “genet- ics” by William Bateson as described in Dunwell (2005).
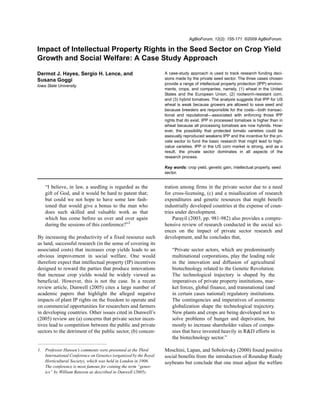
- 2. AgBioForum, 12(2), 2009 | 156 Figure 1. Yield index for US corn, US soybeans, US wheat, and wheat in the EU-15. Note. The EU-15 consists of the following 15 countries: Austria, Belgium, Denmark, Finland, France, Germany, Greece, Ireland, Italy, Luxembourg, Netherlands, Portugal, Spain, Sweden, and the United Kingdom. measures down because the company that conducted the The purpose of the present article is to use a case- research captured a significant portion of this benefit. study approach to track research funding decisions Of the academic studies that have attempted to mea- made by the private sector, from the IP environment to sure the impact of IP rights on crop yields, the one by the ultimate beneficiaries. We chose the three particular Babcock and Foster (1991) draws a similar conclusion cases so as to provide a range of IP environments, crops, for tobacco. Carew and Devadoss (2003) find that, in and companies. The first case we examine is the wheat the absence of a time dummy variable, the area seeded sector in the United States and the European Union to varieties protected by Canada’s Plant Breeders’ (EU). Here the IP environment appeared to be stronger Rights Act of 1990 did have a positive impact on crop in the EU. The second case involves the introduction of yields for canola in Canada. However, the impact of rootworm-resistant corn in the United States. This plant breeders’ rights is no longer significant when a recently introduced trait was chosen because we time trend is included. These studies have typically esti- expected that the scientists and financial decision mak- mated a crop yield function and then added the share of ers involved would be available for interview. We were acres grown to crops developed in response to the IP also aware that accurate yield data for corn plants hav- protections provided to those crops as an explanatory ing the rootworm-resistant trait were available. The variable. third case involved the introduction of hybrid tomatoes. In summary, most of the seed-sector-specific aca- The motivation for this case was to determine whether demic work that has been published in economics or the research and development decisions and resulting crop other social sciences to date has not been glowing in its yield impacts on vegetables were similar to those on praise of private sector research and the incentive struc- major field crops such as wheat and corn. tures that make this research possible. It is possible that Figure 1 helps explain the motivation of our research authors believe that the benefits of this research are so and the cases that we chose. Wheat yields in the EU obvious that they chose to focus on negative aspects have grown at a much faster rate than in the United simply to make a point. However, it may then follow States, as have corn yields in the United States relative that the combined impact of all these negative forces to US soybean yields. These very large differences in actually serves to obscure the message about benefits. the rates of yield growth have welfare implications. Hayes, Lence & Goggi — Impact of Intellectual Property Rights in the Seed Sector on Crop Yield Growth and Social Welfare
- 3. AgBioForum, 12(2), 2009 | 157 To appreciate these welfare impacts, consider what obtain permission from the owner of the protected vari- would have happened had all four yields grown at the ety before selling the progeny of the protected seed. rate of US wheat yields. Alternatively, consider what US This permission requirement was extended slightly in agriculture would look like if US soybean and wheat 1995 to require a license. yields had grown at the same rate as corn yields. A 1980 interpretation of the US Patent Act extended Conceptually, gains in crop yields can be partitioned protection to genetically modified (GM) plants in the into (a) gains due to husbandry, fertilizer, pesticides, form of utility patents awarded under the Patent Act. fungicides, etc.; and (b) genetic gains due to breeding. These utility patents have been a source of protection Thus, there are several possible explanations for the for companies introducing GM corn and soybeans, but yield growth data shown in Figure 1. For example, it GM wheat has not been commercially introduced to may be true that EU wheat yields have increased date. In 1990, US-based Pioneer Hi-Bred International, because wheat is grown on the best soils and because Inc. (Pioneer Hi-Bred) discontinued the development, EU policy has encouraged fertilizer use. US wheat production, and sale of hard red winter wheat and yields may have disappointed because wheat production donated its wheat germplasm collection to Kansas State has been moving to marginal land. There may be some- University. The justification for this decision was thing fundamental about soybean biology that makes the reported as follows: “Pioneer officials cite what they production of hybrid seed difficult, thus restricting its call a weakness in the Plant Variety Protection Act that yield growth compared to that of corn. However, it is allows farmers to save seed for their own use in planting also possible that differences in IP protection and in the their next crop, which they say fails to adequately dis- degree of private sector research are partially responsi- courage farmers from also selling seed wheat they have ble for the differences we observe. In order to untangle grown to others” (Omaha World Herald, 1990). these differences, we need to get much closer to the Although the company had not been spending signifi- data. cant resources on wheat research before the announce- ment (at least in relation to expenditures on corn Case 1: Wheat Research in the United research) the donated varieties were well received by States and the European Union Kansas State, and they formed the basis of two very suc- cessful seed lines from that institution, varieties 2145 Situation in the United States and 2137 (Fritz, Martin, & Shroyer, 2002; Paulsen, The IP rules under which the private sector operated in 2000). the US wheat sector are described in Fernandez-Cornejo In our discussions with Pioneer Hi-Bred executives (2004). Prior to 1970, it was almost impossible for the as part of this study, it was clear that the lack of interest innovator to realize any benefit from non-hybrid seeds in investing in new US wheat varieties was related to the such as wheat.2 The 1970 Plant Variety Protection Act lack of premiums available from the marketplace. In gave breeders the exclusive right to market a new vari- addition to the farmer’s exemption described above, the ety for 18 years. This act resulted from work done by the executives also indicated that the transaction costs Breeders’ Rights Study Committee of the American involved in enforcing the existing IP rules were rela- Seed Trade Association. The act contained two exemp- tively high, particularly given the tradition of saving and tions that limited its applicability, namely, the research selling seed among wheat growers. In addition to the exemption and the farmer’s exemption. The former actual legal costs associated with enforcement, the allowed other companies to use protected seeds to brand name of the company is eroded when the com- develop new varieties, whereas the latter allowed saving pany brings lawsuits against producers who are simply and—under certain rules—selling seed grown from a following tradition. One interesting aspect of this dis- protected variety. The act is enforceable only through cussion is that soybean producers are viewed as being the actions of the owners of the protected varieties. In less opposed to paying royalties, in part because they are 1994 the act was strengthened to require the farmer to used to making these payments for corn and used to pur- chasing new seed each year. Other wheat seed companies in the United States 2. Protections were introduced for asexually propagated plants appear to have arrived at a similar conclusion, and, as a by the Plant Patent Act of 1930 and to patentable improve- result, almost all of the research and variety releases for ments in general by the Patent Act of 1952, but neither of wheat are from the public sector (Fernandez-Cornejo, these acts contained language that extended IP to seeds. 2004). The report by Fernandez-Cornejo (2004) also Hayes, Lence & Goggi — Impact of Intellectual Property Rights in the Seed Sector on Crop Yield Growth and Social Welfare
- 4. AgBioForum, 12(2), 2009 | 158 shows that soybean breeding research by the private are then forwarded to the seed company. If the farmer sector was almost nonexistent prior to 1975 but gradu- saves seed, then the farmer must pay the fee directly to ally picked up so that it exceeded public sector research the BSPB. The system is not perfect, and some farmers on soybeans in 1994. The interviews we conducted, as avoid paying fees by claiming that they are planting well as the data in Fernandez-Cornejo (2004), indicate non-protected varieties. However, an estimated 90% of that the availability of utility patents on GM soybeans the royalties are collected, in part because farmers who has greatly increased the amount of private sector do not pay are in violation of British law. research since 1996 with the commercially successful As an example of how the provisions that are introduction of glyphosate-resistant soybeans. included for royalty collection impact the industry, com- In summary, wheat breeders in the United States pare the reasons given above by Pioneer Hi-Bred for have not had access to effective IP protection, especially exiting the business of breeding hard red winter wheat in areas of the country where farmers traditionally save with the following quote from the Fair Play site (FAQ seeds. Wheat breeders are also obligated to take action section, under “How is plant breeding funded”). to implement any IP protections that are afforded to them, and the anticipated cost of this action appears to “Until the early 1960s, plant breeding in Britain have deterred them from enforcing some of the existing was largely confined to publicly funded research. rules. Even though the legal situation regarding soy- This situation changed dramatically in the mid- beans is similar to that of wheat, lower transactions 1960s when Plant Breeders' Rights were intro- costs associated with enforcement prior to 1996 and the duced in the UK through the 1964 Plant Varieties successful use of utility patents after that date have stim- and Seeds Act. This triggered a rapid expansion ulated significant amounts of private sector research on of plant breeding as a commercial enterprise in soybean breeding. its own right, and paved the way for major advances in the performance, quality, and diver- Situation in the European Union sity of crop production in Britain.” At first glance, the IP protection for wheat breeders in the EU is very similar to that of the United States. This The availability of a mechanism for collecting seed roy- is because the US Plant Variety Protection Act was alties allowed the main breeding agency to become amended in 1994 to bring it into conformity with the privatized in 1987, when Unilever acquired the breeding same rules that govern variety protection in the EU. The and applied science resources of the Plant Breeding rules that govern variety protection in both geographic Institute. This group was later sold to Monsanto. Thirtle, areas are now based on the International Union for the Bottomley, Palladino, Schimmelpfennig, and Townsend Protection of New Varieties (UPOV). However, the (1998) provide a detailed history of public and private implementation of the UPOV rules is quite different. sector research efforts in the UK. Under European regulation (see Council Regulation The situation in France and the rest of the EU is sim- 2100/94, Article 14), farmers have a right to grow pro- ilar to that in the UK. In response to a question posed as tected seed, but they are subject to payment of royalties. part of our survey, Bernard LeBuanec, the French secre- Payment rates are determined by national authorities. tary general of the International Seed Federation, said:4 EU regulations and institutions have been created to ensure that the companies actually collect royalties that “I think that there are two main reasons why are due. wheat breeders are better protected in Europe In the UK, the agency developed to organize and and in France: seed certification is compulsory encourage these payments is known as Fair Play. This and breeders get royalties on all the certified seed group was developed as a joint initiative between the and, as you say, there has been a royalty system British Society of Plant Breeders (BSPB) and the major in place for farm saved seed since the ratification farming unions in the UK in order to “combat farm- by Europe of the 1991 Act of the UPOV Con- saved seed evasion.”3 Farmers can pay these fees in two vention.” ways. If they purchase seed, the payment is included in the invoice sent by the seed dealer and these payments 3. See http://www.fairplay.org.uk/site/faq.html. 4. E-mail communication on August 23, 2007. Hayes, Lence & Goggi — Impact of Intellectual Property Rights in the Seed Sector on Crop Yield Growth and Social Welfare
- 5. AgBioForum, 12(2), 2009 | 159 Figure 2. Average yields for wheat varieties introduced between the 1970s and 1990s in the United States, United Kingdom, and France. Source: Constructed from data reported by Brancourt-Humel et al. (2003), Donmez, Sears, Shroyer, and Paulsen (2001), Fufa et al. (2005), and Shearman, Sylvester-Bradley, Scott, and Foulkes (2005). Despite the similarities in the intent of the IP regula- and the 1990s. The term used for measuring the impact tions, the systems in the United States and EU generate of breeding is genetic gain, and it is defined as “the different incentive structures. Breeders in the EU will increase in productivity achieved following a change in typically be paid a premium if their variety is used, and gene frequency affected by selection” (Zaid, Hughes, this gives them an incentive to innovate. Breeders in the Porceddu, Nicholas, 2001, pp. 124). United States can, in theory, collect this premium when Two of these studies, by Donmez et al. (2001) and a farmer sells protected varieties but not when a farmer Fufa et al. (2005), evaluated the rate of genetic gain in uses the protected variety himself. In the United States, winter wheat cultivars that are typically grown in the US the responsibility for collection lies with the owner of Great Plains. Donmez et al. (2001) conducted the field the IP right, and there is a perception among seed com- experiments in Kansas, whereas Fufa et al. (2005) did so pany executives that the costs associated with collec- in Nebraska. Another study, by Shearman et al. (2005), tion, both legal and reputational, are likely greater than evaluated the rate of genetic gains among wheat culti- the benefits. vars grown in the UK, and a fourth study, by Brancourt- Hulmel et al. (2003), focused on genetic gains for wheat Impact of Wheat Breeding Programs in the in France. The yield data reported by these four studies United States and European Union for varieties introduced between the 1970s and the Figure 1 clearly shows that wheat yields in the EU have 1990s is represented graphically in Figure 2. This graph increased much faster than in the United States, both in also shows the corresponding trend lines obtained by fit- absolute and proportional terms. However, as we men- ting ordinary least squares regressions of variety yields tioned earlier, this gain may be due to changes in land against the year of introduction of the respective culti- quality, fertilizer use, or even agricultural policy. We vars. Figure 2 shows that wheat yields are substantially were fortunate to find four studies that controlled for all higher in the UK and France than in the United States of these extraneous factors and that measured the over the period analyzed. Further, annual genetic gains increase in yields due to breeding between the 1970s are also higher in the European countries than in the US. Yield regressions estimated annual genetic gains of 20.5 Hayes, Lence & Goggi — Impact of Intellectual Property Rights in the Seed Sector on Crop Yield Growth and Social Welfare
- 6. AgBioForum, 12(2), 2009 | 160 kg of dry matter per hectare in Nebraska, 36.5 kg of dry impacts from research by Alston, Hyde, Marra, and matter per hectare in Kansas, 59 kg of dry matter per Mitchell (2002) and from state extension personnel. hectare in France, and 103 kg of dry matter per hectare in the UK. The CRW Problem While it is impossible to prove causation from the CRWs complete their life cycle in one year. Adults feed data shown here, it is possible to conclude that the stron- on pollen, silks, and leaves of corn plants from July ger IP incentives in the EU are associated with higher through September. Females tend to mate and lay eggs genetic gains. Given the small resources devoted by the in the field where they feed and will lay more than 1,000 public sector in the United States to wheat breeding, the eggs on average in clutches of about 80 eggs each over rate of genetic gain is impressive. But as the data in Fer- several weeks in the summer. Most eggs are laid in the nandez-Cornejo (2004) show, when properly motivated, upper six inches of soil; however, females will lay in the private sector can bring vastly more resources to deep cracks in dry years. Eggs typically remain dormant breeding programs than the public sector has been able until the following spring. CRW larvae hatch in late to provide to date. May and early June and feed on the roots of corn plants for approximately three to four weeks until they Case 2: Development of Rootworm- pupate.5 Resistant Corn in the United States Currently there are two important economically Hybrid corn is the direct opposite of wheat in terms of damaging CRW species, namely, the western (Diabrot- the ability of US companies to capture IP premiums. ica virgifera virgifera) and the northern (Diabrotica Historically, this has been true because of the biologi- barberi) CRWs. These species cause similar damage to cally enhanced yield effect known as hybrid vigor. It is corn and have overlapping geographies, stretching from also true because farmers must purchase new seed every South Dakota and Kansas across the entire Corn Belt year to take advantage of the higher yields associated and into New England.6 with hybrid seed. Not surprisingly, genetic gains in US Both of these species have behavioral “variants” that hybrid corn have been significant. Duvick, Smith, and have recently adapted to allow them to flourish in the Cooper (2004) estimate annual genetic gains of 77 kg corn-soybean rotation system that is common through- per hectare in corn hybrids introduced between 1930 out much of the Midwest. Annual rotation of corn and and 2001. They argue, based on a large number of stud- soybeans traditionally has been relied upon to control ies, that annual genetic gains have been on the order of rootworm infestations. In the past, the life cycle of west- 65 to 75 kg per hectare over the last 70 years. Further- ern and northern CRWs could be interrupted by annual more, the annual genetic gains appear to have been rotation of corn and soybeans. Because neither western roughly constant throughout the whole period. Thus, nor northern CRW adults were known to lay eggs in annual genetic gains of US hybrid corn are intermediate soybean fields, a grower could plant corn after soybeans between the genetic gains reported in wheat in the UK without concern about rootworm larvae in the field. The and the ones in wheat in France. larvae that hatched in soybean fields could not survive More recently, the historic IP protection rights for on soybean roots, so they died. However, within the past hybrid corn have been strengthened as companies have two decades, western CRWs have developed variants taken out utility patents on GM varieties. These utility that lay eggs in soybean fields, even though they con- patents have created opportunities for seed companies to tinue to lay eggs in cornfields. When variant western license the trait to other companies, resulting in a greatly CRW larvae hatch in corn planted after soybeans, they extended market share and resulting fees for the trait. are able to cause damage to the roots of the first-year The purpose of this case study is to trace the devel- corn that follows the soybean crop. Northern CRWs, on opment of a new genetic trait—resistance to corn root- the other hand, have developed the capability to allow worm (CRW)—from the internal company decisions to their eggs to remain dormant for extended periods (so- the final impact on social welfare. We were fortunate in called extended or prolonged diapause), which allows this regard because two of the companies involved in eggs to remain viable through the season when soybeans the introduction of CRW-resistant varieties allowed us access to executives that were aware of the scientific and financial decisions that lay behind the product. We 5. http://ipm.uiuc.edu/fieldcrops/insects/corn_rootworm/fact- were also able to find detailed data on the farm-level sheet.html 6. http://www.dowagro.com/herculex/pest/corn.htm Hayes, Lence & Goggi — Impact of Intellectual Property Rights in the Seed Sector on Crop Yield Growth and Social Welfare
- 7. AgBioForum, 12(2), 2009 | 161 are planted in a field. When variant northern CRW lar- mation sources from among thousands of possible vae hatch in corn planted after soybeans, two years after sources. For example, executives at these firms typically eggs were laid, they are able to survive on and cause provide investors with detailed product information that damage to the roots of first-year corn. Each of these is released for the first time at meetings of stock ana- variants has a significant range, with the soybean variant lysts. These presentations are then loaded at company being most prevalent in Illinois and Ohio and the dia- websites along with other news stories. By meeting with pause variant being most prevalent in Iowa, Minnesota, the individuals involved in much of the work described and South Dakota.7 in these presentations, we were able to find key data that Corn producers currently have access to three trans- might otherwise have eluded us. genic events designed to control CRWs—YieldGard Much of what we learned at these meetings con- Rootworm (owned by Monsanto), Herculex RW (owned formed to our original expectations. Decision makers by Dow AgroSciences and Pioneer Hi-Bred), and Agri- clearly have stockholders in mind when investing scarce sure RW (owned by Syngenta). In areas where root- corporate resources. They make decisions under a risk- worm pressure has been high, the YieldGard and return framework that is very similar to that modeled in Herculex CRW-resistant events have been widely used. the finance literature, and they fund research products First commercialized by Monsanto in 2003, Yield- with a positive expected return. Research on corn is Gard Rootworm corn is modified to protect against root- viewed very favorably because of the ability to capture a worm larva that can weaken and destroy the root nodes return on this research through IP protection. Expected and brace roots of corn. Damage to the underground return on traits is judged based on the ability of the com- root system reduces the plant’s ability to absorb nutri- pany to charge a premium for that trait multiplied by the ents, particularly in drought situations. Damage to the expected number of units sold containing that trait. brace roots also reduces the ability of the corn to with- Some of these conversations also provided us with stand wind. This damage is sometimes more important insights that we had not anticipated. We describe these than feeding injury on the main root system because the below because they inform the results we present later. entire crop can be lost if wind causes the corn to lodge. Even if the entire crop is not lost, lodged plants increase Lack of Accurate Measures of Research Costs costs by slowing harvest. In addition to larval feeding We had expected the companies to have an accurate damage, the adult beetles can also cause yield losses by measure of what it took to bring the CRW-resistant trait clipping the silks, thereby reducing kernel set. to market. We discovered that with basic research of this type, companies have problems in accurately allocating Interviews with Corporate Executives at costs to specific projects. In hindsight, this makes sense Monsanto and Pioneer Hi-Bred because this type of research is risky and may not result The relatively recent introduction of the CRW-resistant events means that several of the individuals responsible for decisions about research and commercial introduc- 8. Executives who were interviewed at Pioneer were Enno Kreb- tion of rootworm-resistant corn are still working at these bers (Intellectual Property Strategy Director), John Grace (Licensing Manager), Louise Foutch (Senior Intellectual companies. This institutional memory is of great value Property Counsel), Marv Wilson (Director, North America because we can get a sense of the way key decisions Product Strategy), Joe Keaschall (Research Director), Rafael were made. Herrmann (Research Director-Insect Control), Murt McLeod We interviewed managers from Monsanto and Pio- (Agronomy Research Scientist), Paula Davis (Senior Man- neer Hi-Bred who had been involved in the CRW-resis- ager—Insect & Disease Resistance Traits, Pioneer Strategic tant events.8 We signed confidentiality agreements with Planning), Mike DeFelice (Senior Manager, Pioneer Strategic both companies, and, in addition, we agreed to limit our Planning), and Stephen Smith (Research Fellow). Executives at Monsanto included Jim Tobin (Grain Industry Relation discussions to situations that were already in the public Lead), Clint Pilscher (Corn Insect Technology Manager), domain. Of critical importance to us, the individuals we Eric Sachs (Global Scientific Affairs Lead), Ty Vaughn (Agro- met were very much aware of the location of publicly nomics Traits Team Lead), Corby Jensen (Corn Insect Tech- available information. This allowed us to find key infor- nology Manager), Jim Zardnt (Business Development Lead, and Corn Trait Lead when CRW was commercialized), Gra- ham Head (Global IRM Lead), Sam Eathington (Line Devel- 7. http://www.dowagro.com/herculex/pest/corn.htm and http:// opment Breeding Lead), and Eloy R. Corona (Trait ipm.uiuc.edu/bulletin/article.php?id=635 Stewardship Lead). Hayes, Lence & Goggi — Impact of Intellectual Property Rights in the Seed Sector on Crop Yield Growth and Social Welfare
- 8. AgBioForum, 12(2), 2009 | 162 in a successful market product but if successful may chase decisions before they know the insect pressure, lead to unanticipated opportunities that were not even expected per-bushel price of the crop, or actual weather budgeted at the initiation of the project. Both companies patterns and the weather-related value of insect resis- did provide us with an educated guess of one hundred tance. Companies must charge all producers the same million dollars as the total cost of bringing a new bio- price for the seed regardless of the full value of the trait tech trait to market. This guesstimate included costs to each producer. They charge a price consistent with associated with registering the new trait, as well as start- the long-run survivability of the firm, so that a marginal up marketing efforts. This amount coincides with the or target producer is just willing to purchase the trait. Of figure reported in Bell and Shelman (2006), who in all the producers who buy the trait, the marginal pro- addition report a period of approximately ten years for ducer will obtain the least amount of value. This means the whole process from initiation of the research until that all other producers who end up buying this trait will successful introduction of the commercial product. obtain more value from the trait than this marginal pro- ducer. Pricing Decisions The two pricing models described above lead to dif- Biotech traits such as resistance to CRW involve enor- ferent price premiums. Under the first model, the pre- mous fixed costs as described above. However, once mium would be the full expected value to the these traits are developed and commercialized, the mar- representative producer. Under the second one, the trait ginal cost of including the trait in a unit of seed is very would be priced so as to attract marginal producers. close to zero. In fact, one executive said that the mar- We were able to collect data on the actual premiums ginal cost was probably negative because maintaining for the CRW-resistant trait to determine which of these the trait as a separate product line added to inventory pricing models were followed in practice. We had control costs.9 access to the ex-ante expected value that appears similar The information we collected on low or zero mar- to the kind of information that the company would have ginal costs helped us understand the way these products had when it decided on the premium level and we also are priced. We had expected that the first company had access to the actual premiums that were charged. licensed to sell a new trait would price that trait at a We also followed this up with an ex-post evaluation to value that is just below the full expected value of this ensure that the ex-ante analysis of producer value was trait to a representative or average producer. For CRW accurate. resistance, this value would include an assessment of the costs of buying and applying the alternative pesticide, Ex-Ante Benefits any extra yield advantage associated with the trait in In a paper written before the commercialization of the excess of that available from the pesticide applied to CRW-resistant trait, Alston et al. (2002) presented some conventional seed, and a charge for any convenience very detailed farm-level calculators on the likely bene- and flexibility associated with the new trait. We had fits of Monsanto’s YieldGard Rootworm trait. Their anticipated that these expected value calculations would work is all based on data for the year 2000. They used be similar for all producers who currently applied the an extensive database of the actual incidence of CRW pesticide. problems across the United States. They also had access It was clear from our interviews with both groups of to experimental data on various CRW control treat- executives that these traits are not sold based on their ments, including YieldGard Rootworm. In addition, expected value to a representative producer. Executives they conducted a survey of 601 corn farmers to evaluate were aware that producers differed widely in their will- the willingness of these producers to pay for benefits ingness to pay a premium for the trait. This difference such as human and environmental safety, equipment across producers is due to differences in perception cost savings, and handling and labor time savings. among wary, risk-averse producers who must make pur- It seems probable that decision makers at Monsanto knew about the results of the Alston et al. (2002) study when they made decisions about the premium to charge 9. Note, however, that the arrangements involving dealers and for their event. This appears likely because Alston et al. seed companies to sell varieties incorporating a new trait may (2002) cite Monsanto as the source of some of their include commissions based on sales revenue. If this is so, then data, and also because the authors thank Monsanto per- such commissions should be considered a marginal cost of sonnel (Anderson, Pershing, and Mattingly) for advice. selling the trait. Hayes, Lence & Goggi — Impact of Intellectual Property Rights in the Seed Sector on Crop Yield Growth and Social Welfare
- 9. AgBioForum, 12(2), 2009 | 163 Table 1. Estimate of the Midwest retail price premium for YieldGard Rootworm and associated company-wide sales of this trait. 2003 2004 2005 2006 2007 Per-unit premium for CRW-resistant trait, as reflected in 88.10 57.00 48.00 42.00 43.00 the YGRW premium for DKC60 ($/unit) Per-acre premium for CRW-resistant trait, as reflected in 32.63 21.11 17.78 15.56 15.93 the YGRW premium for DKC60 ($/acre) Estimated area planted with Monsanto CRW-resistant 0.4 1.8 4.1 10.0 20.8 traits, including stacked varieties (million acres) Estimated gross return to Monsanto and associated 13 38 73 156 331 network of seed companies and dealers (million $) Sources: Unit premiums collected from a database of publicly available seed price cards. Monsanto acres for 2003 through 2006 are reported in Casale (2007a, pp. 12; 2007b, pp. 7). $1.85 per bushel). Their survey results also suggested that producers would pay an additional $6.61 per acre for convenience and safety. Their estimate of the total corn area treated for CRW is 13.8 million acres and their estimate of the total benefits to producers from usage of the CRW-resistant trait on all of such an area is $289 million. Ex-Post Benefits We were able to find publicly available data on the actual prices for a unit of seed containing the YieldGard Rootworm trait sold by Midwestern seed dealers for several versions of Monsanto’s seed lines DKC60 in recent years. These data are shown in graphical form on a per-unit basis in Figure 3 and on a per-acre basis in Table 1.10 To measure the premium charged for the CRW-resistant trait, we subtracted the per-unit charge for DKC60-15 with no CRW-resistant trait from the pre- mium charged for DKC60-12 with the trait. To express this premium on a per-acre basis, we divided the per- unit premium by 2.7 acres per unit. The estimates in Table 1 show that the $32.63 per- Figure 3. Midwest retail price per unit of DKC60 with differ- acre premium for the CRW-resistant trait in the year of ent traits. introduction was much higher than the cost of control- ling CRW with the next-best alternative technology, Finally, Monsanto used this study in its submission to projected by Alston et al. (2002) at $13.52 per acre in the Environmental Protection Agency documenting the the Midwest. This high premium was associated with efficacy of the trait (Monsanto, 2007). seed scarcity, as the company was ramping up produc- Alston et al. (2002) assumed that Monsanto would tion (Sankula & Blumenthal, 2004).11 Once the seed charge a seed premium that was equal to the cost of con- trolling CRW with insecticides, averaging $12.43 per acre nationwide and $13.52 per acre in “the heartland.” 10. The per-unit price of the Dow AgroSciences/Pioneer Hi-Bred They also assumed that any additional yield benefits product Herculex was approximately similar to the Monsanto over and above those that were available under existing product once the Herculex brand trait was introduced in treatment alternatives would be allowed to accrue to the 2006. For example, the per unit price of the corn seed 2G675 producer. They calculated the value of these additional HRXRW,LL equaled $163 per unit in 2006 and $147 in 2007, benefits at $16.49 per acre (assuming corn was worth whereas the triple stack product 2G677 HXX,LL sold in the range of $175 to $187 in its first year, 2007. Hayes, Lence & Goggi — Impact of Intellectual Property Rights in the Seed Sector on Crop Yield Growth and Social Welfare
- 10. AgBioForum, 12(2), 2009 | 164 became widely available, the premium rapidly fell to a occurred even though the soil-insecticide treat- range of $15 to $16 per acre. This corresponds very well ments were applied to the isoline of the Bt corn to the Alston et al. (2002) projection of the average cost rootworm hybrid. (This yield disparity between per acre of the next-best alternative to control CRW, Bt corn and plots treated with soil insecticides especially when one factors in the inflation in pesticides was not apparent at our DeKalb site in 2006.) and application costs between 2000 and 2006. This sug- gests that the company knew that it would be selling the Results such as our results from the Urbana seed trait at well below the anticipated benefit to the experiment in 2006 have been reported by other producer. investigators as well, raising questions about the Sales of the trait remained below the 13.8 million utility of root ratings as the sole determinant of acres projected by Alston et al. (2002) until 2007, when rootworm injury and their relationship with sales exceeded this projected level by a large amount. yield. Consider the following questions: The estimated gross annual return to Monsanto and its network of seed companies and dealers also remained Why have large yield differences between Bt below the Alston et al. (2002) projection of $171 million corn and plots treated with soil insecticides until 2007, when this projected amount was exceeded by occurred when the rootworm-injury ratings were $160 million. essentially equivalent? In fact, why would Bt It is too early to compare the actual yield impacts of corn out-yield isolines treated with soil insecti- the CRW-resistant traits in a statistically valid way, cides even when the Bt corn hybrid had more because on-farm yield experience will be dictated in rootworm injury?” part by weather events specific to each year. However, there is some anecdotal evidence to suggest that the Our discussion with seed company executives sug- expected yield impacts have been greater than those gests that these additional yield increases are real and anticipated by Alston et al. (2002). An evaluation of that they can be explained by the ability of the new traits CRW control products in Iowa indicated that YieldGard to allow the full genetic capability of the plant to be Rootworm hybrids averaged yields between 21 and 33 expressed. The logic is that traits protect against pests bushels per acre, or 18% higher compared to the insecti- and diseases that cause plant stress. When these stresses cide treatments (Rice & Oleson, 2005). Similar trends are eliminated, genetic potential that previously had not were also noted in Indiana (Krupke, as cited in Sankula, been fully expressed due to plant stress can now mani- 2006). Steffey and Gray (2007, pp. 122-123) provide the fest. If this logic is correct, then trait research like CRW- following discussion in a recent publication: resistance may end up motivating more traditional breeding. “In our corn rootworm product efficacy trial con- ducted last year (2006) in Urbana, almost every The Impact of Ethanol soil insecticide we tested prevented significant Possibly the most important ex-post benefit of the rootworm larval injury, despite very heavy corn CRW-resistant varieties is associated with the growth of rootworm pressure in the untreated check plots ethanol production that began to make itself apparent in (average node-injury rating = 2.95). Yet, non- corn futures prices in the fall of 2006. This demand-side published data revealed that the YieldGard RW impact has caused corn prices to double from the $1.85 hybrid (node-injury rating = 0.96) had the high- per bushel estimate used by Alston et al. (2002). This est yield (by a large margin) in the trial, signifi- price impact doubled the producer benefit from the cantly greater than the yields of all plots treated anticipated levels, and to the extent that yield response with soil insecticides about 56 bushels per acre is also higher than anticipated, the overall expected greater than the average yield of four plots returns to the producer likely far exceed those originally treated with granular soil insecticides. This lop- anticipated by Alston et al. (2002). sided yield edge in favor of the Bt treatment The ethanol price impact caused US corn plantings to increase from 81 million acres to 93 million acres in 2007. Many of these acres were added by growing corn 11. The small acreage planted with the CRW-resistant trait (0.4 in fields that had grown corn in the previous year. Pro- million acres) provides additional evidence of its scarcity in ducers were willing to switch from their traditional the year it was introduced. Hayes, Lence & Goggi — Impact of Intellectual Property Rights in the Seed Sector on Crop Yield Growth and Social Welfare
- 11. AgBioForum, 12(2), 2009 | 165 corn-soybean rotation because the CRW-resistant variet- Tomatoes are grown in most countries, with China, ies provided them with an easy alternative to crop rota- India, Turkey, Egypt, and the United States harvesting tions as a way to control rootworm. the most acres (Food and Agriculture Organization of the United Nations [FAO], n.d.). Within the United Conclusions from the CRW-Resistant Case States there are two distinct markets, namely, fresh con- Companies that made decisions to develop and intro- sumption and processing. Fresh tomatoes are grown duce corn varieties resistant to rootworm did so in antic- throughout the United States so as to minimize haulage ipation of a high market-based return. The initial costs to the retail sector. Florida and California are the investments made by these companies were huge rela- top two producers of fresh tomatoes. Processing toma- tive to typical university seed research budgets, and total toes are used in tomato sauces, tomato paste, barbeque investment in this sector may well have exceeded three sauces, and a wide range of other products. The process- hundred million dollars. These investments were justifi- ing tomato industry is located primarily in the Central able because the companies could reasonably expect Valley of California. The area planted with processing that the IP they were developing would be highly pro- tomatoes exceeds the area planted with fresh tomatoes tected. in that state by a factor of six to one (US Department of Decisions about the level of premium to charge for Agriculture, National Agricultural Statistics Service the CRW-resistant trait were made in an environment of [NASS], n.d.). zero marginal costs. The trait premium was set at a level To the best of our knowledge, the only published that was well below the best available ex-ante estimate study analyzing genetic gains in yields in US tomatoes of the value of this trait to a representative farmer. As a is by Grandillo, Zamir, and Tanksley (1999). However, result, sales have greatly exceeded the number of total the method used by these authors is not consistent with acres that had earlier been treated with insecticides. the method used by the studies focusing on genetic Our ex-post analysis suggests that gross returns to gains in wheat and corn reported earlier. The fundamen- the company that initially developed the technology tal difference between the study by Grandillo et al. were in the range anticipated prior to 2007, and at that (1999) and the other studies is the nature of the data. point the annual gross return to the company exceeded The wheat and corn data were obtained from experi- the original investment. The expected yield gain to pro- ments specifically designed to measure genetic gains, ducers appears to have been underestimated in the field whereas the tomato data were obtained from field trials trials undertaken prior to the release of the trait. aimed at evaluating the differences across varieties The upheaval in the US corn market driven by the within a set that changed over time. Although a handful ethanol boom in 2007 essentially doubled the net bene- of tomato varieties were planted over several years as fits of the CRW-resistant technology to farmers and to long-term checks,13 the set of tomato varieties being the original company. The widespread availability of tested evolved through time, with more recent varieties this trait also helped the world economy adjust to the US tending to replace older ones as the latter were being ethanol boom by allowing Midwestern producers to rendered obsolete by the former. Furthermore, the num- move away from their traditional corn-soybean rotation ber of varieties and the location of tomato field trials and into corn-on-corn rotations. changed from year to year because of budgetary con- straints and other reasons. Case 3: Hybrid Processing Tomatoes Because of the type of data available, Grandillo et al. (1999) measured genetic gains in tomatoes as the annual For this case we followed a procedure similar to the one change in yields in the mix of non-check varieties, rela- we used for CRW-resistant corn. We combined a litera- tive to the annual change in yields in the long-term ture and data review with interviews. The interviews checks. They concluded that there had been genetic were with executives from Seminis, the world’s largest gains in tomato yields because they found that the yields developer, producer, and marketer of fruit and vegetable of non-check varieties had increased over time relative seeds.12 to the long-term checks. However, their conclusions are 12. We spoke to Seminis executives Marlin Edward (Chief Tech- 13. A long-term check is a variety that is planted year after year, nology Officer), Manuel Rosas (R&D Director Breeding), and so that all newer varieties can be compared to the same base Lindsay Hutchinson (Business Analyst Manager). variety. Hayes, Lence & Goggi — Impact of Intellectual Property Rights in the Seed Sector on Crop Yield Growth and Social Welfare
- 12. AgBioForum, 12(2), 2009 | 166 Table 2. Ordinary least squares regressions of yields for tomato varieties on year of variety introduction, year of trial, and years between first and last trials, for trials conducted in California between 1980 and 2008. Regressions: (A) YieldVar,T = β0 + βI IntroductionYearVar + βT T + errorVar,T (B) YieldVar,T = β0 + βP TrialPeriodXVar + βI IntroductionYearVar + βT T + errorVar,T Coefficient Regression (A) Regression (B), with X in TrialPeriodXVar as defined below X=1 X=2 X=3 X=4 X=5 X=6 X=7 X=8 β0 −344*** −347*** −347*** −338*** −348*** −349*** −349*** −359*** −344*** (52)a (53) (53) (52) (52) (52) (52) (53) (52) βP Not applicable −0.43 −0.58 −1.44** −2.87*** −2.46*** −2.61*** −2.6** −2.3** (0.48) (0.49) (0.66) (0.85) (0.88) (0.91) (1.1) (1.1) βI 0.073 0.10 0.14 0.23* 0.37*** 0.32** 0.34** 0.30** 0.24* (0.095) (0.10) (0.11) (0.12) (0.13) (0.13) (0.14) (0.13) (0.12) βT 0.119 0.09 0.06 −0.04 −0.17 −0.13 −0.14 −0.10 −0.05 (0.095) (0.10) (0.11) (0.12) (0.13) (0.13) (0.13) (0.13) (0.12) R2 0.078 0.079 0.080 0.085 0.094 0.089 0.090 0.086 0.084 Number of 635 635 635 635 635 635 635 635 635 observations ***, **, * Significantly different from zero at the 1%, 5%, and 10% level, based on a two-sided t test. a Numbers within parentheses denote the standard deviations of the corresponding regression coefficients. Source: Vegetable Research and Information Center at the University of California’s Cooperative Extension Service. not warranted, because overall the yields in the long- where YieldVar,T denotes the average yield of variety Var term checks had been higher than the yields of the non- in trials conducted in year T, IntroductionYearVar is the check varieties. In other words, Grandillo et al. (1999) year when variety Var was introduced in the market, show that the long-term checks had higher yields than errorVar,T is a residual, and β’s are parameters. Annual the non-check varieties, but that the yield gap had been genetic gains are measured by coefficient βI, whereas closing over time. net gains in yields due to improvements in management Given the limitations of the study by Grandillo et al. practices, development of susceptibility to new diseases, (1999), we obtained the authors’ original tomato yield and the like are given by coefficient βT. Results for trial data from the Vegetable Research and Information Regression 1 are reported in the second column of Table Center at the University of California’s Cooperative 2. The point estimate of the annual genetic gains is only Extension Service and conducted an analysis as similar 73 kg per hectare, which is not different from zero at as possible to the one performed by the studies assessing standard significance levels. genetic gains in wheat and corn. Unlike the wheat and To assess the impact of survivorship bias, we esti- corn data, however, the tomato data present difficulties mated Regression 2: in estimating genetic gains because of (a) non-simulta- neous trials and (b) survivorship bias. The non-simulta- YieldVar,T = β0 + βP TrialPeriodXVar neous trial problem arises because many of the varieties + βI IntroductionYearVar used in the trials changed from one year to the next, and + βT T + errorVar,T , (2) there was not a single year when all varieties were tried simultaneously. The survivorship bias is associated with Regression 2 expands 1 by incorporating the additional the fact that many of the varieties were only planted a explanatory dummy variable TrialPeriodXVar, defined few years, suggesting that they performed relatively as 1 if the number of years elapsed between the first and poorly compared to other varieties planted over a larger last trials for variety Var is less than or equal to X, and number of years. zero otherwise. For example, trials for variety H9492 To control for non-simultaneous trials, we fitted the were conducted in years 1997, 1998, 1999, and 2001. following regression: Therefore, variety H9492 has TrialPeriod4Var = 0 and TrialPeriod5Var = 1. Succinctly, dummy variable Trial- YieldVar,T = β0 + βI IntroductionYearVar PeriodXVar identifies varieties that do not appear to be + βT T + errorVar,T , (1) good enough to warrant additional trials beyond X years. Hayes, Lence & Goggi — Impact of Intellectual Property Rights in the Seed Sector on Crop Yield Growth and Social Welfare
- 13. AgBioForum, 12(2), 2009 | 167 Table 3. Ordinary least squares regressions of yields for tomato varieties on year of variety introduction and years between first and last trials, for trials conducted in California between 1980 and 2008. Regressions: (C) YieldVar,T = β0 + βI IntroductionYearVar + errorVar,T (D) YieldVar,T = β0 + βP TrialPeriodXVar + βI IntroductionYearVar + errorVar,T Coefficient Regression (C) Regression (D), with X in TrialPeriodXVar as defined below X=1 X=2 X=3 X=4 X=5 X=6 X=7 X=8 β0 −334*** −341*** −344*** −341*** −355*** −354*** −354*** −361*** −347*** (52)a (52) (52) (52) (52) (52) (52) (53) (52) βP Not applicable −0.57 −0.71 −1.30** −2.10*** −1.87*** −1.94*** −2.04*** −2.06** (0.45) (0.43) (0.52) (0.63) (0.64) (0.66) (0.79) (0.84) βI 0.187*** 0.191*** 0.192*** 0.191*** 0.199*** 0.198*** 0.198*** 0.201*** 0.194*** (0.026) (0.026) (0.026) (0.026) (0.026) (0.026) (0.026) (0.026) (0.026) R2 0.076 0.078 0.079 0.085 0.092 0.088 0.088 0.085 0.084 Number of 635 635 635 635 635 635 635 635 635 observations ***, **, * Significantly different from zero at the 1%, 5%, and 10% level, based on a two-sided t test. a Numbers within parentheses denote the standard deviations of the corresponding regression coefficients. Source: Vegetable Research and Information Center at the University of California’s Cooperative Extension Service. less than varieties having five or more years between their first and last trials (see seventh column of Table 2). More importantly, when controlling for survivorship bias with X ≥ 3, annual genetic gains are significantly positive, with point estimates ranging between 230 and 370 kg per hectare. The results shown in Table 2 are somewhat incon- clusive regarding the relevance of controlling for non- simultaneous trials. This is because the magnitude of the coefficient corresponding to year of trial (T) is economi- cally significant for X ≥ 4, but it is not statistically sig- nificant. Negative values for βT mean that successive trials with the same variety have lower yields (e.g., 170 fewer kg per hectare per year in the case of regressions including TrialPeriod4Var), which could be due to the development of susceptibilities to plagues and diseases. For completeness, Table 3 reports results of regres- Figure 4. Average yields for tomato varieties introduced sions without controlling for the non-simultaneous trials between 1977 and 2002 in the United States. Source: Prepared from data supplied by the Vegetable (i.e., regressions analogous to Regressions 1 and 2 Research and Information Center at the University of Califor- above, but excluding explanatory variable T), and Fig- nia’s Cooperative Extension Service. ure 4 depicts the plot of average tomato yields versus year of introduction for the seven varieties for which tri- Results for Regression 2 corresponding to X = 1 through als were performed over at least six years. The estimated X = 8 are shown in columns three through ten of Table 2, slope in Figure 4 is 135 kg per hectare per year, which is respectively. somewhat smaller than the coefficient estimates The results reported in Table 2 suggest that it is reported in Table 3. The slope in Figure 4 is different indeed important to account for survivorship bias, from the estimates in Table 3 because it is based on a because TrialPeriodXVar has strong negative signifi- smaller data set, and also because the regression for Fig- cance for X ≥ 3. For example, all else equal, varieties ure 4 was performed using only the average yield for characterized by four or fewer years between their first each variety across all trials, whereas the regressions and last trials are estimated to yield 2,870 kg per hectare reported in Table 3 were fitted using the original data Hayes, Lence & Goggi — Impact of Intellectual Property Rights in the Seed Sector on Crop Yield Growth and Social Welfare
- 14. AgBioForum, 12(2), 2009 | 168 (which contained a different number of trials for each According to Orsetti (1980), the early varieties of variety). hybrid tomato seed did not always provide large yield Overall, it seems safe to conclude that annual increases but did provide more consistent yields. In genetic gains in tomato yields have been somewhere addition, hybridization allowed seed producers to more between 190 and 340 kg per hectare between 1977 and rapidly develop new varieties resistant to diseases and 1999. To put such gains in perspective, note that the insects. Data provided in Grandillo et al. (1999) show average yield in the entire sample is 38,900 kg per hect- the gradual adoption of hybrid varieties by the Califor- are. Because tomato fruits have a substantial water con- nia processing sector in the period after that examined tent, typically ranging between 92.5% to 95% of the by Orsetti (1980). Market share of hybrid seeds rose total fruit weight (Heuvelink, 2005), the gains in total from about 20% in 1980 to approximately 90% in 1990, tomato fruit weight per year exceed that of wheat and and did not reach 100% until 1994. corn crops. However, when we translate the gain into Our discussions with industry experts and our dry matter assuming a 6.25% dry matter content in review of the recent literature showed that while the pri- tomato fruits (the midpoint of the dry matter content vate sector is responsible for almost all sales of tomato reported by Heuvelink, 2005), the rate of gain falls to seeds, the private sector is not the primary producer of between 11.9 and 21.2 kg per hectare per year. This is basic research to improve yields or enhance quality. lower than the rate of dry matter gain in wheat and corn Instead, public sector researchers in Florida, Israel, the we reported in the previous sections. Netherlands, California, and Wisconsin have developed Hybrid vigor has been recognized in tomatoes since and licensed some of the key commercial traits. These at least 1952 (Whaley, 1952). However, the technology licenses are typically owned by quasi-private research was not accepted by processing tomato growers until foundations that act like the private sector when collect- 1971, and even then the rate of uptake was extremely ing returns on IP but retain some of the fees as a means slow. Orsetti (1980) describes the rate of adoption in the to repay the public sector that funded the original first eight years since introduction and provides reasons research. for the slow adoption. The main reason he gives for the The relative lack of private sector basic research and slow rate of uptake is that producers did not anticipate the late adoption of hybrid tomatoes compared to hybrid sufficient yield increases to cover the substantially corn poses a challenging question. Why didn’t the pri- higher costs of those hybrid seeds. vate sector step in and dominate the hybrid tomato seed The cost of hybrid tomato seeds is high because their research as it has done for hybrid corn? One would production is very labor intensive and relatively diffi- imagine that the protection offered through the hybrid cult.14 Male and female sources must be planted in sep- process would provide a sufficiently large IP incentive arate areas of the field, and the female plants must be to encourage full private sector participation in all fertilized manually by shaking the male flowers to col- aspects of the research processes. Part of the answer is lect the pollen and fertilize the females by hand. In order that this process is in fact ongoing. It has occurred at a to avoid self-fertilization, the females must be manually slower pace in tomatoes because the crop is commer- emasculated before the male pollen is introduced. This cially less important than corn and because the hybrid process must be repeated on a daily basis until the varieties were discovered later and provided a relatively blooming cycle is completed. In 1980, this labor-inten- smaller yield advantage (after considering the substan- sive process resulted in costs for hybrids seeds that were tially higher cost of hybrid tomato seeds) than in corn. five times greater than open-pollinated seeds (Orsetti, Another related explanation is that the effective 1980). Currently, some companies produce hybrid strength of IP protection is weaker in tomato hybrids tomato seeds in South America and the Far East to take than in corn hybrids. Approximately half of the pro- advantage of the lower labor costs in those regions. cessed tomato acres in the United States are grown from Nonetheless, the price of hybrid tomato seeds is transplants rather than seed. By raising plants up to a between three and ten times the price of seeds of open- sapling stage in nurseries and then transplanting them pollinated varieties (Paul, 2004). into the field, growers can reduce the time needed to get a stand. Transplants are widely used because they stretch out the growing season, allowing the tomato pro- 14. A comprehensive description of the processes involved in the cessing factory to remain in production as long as possi- production hybrid tomato seeds is provided in Opeña, Chen, ble during the season. However, this wide use of Kalb, and Hanson (2001). processed tomatoes grown from transplants may also Hayes, Lence & Goggi — Impact of Intellectual Property Rights in the Seed Sector on Crop Yield Growth and Social Welfare
- 15. AgBioForum, 12(2), 2009 | 169 reduce the effective level of IP protection, because sap- With only three cases, we do not have enough data to lings may be obtained by asexual reproduction from prove any causal relationship between IP and yield high-value hybrid tomato plants, rather than from growth or genetic gain. However, we can say that the seeds.15 Hence, it is possible for a tomato transplant to yield and genetic gain data for these three crops are as be a clone of a high-value hybrid plant, thus retaining all predicted by the Lence et al. (2005) model. The greater of its parent’s vigor. The effective level of IP protection the amount of effective IP (as measured by the ability of may be further reduced by the fact that most of the seed companies to profit from successful research), the world’s tomato acres are grown in places where US greater the genetic gain. companies would find it difficult to protect against this We were concerned that the rate of yield growth in kind of vegetative reproduction. corn might be inherently greater than in tomatoes and So, in essence, the tomato industry is itself a hybrid wheat. Therefore, we compared IP protection in the EU that combines private sector research with public sector wheat market with that in the United States. We discov- research. Public sector research is still needed, as the ered that IP protection for EU wheat seed companies is private sector appears unwilling to incur the enormous much stronger because farmers pay license fees to the costs of the research undertaken in the public sector breeder when they buy new seed and when they replant because improvements might be copied. Importantly, seed from the previous year. These fees are mandated by the public sector is heavily reliant on IP itself, as much EU policy, and the breeder is not responsible for the of the outcome of its research is licensed to the private transaction costs. EU wheat yields have grown at a rate seed sector. This system has led to substantial genetic similar to that of US corn yields. gains in recent years. The Lence et al. (2005) model and a paper by Alston et al. (2002) both predicted that the seed companies Summary and Conclusions would not capture the full benefits associated with In this article we describe three cases in an attempt to improved varieties. We were able to calculate the pro- link private sector research incentives to resulting crop portion of total benefits associated with corn rootworm yield outcomes. This analysis is motivated by a recent control. These results suggest that the owner of the IP theoretical paper by Lence, Hayes, McCunn, Smith, and did obtain a very profitable return on the initial invest- Niebur (2005) that predicted that private sector IP ment. The results also indicate that corn growers incentives should be proportional to crop yield growth. received an even greater return on the additional fees In hindsight, the cases we chose were almost ideal for that they paid to the IP owner. These additional returns our purposes because the three crops provided a full are greater than one might have anticipated because of range of IP protections within a single country. the biofuel-driven increase in corn prices and the result- Our analysis, coupled with industry interviews, sug- ing need for the rotational flexibility associated with gests that IP protection in the US wheat market is weak rootworm control. because wheat growers are allowed to save seed and We were not able to break out returns to IP invest- because the wheat breeder is responsible for the costs, ments in tomatoes because we could not find accurate both transactional and reputational, associated with data on hybrid seed costs. However, it is clear that yields enforcing those IP rights that do exist. IP protection in in this sector have increased and that society as a whole the processed tomato sector is higher than in wheat has benefited from these yield increases. These yield because all processing tomatoes are now hybrids. How- increases have also helped the California tomato pro- ever, the possibility that protected tomato varieties could cessing industry maintain its international competitive- be asexually reproduced weakens IP and the incentive ness in this labor-intensive sector. for the private sector to fund the basic research that If our conclusions are correct, they suggest that the might lead to high-value varieties. IP protection in the law of unintended consequences is alive and well. Rules US corn market is strong, and as a result, the private that were put in place to protect US wheat growers may sector dominates in all aspects of the research process. in the end have worked against their long-term interests. US wheat acres are down about 30% from the levels seen in the early 1980s, and part of this reduction may 15. Tomato cuttings or sucker shoots can be easily rooted in be explained by the competitiveness of high-yielding water (e-mail communication from Dr. Gregory Welbaum, corn varieties that have successfully competed for land, Professor of Horticulture at Virginia Polytechnic Institute and despite what appear to be onerous seed corn costs. State University, dated November 30, 2007). Hayes, Lence & Goggi — Impact of Intellectual Property Rights in the Seed Sector on Crop Yield Growth and Social Welfare
- 16. AgBioForum, 12(2), 2009 | 170 References Cooperative Extension Service L-923). Manhattan, KS: Kan- sas State University. Alston, J.M., Hyde, J., Marra, M.C., & Mitchell, P.D. (2002). An ex ante analysis of the benefits from the adoption of corn root- Fufa, H., Baenziger, P.S., Beecher, B.S., Graybosch, R.A., worm resistant transgenic corn technology. AgBioForum, Eskridge, K.M., & Nelson, L.A. (2005). Genetic improve- 5(3), 71-84. Available on the World Wide Web: http:// ment trends in agronomic performances and end-use quality www.agbioforum.org/v5n3/v5n3a01-alston.htm. characteristics among hard red winter wheat cultivars in Nebraska. Euphytica, 144, 187-198. Babcock, B.A., & Foster, W.E. (1991). Measuring the potential contribution of plant breeding to crop yields: Flue-cured Grandillo, S., Zamir, D., & Tanksley, S.D. (1999). Genetic tobacco, 1954-87. American Journal of Agricultural Econom- improvement of processing tomatoes: A 20 years perspective. ics, 73(3), 850-859. Euphytica, 110, 85-97. Bell, D.E., & Shelman, M. (2006). Monsanto: Realizing biotech Heuvelink, E. (Ed.). (2005). Tomatoes. Oxfordshire, UK: CABI value in Brazil (Harvard Business School Case 507-018). Publishing. Cambridge, MA: Harvard University. Lence, S.H., Hayes, D.J., McCunn, A., Smith, S., & Niebur, B. Brancourt-Hulmel, M., Doussinault, G., Lecomte, C., Bérard, P., (2005). Welfare impacts of intellectual property protection in Le Buanec, B., & Trottet, M. (2003). Genetic improvement of the seed industry. American Journal of Agricultural Econom- agronomic traits of winter wheat cultivars released in France ics, 87(4), 951-968. from 1946 to 1992. Crop Science, 43, 37-45. Monsanto. (2007, June). Bt Cry3Bb1 corn biopesticide registra- Carew, R., & Devadoss, S. (2003). Quantifying the contribution of tion action document. Monsanto Company, St. Louis, MO. plant breeders’ rights and transgenic varieties to canola Moschini, G., Lapan, H., & Sobolevsky, A. (2000). Roundup yields: Evidence from Manitoba.” Canadian Journal of Agri- Ready® soybeans and welfare effects in the soybean complex. cultural Economics, 51(3), 371-395. Agribusiness: An International Journal, 16(1), 33-55. Casale, C. (2007a). Monsanto. Presented at the Bank of America Omaha World Herald. (1990, February 28). Wheat varieties 2007 basics/industrials conference, May 9, 2007, New York donated to KSU. City. Available on the World Wide Web: http://www.mon- santo.com/pdf/investors/2007/05-08-07.pdf. Opeña, R.T., Chen, J.T., Kalb, T., & Hanson, P. (2001, October). Hybrid seed production in tomato (Asian Vegetable Research Casale, C. (2007b). Growth drivers: Corn, US and international and Development Center [AVRDC] pub # 01-527). Shanhua, presentation. Presented at the Monsanto biennial investor day, Taiwan: AVRDC. Available on the World Wide Web: http:// November 8, 2007, St. Louis, MO. Available on the World www.avrdc.org/LC/tomato/seedhybrid.pdf. Wide Web: http://www.monsanto.com/pdf/investors/2007/11- 08-07-2_v2.pdf. Orsetti, P.T. (1980). How the use of hybrids has influenced the processing tomato industry in California. Acta Horticulturae, Council Regulation (EC) 2100/94, OJ No. L 227 (July 27, 1994). 100, 375-378. Donmez, E., Sears, R.G., Shroyer, J.P., & Paulsen, G.M. (2001). Parayil, G. (2003). Mapping technological trajectories of the green Genetic gain in yield attributes of winter wheat in the Great revolution and the gene revolution from modernization to glo- Plains. Crop Science, 41, 1412-1419. balization. Research Policy, 32(6), 971-990. Dunwell, J.M. (2005). Intellectual property aspects of plant trans- Paul, J. (2004, March 9). Tomato 444 named latest Texas super- formation. Plant Biotechnology Journal, 3(4), 371-384. star. AgNews (Texas A&M University System Agriculture Pro- Duvick, D.N., Smith, J.S.C., & Cooper, M. (2004). Long term gram news release). College Station, TX: Texas A&M selection in a commercial hybrid maize breeding program. In University. Available on the World Wide Web: http://agnews- J. Janick (Ed.), Plant breeding reviews, Part 2. Long term archive.tamu.edu/dailynews/stories/HORT/Mar0904a.htm. selection: crops, animals, and bacteria (Vol. 24, pp. 109-151). Paulsen, G.M. (2000). International contributions to the improve- New York: John Wiley & Sons. ment and marketing of Kansas wheat (Kansas State Univer- Fernandez-Cornejo, J. (2004). The seed industry in US agricul- sity Agricultural Extension and Cooperative Extension ture: An exploration of data and information on crop seed Service Bulletin 126). Lawrence, KS: Kansas State Univer- markets, regulation, industry structure, and research and sity. development (Agriculture Information Bulletin Number 786). Rice, M.E., & Oleson, J.D. (2005). Three-year summary of corn Washington, DC: Economic Research Service, US Depart- rootworm control products. Iowa State University Extension’s ment of Agriculture. Integrated Crop Management, IC-494(26, December 12, Food and Agriculture Organization of the United Nations (FAO). 2005), 215-217. Available on the World Wide Web: http:// (n.d.). FAOSTAT statistical database. Rome, Italy: FAO. www.ipm.iastate.edu/ipm/icm/2005/12-12/rootworm.html. Accessed on February 7, 2009 from http://faostat.fao.org/site/ Sankula, S. (2006). Quantification of the impacts on US agricul- 339/default.aspx. ture of biotechnology-derived crops planted in 2005. Unpub- Fritz, A., Martin, T.J., & Shroyer, J.P. (2002). 2145 hard red wheat lished manuscript, National Center for Food and Agricultural (Kansas State University Agricultural Experiment Station and Policy, Washington, DC. Available on the World Wide Web: Hayes, Lence & Goggi — Impact of Intellectual Property Rights in the Seed Sector on Crop Yield Growth and Social Welfare
- 17. AgBioForum, 12(2), 2009 | 171 http://www.ncfap.org/documents/ basic and applied research and diffusion. Agricultural Eco- 2005biotechExecSummary.pdf. nomics, 19, 127-143. Sankula, S., & Blumenthal, E. (2004). Impacts on US agriculture US Department of Agriculture, National Agricultural Statistics of biotechnology-derived crops planted in 2003—An update Service (NASS). (n.d.). National statistics and state and of eleven case studies. Unpublished manuscript, National county statistics: Tomatoes [database]. Washington, DC: Center for Food and Agricultural Policy, Washington, DC. Author. Accessed on June 11, 2009 from: http:// Available on the World Wide Web: http://www.ncfap.org/doc- www.nass.usda.gov/index.asp#. uments/2004finalreport.pdf. Whaley, W.G. (1952). Hybrid vigor in a tomato cross. Botanical Shearman, V.J., Sylvester-Bradley, R., Scott, R.K., & Foulkes, Gazette, 114(1), 63-72. M.J. (2005). Physiological processes associated with wheat Zaid, E., Hughes, H.G., Porceddu, E., & Nicholas, F. (2001). Glos- yield progress in the UK. Crop Science, 45, 175-185. sary of biotechnology for food and agriculture—A revised Steffey, K., & Gray, M. (2007). Comparing soil insecticides and and augmented edition of the glossary of biotechnology and Bt corn rootworm hybrids: Do root ratings make sense any- genetic engineering (FAO Research and Technology Paper 9). more? Department of Crop Sciences, University of Illinois’ Rome, Italy: Food and Agriculture Organization of the United The Bulletin, 15(Article 1, July 6), 121-123. Available on the Nations. World Wide Web: http://www.ipm.uiuc.edu/bulletin/arti- cle.php?id=796. Author Notes Thirtle, C., Bottomley, P., Palladino, P., Schimmelpfennig, D., & The American Seed Trade Association (ASTA) pro- Townsend, R. (1998). The rise and fall of public sector plant vided funding and data for the present research project. breeding in the United Kingdom: A causal chain model of Hayes, Lence & Goggi — Impact of Intellectual Property Rights in the Seed Sector on Crop Yield Growth and Social Welfare