SlideShare una empresa de Scribd logo
1 de 30
Descargar para leer sin conexión
United States
Department of
Agriculture
Foreign
Agricultural
Service
December 2013

Global milk production among major exporting nations1 is set to rebound in 2014 with output
forecast to grow by 1.5 percent to 275.8 million tons – up about 4.2 million tons - largely due to
higher milk prices, favorable weather, and lower feed costs. This in contrast to 2013, when milk
output among the five major countries fell slightly due to a short but severe drought in New Zealand
and cold spring weather in the EU which coupled with high feed prices negatively impacted
farmers. The most significant percentage increase in production is expected to occur in New
Zealand where most of the milk is processed for the export market. High payout prices are
expected to spur dairy farmers to increase production by 5 percent or 891,000 tons. This is almost
the equivalent volume increase forecast for the EU.

Milk Production Among Major Global Dairy Exporters Forecast
to Increase by 1.5 Percent in 2014 (Metric Tons)
280,000
275,000
270,000
265,000
260,000
255,000
250,000
245,000
240,000
235,000
2005

2006

2007

2008

2009

2010

2011

1 Note: Major exporters are Argentina, Australia, EU, New Zealand, and U.S.A.

1
Approved by the World Agricultural Outlook Board/USDA

2012

2013(p)

2014 (f)
Dairy Production and Trade Developments
Summary
U.S. dairy exporters experienced an outstanding year and exceed all expectations with FY 2013
exports hitting a record $6.1 billion. This was partially due to reduced competition from such
traditional suppliers as the EU and New Zealand, the growing competitiveness of U.S. dairy
products and increased global demand for dairy products which continues to grow despite sharply
higher prices. This demand has been particularly impressive since prices for such commodities as
WMP have increased from about $3,300 per ton (Oceania FOB) in early January to approximately
$5,000 per ton in late November. Although not as dramatic, this has been similarly true for
skimmed milk powder (SMP) which over the same time span has increased from around $3,400 per
ton to $4,600 per ton. It is interesting to note that although the volume forecast to be supplied by
such suppliers as Australia and the EU in 2013 is expected to drop by 121,000 tons this is likely to
be offset by increased supplies from New Zealand, India, and the United States which results in a
net gain of 97,000 tons. Despite this significant additional volume, prices for SMP have remained
extraordinarily resilient signaling that demand particularly from China and other Asian markets
remains firm.
SMP Exports by Major Suppliers (1,000 tons)
Change in 2013
Change in 2014
forecast vs 2012
Forecast vs 2013
Australia
-13
+10
EU
-108
+60
India
+83
-30
New Zealand
+20
+10
United States
+115
-20
Net Change
+97
+30

For 2014, lower feed prices, favorable weather, and strength in global dairy prices are expected to
provide a strong incentive for farmers to produce more milk and milk production among selected
countries is set to grow by 2 percent. Despite the expectation of increased volumes, global dairy
prices for the main dairy commodities have recently started to trend up signaling that import
demand and more critically consumer demand appears to be unfazed by higher prices. The macroeconomic outlook supports this view as the income growth rate for Asia and Oceania in 2014 is
expected to reach 4.2 percent and in the critical Chinese market, it is forecast at 7.7 percent –
slightly higher than in 2013. In addition, dairy supply lines remain finely balanced as there are no
Government surplus stocks of dairy commodities overhanging markets and given the high prices of
2013 commercial stocks are likely to be minimal. Consequently, buyers will likely be covering
their needs well in advance and any potential interruptions due to adverse weather will undoubtedly
ratchet prices up even further.

2
Foreign Agricultural Service/USDA
Office of Global Analysis

December 2013
Milk Production: Forecast Summary

Milk Production Summary for Major Exporters
2012

Argentina
Australia
EU-28
New Zealand
United States
Total


1,679
9,811
139,000
20,567
90,824
271,881

(1,000 Metric Tons)
2013 (p)

11,796
9,570
139,100
19,678
91,444
271,588

2014(f)

Forecast %
Change

12,209
9,880
140,000
20,569
93,123
275,781

4%
2%
1%
5%
2%
2%

In 2013, dairy farmers in Argentina faced uneven weather conditions – dry conditions early
in the year followed by a delayed spring – which negatively affected milk production mostly
in the first half of the year. Production is expected to rebound in the second half of the year
and milk output for 2013 is anticipated to be up 1 percent over 2012. For 2014, milk
production in Argentina is forecast to expand by 4 percent over 2013 as a result of high
international prices for WMP and increased domestic demand for cheese which are expected
to improve producer margins. In addition, milk production is being concentrated in medium
to large farms which are more efficient. To this extent, although the milk herd in 2014 is
expected to remain about the same size as in 2013, milk production per cow is forecast to
improve by 4 percent to 5.57 tons per cow.

Source: Dairy Australia



For the current year, Australian milk production through October 2013 is down 6 percent

3
Foreign Agricultural Service/USDA
Office of Global Analysis

December 2013
over the same period last year but ample rains during the winter and improved fodder
availability is expected to boost milk output during the last quarter of the year.
Nevertheless, milk production for 2013 the year is forecast to be down over 2012 by 2
percent. Australian milk production in 2014 is set to expand by 3 percent driven by an
increase in the size of the herd and improved margins. At present, current domestic milk
prices have improved significantly in comparison to last year due in large part to the
strength of global dairy markets and a decline in the value of the Australian dollar.


In the EU, milk production in 2013 is forecast to grow marginally due to a significant lag in
output during the first half of the year. During this period, farmers faced high production
costs, severe winter conditions, and a delayed spring which resulted in milk production
through June lagging by 2 percent in comparison to the same period last year. Milk output
in the second half of the year is anticipated to rebound as favorable weather has led to a
decline in feed prices, improved pastures and higher farm-gate milk prices which have
considerably improved margins. For 2014, the long term contraction of the dairy herd is
expected to an end and cow inventories are expected to stabilize at about the same level as
in 2013. Milk production, however, is anticipated to grow by 1 percent due to improved
milk per cow productivity. Most of the additional milk is expected to flow into the
production of cheese. Over the longer term, the EU’s milk production quota is scheduled to
be discontinued on April 1, 2015 and this is expected to further encourage farmers to expand
dairy herds.

Source: Eurostat



Although New Zealand milk production for 2013 through September is down 6 percent
relative to the same period last year, milk output in August and September in comparison to
the same months in 2012, was up 9 percent and 7 percent, respectively. This end-year boost
in output as the main phase of seasonal production ramps up is forecast to increase 2013
production and limit the decline to 4 percent from 2012. For 2014, the outlook is bright as

4
Foreign Agricultural Service/USDA
Office of Global Analysis

December 2013
farmers are expecting a significant increase in the 2013/14 milk price payout currently
anticipated to be between NZ$ 7.60-8.60 per kilogram of milk solids. Consequently, milk
production is forecast to grow by 5 percent as the herd is expected to expand by 68,000
cows and milk per cow output is forecast to increase by 3 percent. The near term climatic
outlook is currently neutral between an El Niño and La Niña weather patterns which would
likely lead to normal amounts of rainfall.

Source: DCANZ



In the United States, milk production for 2014 is set to enter into a strong expansionary
phase as low feed prices coupled with strong dairy product prices are expected to result in
high milk feed ratios. Although the herd is forecast to grow by 30,000 head, the majority of
the increase in output will be due to a 1 percent increase in milk per cow.

Cheese:


In the United States, cheese production is set to grow by almost 2 percent in 2013 and is
forecast to keep increasing in 2014 by less than 2 percent to reach 5.1 million MT. The U.S.
trade sector has experienced a boom as cheese exports in 2013 through October are up 17
percent over 2012. As a result the 2013 July export forecast is revised up by 7 percent to
reach a record 307,000 tons. Exports of fresh cheese have been notable for their explosive
growth, rising from 17,000 tons in 2009 to 57,000 tons in 2012. In 2013, exports of fresh
cheese through October have nearly reached 83,000 tons far surpassing the pace of 2012.
Although fresh cheeses can include a broad range of fresh cheeses (cottage, cream, etc.) it is
likely that the majority of cheese being shipped consists of mozzarella cheese. The
principal destinations for these fresh cheeses in 2013 have so far been South Korea, Mexico,
and China. For 2014, total U.S. cheese exports are forecast to decline slightly to 303,000
tons as increased competition from the EU and Oceania are expected to displace U.S.
cheeses. U.S. domestic consumption is expected to remain fairly robust and grow by almost
2 percent; consequently, ending stocks in 2014 are anticipated to hit the lowest level since
2004.
5

Foreign Agricultural Service/USDA
Office of Global Analysis

December 2013


The EU’s domestic consumption of cheese continues to be the driving force behind the
domestic dairy market accounting for nearly 70 percent of the milk supply (factory use
milk) used for dairy production. For 2014, EU cheese production is forecast to expand by 1
percent as high global prices and increased availability of fluid milk is expected to stimulate
output. As a result, 2014 cheese exports are forecast to grow by 3 percent to 825,000 tons.
In 2013, about one third of total cheese exports through September were shipped to Russia
and for 2014 Russia and the United States are likely to remain major markets.



Oceania cheese exports are forecast to decline in 2013 by 2 percent but then are expected to
rebound in 2014 by 7 percent largely due to increased exports from New Zealand. In 2013,
New Zealand cheese exports are forecast to drop by 8 percent largely due to the lower
availability of milk supplies following a drought in the first half of the year. For 2014,
increased supplies of milk, improved cheese margins, growing demand for ingredient
cheese, and higher prices for whey by-products are expected to promote increased output.
Consequently, production – of mostly cheddar - is forecast to grow by 2 percent to 320,000
tons and exports are anticipated to expand by 7 percent.

SMP:
 Chinese imports of SMP have been growing at an impressive clip averaging 32 percent
growth over the 2009-2012 periods and China in 2013 will likely become the largest single
import market for SMP. For 2014, Chinese production of SMP relative to 2013 is forecast
to slip by 6 percent to 51,000 tons as demand for milk for other uses limits availability for
SMP production. Domestic demand, however, remains robust driven by an increasingly
affluent population and a continuing distrust of the quality of domestically sourced supplies;
consequently, imports are forecast to grow by 16 percent to reach 250,000 tons in 2014.



Since the lifting of an export ban in June 2012, Indian exports of SMP in 2013 have accelerated and

6
Foreign Agricultural Service/USDA
Office of Global Analysis

December 2013
shipments through September are up over six fold in comparison to the same period in the previous
year. Consequently, exports in 2013 are expected to reach a record 120,000 tons. The principal
destination for this SMP has been Bangladesh, Yemen, and Algeria. For 2014, although the
production of SMP is expected to grow by 6 percent, exports are expected to decline but still remain
at a relatively high volume of 90,000 tons.


Limited supplies of milk in the EU during 2013 are expected to lead to a 5 percent decline in the
production of SMP which is forecast to result in a sharp 21 percent drop in SMP exports compared
to 2012. For 2014, despite strong global prices, the processing of milk into cheese is likely to be
financially more attractive than producing SMP and output is forecast to rebound by only 5 percent.
Although EU SMP shipments are anticipated to rebound by 15 percent in 2014 they are expected to
well below shipment levels reached in 2011 and 2012.



Mexican imports of SMP for 2013 through August are reported down 17 percent in comparison to
the same period last year. Consequently, the July 2013 forecast has been revised down to 200,000
tons. For 2014, Mexican imports of SMP are expected to recover, increasing by 5 percent as
domestic supplies are unable to meet the growing domestic market for dairy products.



In Oceania, total exports of SMP for 2013 are forecast to grow marginally by 1 percent over 2012 as
the increase in New Zealand exports is likely to be offset by a decline in Australian shipments. For
2014, Oceania exports are forecast to increase by 4 percent or 20,000 tons of SMP. In the case of
New Zealand, the vast majority of the increased milk supply will be directed to the production of
WMP because of its relative profitability with respect to SMP/butter production.



U.S. exports of SMP have been booming and are forecast to reach a record 560,000 tons in 2013.
U.S. exporters of SMP, based on shipment data through October 2013, appear to have made
significant gains over the comparable period in 2012 to such key Asian markets as China,
Philippines, Indonesia, and Vietnam and Malaysia. The gains in sales to China have been
particularly notable as exports of SMP in 2013 through October are up over 254 percent over the
same period in 2012. For 2014, exports are forecast to decline by 4 percent to 540,000 tons as
increased competition from the EU and to a lesser extent New Zealand, are expected to displace U.S.
sales.

WMP:


Global WMP markets continue to be dominated by China’s seemingly insatiable demand for imports
of WMP. For 2013, China’s imports of WMP are slated to increase by 32 percent over 2012 to reach
535,000 tons. Demand does not appear to be particularly price sensitive since Oceania FOB prices
of WMP increased from about $3,340 per ton in January 2013 to over $6,000 per ton in April 2013
and has averaged approximately $4,670 per ton for most of the year. In fact, the average (Oceania
FOB mid-point) price of WMP in 2013 through November is up 44 percent in comparison to the
average mid-point price ($3,230 per ton) posted in 2012. China’s imports for 2014 are forecast to
grow by 22 percent over 2013 to reach 650,000. This equates to an extra 115,000 tons of imported
volume. Although domestic WMP production is expected to increase by 7 percent in 2014, strong
demand for use of WMP in the production of processed products such as infant formula, yogurt,
beverage drinks, etc., continues to outstrip domestic supply and drive import growth.



In New Zealand, WMP production remains the most profitable relative to other dairy products
given current export prices. This situation is expected to persist in early 2014, and WMP production

7
Foreign Agricultural Service/USDA
Office of Global Analysis

December 2013
for 2014 is expected to grow by 2 percent over 2013. In 2013, WMP production is likely to remain
stagnant relative to 2012 due to early-year drought conditions. Consequently, exports are forecast to
expand by only 1 percent over 2012. China has become New Zealand’s major customer for WMP
and in 2012 China accounted for about one third of New Zealand’s total exports of WMP. For 2013,
New Zealand’s exports to China through October accounted for about 43 percent of its total exports.
For 2014, New Zealand’s exports of WMP are pegged at 1.35 million tons – an increase of 6 percent.


Although the 2013 WMP production forecast for the EU was revised up by 645,000 tons this still
represents a decline of 2 percent from 2012. Cold weather and a delayed spring in the first half of
2013 reduced milk flows and available supplies were channeled primarily into the production of
cheese. For 2014, increased milk availability is expected increase WMP output and exports are
slated to increase by 1 percent or 5,000 tons over 2013 to reach 375,000 tons.

Butter:


New Zealand remains the dominant exporter of butter accounting for about 65 percent of total trade
among the major exporters. This share is not expected to change significantly in 2013 or 2014.
Butter production in 2013 is forecast to drop by 4 percent from 2012 which is expected to lead a
drop of 7 percent in exports. The situation is expected to reverse in 2014, with butter output pegged
to grow by 4 percent relative to 2013. Similarly, exports are set to increase by 7 percent to 510,000
tons. Iran, Egypt, and Russia have in the past been the leading destinations for New Zealand butter,
however, recently China has rapidly emerged to become a primary destination accounting for 10
percent of total New Zealand butter exports in 2012. For 2013, China remains a leading destination
and will likely account for the same proportion of total New Zealand exports as in 2012.



The 2013 U.S. forecast for U.S. exports of butter has been revised from July to 91,000 tons - up
almost double the 2012 level. Saudi Arabia is the leading destination accounting for about 22
percent of total butter exports for the year through October. For 2014, butter exports are expected to
drop by 23 percent over 2013 as increased exportable supplies in the EU and New Zealand are
expected to sharpen the competitive landscape for U.S. exporters.

8
Foreign Agricultural Service/USDA
Office of Global Analysis

December 2013
International Prices
Cheese Prices - Oceania FOB $/MT
5,500
5,000
4,500
4,000
3,500
3,000
2,500

Range

Mid-point

Butter Prices - Oceania FOB $/MT
5,500
5,000
4,500
4,000
3,500
3,000
2,500

Range

Mid-Point

9
Foreign Agricultural Service/USDA
Office of Global Analysis

December 2013
SMP Prices - Oceania FOB $/MT
7,000
6,500
6,000
5,500
5,000
4,500
4,000
3,500
3,000
2,500

Range

Mid-Point

WMP Prices - Oceania FOB $/MT
7,000
6,500
6,000
5,500
5,000
4,500
4,000
3,500
3,000
2,500
2,000

Range

Mid-point

Source: Agricultural Marketing Service, USDA

10
Foreign Agricultural Service/USDA
Office of Global Analysis

December 2013
COWS MILK: SUMMARY FOR SELECTED COUNTRIES
1,000 Head

Milk Cow Numbers

2009

2010

2011

2012

(p) 2013

(f) 2014

North America
Canada
Mexico
United States
Sub-total

979

981

983

960

961

955

6,400

6,480

6,400

6,350

6,300

6,300

9,203

9,119

9,194

9,233

9,220

9,250

16,582

16,580

16,577

16,543

16,481

16,505

South America
Argentina

2,100

2,100

2,150

2,193

2,193

2,193

17,200

17,600

19,200

19,900

20,450

20,859

Sub-total

19,300

19,700

21,350

22,093

22,643

23,052

European Union - 28

24,192

23,566

23,122

23,051

23,052

23,050

8,450

Brazil

Former Soviet Union
Russia

9,530

8,858

8,650

8,600

8,515

Ukraine

2,856

2,736

2,631

2,582

2,554

2,540

Sub-total

12,386

11,594

11,281

11,182

11,069

10,990

42,600

43,600

44,900

46,400

48,250

50,100

China

7,115

7,320

7,620

8,000

8,380

8,900

Japan

848

830

805

813

798

800

7,963

8,150

8,425

8,813

9,178

9,700

Australia

1,676

1,596

1,620

1,650

1,650

1,660

New Zealand

4,597

4,680

4,816

5,018

5,043

5,111

6,273

6,276

6,436

6,668

6,693

6,771

129,296

129,466

132,091

134,750

137,366

140,168

GCAD/OGA/FAS

Dec 2013

South Asia
India
Asia

Sub-total
Oceania

Sub-total
TOTAL SELECTED COUNTRIES

Source: FAS post reports, official statistics, and office research.
Notes: (p)Preliminary
(f) Forecast.

Foreign Agricultural Service/USDA
Office of Global Analysis

December 2013
COWS MILK: SUMMARY FOR SELECTED COUNTRIES
1,000 Metric Tons

Fluid Milk Production

2009

2010

2011

2012

(p) 2013

(f) 2014

8,280

8,350

8,400

8,614

8,535

8,450
11,350

North America
Canada
Mexico

10,866

11,033

11,046

11,274

11,270

United States

85,880

87,474

88,978

90,824

91,444

93,123

105,026

106,857

108,424

110,712

111,249

112,923

Sub-total
South America
Argentina

10,350

10,600

11,470

11,679

11,796

12,209

Brazil

28,795

29,948

30,715

31,490

32,380

33,375

39,145

40,548

42,185

43,169

44,176

45,584

133,700

135,472

138,220

139,000

139,100

140,000

Sub-total
European Union - 28 1/
Former Soviet Union
Russia

32,600

31,847

31,646

31,917

31,400

31,400

Ukraine

11,370

10,977

10,804

11,080

11,160

11,220

Sub-total

43,970

42,824

42,450

42,997

42,560

42,620

48,160

50,300

53,500

55,500

57,500

60,125

China

28,445

29,300

30,700

32,600

34,500

37,000

Japan

7,910

7,721

7,474

7,631

7,560

7,580

Sub-total

36,355

37,021

38,174

40,231

42,060

44,580

9,326

9,327

9,568

9,811

9,570

9,880

South Asia
India
Asia

Oceania
Australia
New Zealand

TOTAL SELECTED COUNTRIES

16,983

17,173

18,965

20,567

19,678

20,569

26,309

26,500

28,533

30,378

29,248

30,449

432,665

439,522

451,486

461,987

465,893

476,281

GCAD/OGA/FAS

Sub-total

Dec 2013

Source: FAS post reports, official statistics, and office research.
Notes:
(p) Preliminary.
(f) Forecast.
(1) Based on deliveries

Foreign Agricultural Service/USDA
Office of Global Analysis

December 2013
COWS MILK : SUMMARY FOR SELECTED COUNTRIES
MT/Head
Fluid Milk Production Per Cow

2009

2010

2011

2012

(p) 2013

(f) 2014

Canada

8.46

8.51

8.55

8.97

8.88

8.85

Mexico

1.70

1.70

1.73

1.78

1.79

1.80

United States

9.33

9.59

9.68

9.84

9.92

n.a.

Argentina

4.93

5.05

5.33

5.33

5.38

5.57

Brazil

1.67

1.70

1.60

1.58

1.58

1.60

5.53

5.75

5.98

6.03

6.03

6.07

Russia

3.42

3.60

3.66

3.71

3.69

3.72

Ukraine

3.98

4.01

4.11

4.29

4.37

4.42

1.13

1.15

1.19

1.20

1.19

1.20

China

4.00

4.00

4.03

4.08

4.12

4.16

Japan

9.33

9.30

9.28

9.39

9.47

9.48

Australia

5.56

5.84

5.91

5.95

5.80

5.95

New Zealand

3.69

3.67

3.94

4.10

3.90

4.02

GCAD/OGA/FAS

Dec 2013

North America

South America

European Union - 28 1/
Former Soviet Union

South Asia
India
Asia

Oceania

Source: FAS post reports, official statistics, and office research.
Notes:
(p) Preliminary.
(f) Forecast.
(1) Based on deliveries

Foreign Agricultural Service/USDA
Office of Global Analysis

December 2013
COWS MILK: SUMMARY FOR SELECTED COUNTRIES
1,000 Metric Tons

Fluid Milk Consumption

2009

2010

2011

2012

(p) 2013

(f) 2014

3,103

3,184

3,164

3,040

3,014

3,000

North America
Canada
Mexico
United States
Sub-total

5,206

5,167

4,100

4,168

4,171

4,209

28,550

28,896

28,281

28,769

28,884

29,121

36,859

37,247

35,545

35,977

36,069

36,330

South America
Argentina

2,100

2,130

2,093

2,133

2,155

2,200

10,895

11,278

11,429

11,712

12,000

12,415

Sub-total

12,995

13,408

13,522

13,845

14,155

14,615

European Union - 28

33,700

33,738

33,870

33,800

33,500

33,400

Russia

12,114

11,775

11,650

11,040

10,615

10,640

Ukraine

3,483

5,342

5,442

5,588

5,667

5,692

Sub-total

15,597

17,117

17,092

16,628

16,282

16,332

48,160

49,140

51,660

52,000

54,400

57,460

China

11,791

12,060

12,600

13,517

14,350

15,460

Japan

4,264

4,150

4,058

4,045

3,950

3,950

Sub-total

16,055

16,210

16,658

17,562

18,300

19,410

2,272

2,284

2,422

2,511

2,525

2,550

Brazil

Former Soviet Union

South Asia
India
Asia

Oceania
Australia 2/
New Zealand

TOTAL SELECTED COUNTRIES

300

300

300

275

300

300

2,572

2,584

2,722

2,786

2,825

2,850

165,938

169,444

171,069

172,598

175,531

180,397

GCAD/OGA/FAS

Sub-total

Dec 2013

Source: FAS post reports, official statistics, and office research.
Notes:
(p) Preliminary.
(f) Forecast.

Foreign Agricultural Service/USDA
Office of Global Analysis

December 2013
CHEESE PRODUCTION: SUMMARY FOR SELECTED COUNTRIES
1,000 Metric Tons

2009

2010

2011

2012

(p) 2013

(f) 2014

North America
Canada 1/

291

297

300

549

550

545

Mexico

242

264

270

264

270

270

4,570

4,737

4,806

4,940

5,035

5,115

5,103

5,298

5,376

5,753

5,855

5,930

United States
Sub-total
South America
Argentina

530

540

572

564

570

589

Brazil

614

648

679

700

722

736

Sub-total

1,144

1,188

1,251

1,264

1,292

1,325

European Union - 28

8,739

8,959

8,981

9,142

9,175

9,250

Former Soviet Union
Russia

400

438

425

446

420

425

Ukraine

228

212

185

145

147

150

Sub-total

628

650

610

591

567

575

Asia
Japan

45

48

45

47

47

48

Korea

23

27

25

23

27

27

Philippines
Sub-total

2

2

2

2

2

2

70

79

86

82

84

77

321

319

339

330

329

360

Oceania
Australia
New Zealand

TOTAL SELECTED COUNTRIES

308

268

300

321

314

320

629

587

639

651

643

680

16,313

16,761

16,943

17,483

17,616

17,837

GCAD/OGA/FAS

Sub-total

Dec 2013

Source: FAS post reports, official statistics, and office research.
Notes:
(p) Preliminary.
(f) Forecast.
1/ Includes fresh cheese 2012 onwards

Foreign Agricultural Service/USDA
Office of Global Analysis

December 2013
CHEESE CONSUMPTION: SUMMARY FOR SELECTED COUNTRIES
1,000 Metric Tons

2009

2010

2011

2012

(p) 2013

(f) 2014

318

318

313

537

560

565

North America
Canada 1/
Mexico
United States
Sub-total

311

338

344

349

366

366

4,540

4,638

4,716

4,788

4,851

4,939

5,169

5,294

5,373

5,674

5,777

5,870

South America
Argentina

495

490

514

513

518

528

Brazil

624

666

715

724

751

762

Sub-total

1,119

1,156

1,229

1,237

1,269

1,290

European Union - 28

8,245

8,367

8,374

8,444

8,450

8,500

Former Soviet Union
Russia

690

780

759

792

789

798

Ukraine

160

144

117

95

105

113

Sub-total

850

924

876

887

894

911

295

Asia
Japan

229

247

260

282

290

Korea

72

88

101

101

112

113

Sub-total

301

335

361

383

402

408

220

225

256

240

232

248

24

24

30

32

34

35

244

249

286

272

266

283

15,928

16,325

16,499

16,897

17,058

17,262

GCAD/OGA/FAS

Dec 2013

Oceania
Australia
New Zealand
Sub-total

TOTAL SELECTED COUNTRIES

Source: FAS post reports, official statistics, and office research.
Notes:
(p) Preliminary.
(f) Forecast.
1/ Includes fresh cheese from 2012 onwards

Foreign Agricultural Service/USDA
Office of Global Analysis

December 2013
CHEESE IMPORTS: SUMMARY FOR SELECTED COUNTRIES
1,000 Metric Tons

2009

2010

2011

2012

(p) 2013

(f) 2014

North America
Canada 1/

24

25

25

25

25

25

Mexico

73

80

78

89

100

100

United States
Sub-total

131

110

110

122

115

109

228

215

213

236

240

234

South America
Argentina

3

3

3

3

3

2

16

22

39

27

31

29

Sub-total

19

25

42

30

34

31

European Union - 28

84

84

75

78

75

75

310

353

344

356

375

385

9

11

12

17

18

23

319

364

356

373

393

408

184

199

215

235

243

247

Brazil

Former Soviet Union
Russia
Ukraine
Sub-total
Asia
Japan
Korea

49

61

76

78

85

86

Philippines

15

15

17

20

17

18

248

275

308

333

345

351

65

76

72

76

76

76

6

6

5

5

5

5

71

82

77

81

81

81

969

1,045

1,071

1,131

1,168

1,180

GCAD/OGA/FAS

Dec 2013

Sub-total
Oceania
Australia
New Zealand
Sub-total

TOTAL SELECTED COUNTRIES

Source: FAS post reports, official statistics, and office research.
Notes:
(p) Preliminary.
(f) Forecast.
1/ Includes fresh cheese from 2012 onwards

Foreign Agricultural Service/USDA
Office of Global Analysis

December 2013
CHEESE EXPORTS: SUMMARY FOR SELECTED COUNTRIES
1,000 Metric Tons

2009

2010

2011

2012

(p) 2013

(f) 2014

Canada 1/

9

9

9

10

10

9

Mexico

4

6

4

4

4

4

108

173

225

260

307

303

121

188

238

274

321

316

48

45

60

54

55

60

6

4

3

3

2

3

63

53

43

54

49

53

578

676

682

776

800

825

21

11

9

10

10

10

North America

United States
Sub-total
South America
Argentina
Brazil
Sub-total
European Union - 28
Former Soviet Union
Russia
Ukraine

77

79

80

67

60

60

Sub-total

98

90

89

77

70

70

Oceania
Australia

162

160

168

163

180

190

New Zealand

290

265

253

306

280

300

452

425

421

469

460

490

1,312

1,432

1,473

1,650

1,700

1,754

GCAD/OGA/FAS

Dec 2013

Sub-total

TOTAL SELECTED COUNTRIES

Source: FAS post reports, official statistics, and office research.
Notes:
(p) Preliminary.
(f) Forecast.
1/ Includes fresh cheese from 2012 onwards

Foreign Agricultural Service/USDA
Office of Global Analysis

December 2013
BUTTER PRODUCTION: SUMMARY FOR SELECTED COUNTRIES 1/
1,000 Metric Tons

2009

2010

2011

2012

(p) 2013

(f) 2014

North America
Canada

86

80

85

98

92

88

Mexico

171

182

187

190

185

185

United States
Sub-total

713

709

821

843

852

865

970

971

1,093

1,131

1,129

1,138

South America
Argentina

51

55

63

58

60

62

Brazil

76

78

79

81

83

85

127

133

142

139

143

147

2,030

1,980

2,055

2,100

2,090

2,100

200

Sub-total
European Union - 28
Former Soviet Union
Russia

246

207

217

216

205

Ukraine

75

79

76

88

90

92

Sub-total

321

286

293

304

295

292

3,910

4,162

4,330

4,525

4,745

4,887

81

74

63

69

71

73

3,991

4,236

4,393

4,594

4,816

4,960

Asia
India
Japan
Sub-total
Oceania
Australia

118

132

121

119

117

122

New Zealand

482

441

487

527

506

525

519

519

519

519

519

519

7,958

8,125

8,495

8,787

8,992

9,156

GCAD/OGA/FAS

Dec 2013

Sub-total

TOTAL SELECTED COUNTRIES

Source: FAS post reports, official statistics, and office research.
Notes:
(p) Preliminary.
(f) Forecast.
(1) Includes Butteroil/AMF butter equivalent.

Foreign Agricultural Service/USDA
Office of Global Analysis

December 2013
BUTTER CONSUMPTION: SUMMARY FOR SELECTED COUNTRIES 1/
1,000 Metric Tons

2009

2010

2011

2012

(p) 2013

(f) 2014

North America
Canada

96

90

96

97

95

95

Mexico

224

231

222

226

238

238

United States
Sub-total

694

683

757

793

780

809

1,014

1,004

1,075

1,116

1,113

1,142

South America
Argentina

34

37

35

38

40

40

Brazil

81

75

78

80

82

84

115

112

113

118

122

124

1,894

1,934

1,982

2,031

2,033

2,035

348

Sub-total
European Union - 28
Former Soviet Union
Russia

349

319

330

335

348

Ukraine

90

84

78

96

101

105

Sub-total

439

403

408

431

449

453

3,910

4,170

4,320

4,525

4,736

4,876

74

86

83

77

72

74

Asia
India
Japan
Taiwan
Sub-total

14

16

18

18

19

19

3,998

4,272

4,421

4,620

4,827

4,969

Oceania
Australia

60

73

78

82

85

86

New Zealand

20

20

20

21

22

22

80

93

98

103

107

108

7,540

7,818

8,097

8,419

8,651

8,831

GCAD/OGA/FAS

Dec 2013

Sub-total

TOTAL SELECTED COUNTRIES

Source: FAS post reports, official statistics, and office research.
Notes:
(p) Preliminary.
(f) Forecast.
(1) Includes Butteroil/AMF butter equivalent.

Foreign Agricultural Service/USDA
Office of Global Analysis

December 2013
BUTTER IMPORTS: SUMMARY FOR SELECTED COUNTRIES 1/
1,000 Metric Tons

2009

2010

2011

2012

(p) 2013

(f) 2014

North America
Canada

12

8

10

7

7

8

Mexico

53

49

35

37

55

55

United States
Sub-total

17

10

12

18

13

15

82

67

57

62

75

78

7

2

0

1

1

1

84

93

66

63

65

65

150

South America
Brazil
European Union - 28
Former Soviet Union
Russia

107

113

116

119

145

Ukraine

16

6

4

8

12

14

Sub-total

123

119

120

127

157

164

India

28

25

0

8

0

0

Japan

0

3

15

10

1

4

Asia

Taiwan

14

16

18

18

19

19

Sub-total

42

44

33

36

20

23

18

19

19

21

23

25

1

1

1

0

1

1

19

20

20

21

24

26

357

345

296

310

342

357

GCAD/OGA/FAS

Dec 2013

Oceania
Australia
New Zealand
Sub-total

TOTAL SELECTED COUNTRIES

Source: FAS post reports, official statistics, and office research.
Notes:
(p) Preliminary.
(f) Forecast.
(1) Includes Butteroil/AMF butter equivalent.

Foreign Agricultural Service/USDA
Office of Global Analysis

December 2013
BUTTER EXPORTS: SUMMARY FOR SELECTED COUNTRIES 1/
1,000 Metric Tons

2009

2010

2011

2012

(p) 2013

(f) 2014

Canada

3

1

0

0

5

3

Mexico

0

0

0

1

2

2

North America

United States
Sub-total

30

59

65

47

91

70

33

60

65

48

98

75

17

15

27

21

20

22

2

5

1

2

2

2

19

20

28

23

22

24

149

154

124

120

120

120

1

1

2

0

1

1

28

11

11

8

9

9

5

10

15

28

4

10

South America
Argentina
Brazil
Sub-total
European Union - 28
Former Soviet Union
Ukraine
Asia
India
Sub-total
Oceania
Australia

87

58

42

54

55

62

492

429

449

509

475

510

Sub-total

579

487

491

563

530

572

TOTAL SELECTED COUNTRIES

786

732

725

782

775

802

GCAD/OGA/FAS

Dec 2013

New Zealand

Source: FAS post reports, official statistics, and office research.
Notes:
(p) Preliminary.
(f) Forecast.
(1) Includes Butteroil/AMF butter equivalent.

Foreign Agricultural Service/USDA
Office of Global Analysis

December 2013
SKIMMED MILK POWDER PRODUCTION: SUMMARY FOR SELECTED COUNTRIES
1,000 Metric Tons

2009

2010

2011

2012

(p) 2013

(f) 2014

North America
Canada

83

72

76

85

78

76

Mexico

25

13

26

55

55

55

United States 1/
Sub-total

786

824

882

973

979

1,015

894

909

984

1,113

1,112

1,146

33

35

39

32

32

33

South America
Argentina
Brazil
Sub-total
European Union - 28

125

130

132

141

151

154

158

165

171

173

183

187

1,080

1,060

1,180

1,270

1,210

1,270

70

42

55

57

50

50

Former Soviet Union
Russia
Ukraine

51

53

43

52

52

52

Sub-total

121

95

98

109

102

102

Asia
China

54

55

56

57

54

51

India

360

380

430

450

480

510
145

Japan

167

156

137

139

142

Korea

15

10

4

14

12

12

Sub-total

596

601

627

660

688

718

Australia

203

205

230

235

225

235

New Zealand

385

344

366

404

390

420

588

549

596

639

615

655

3,437

3,379

3,656

3,964

3,910

4,078

GCAD/OGA/FAS

Dec 2013

Oceania

Sub-total

TOTAL SELECTED COUNTRIES

Source: FAS post reports, official statistics, and office research.
Notes:
(p) Preliminary.
(f) Forecast.
(1) Includes NDM and SMP production.

Foreign Agricultural Service/USDA
Office of Global Analysis

December 2013
SKIMMED MILK POWDER CONSUMPTION: SUMMARY FOR SELECTED COUNTRIES
1,000 Metric Tons

2009

2010

2011

2012

(p) 2013

(f) 2014

North America
Canada

84

72

72

69

70

70

Mexico

190

168

220

291

255

265

United States 1/
Sub-total

568

434

438

522

433

460

842

674

730

882

758

795

South America
Argentina

17

18

19

18

18

18

135

144

163

174

179

180

Sub-total

152

162

182

192

197

198

European Union - 28

596

749

807

799

800

800

190

Brazil

Former Soviet Union
Russia

175

159

126

153

180

Ukraine

32

41

23

29

37

35

Sub-total

207

200

149

182

217

225

Asia
China

124

144

186

225

268

300

India

355

390

410

425

400

416

Indonesia

172

184

197

205

222

231

Japan

152

162

157

146

147

150

Korea

25

21

38

27

30

31

Philippines

89

97

92

96

100

105

917

998

1,080

1,124

1,167

1,233

50

56

68

76

80

80

1

3

3

3

4

4

51

59

71

79

84

84

2,765

2,842

3,019

3,258

3,223

3,335

GCAD/OGA/FAS

Dec 2013

Sub-total
Oceania
Australia
New Zealand
Sub-total

TOTAL SELECTED COUNTRIES

Source: FAS post reports, official statistics, and office research.
Notes:
(p) Preliminary.
(f) Forecast.
(1) Includes NDM and SMP.

Foreign Agricultural Service/USDA
Office of Global Analysis

December 2013
SKIMMED MILK POWDER IMPORTS: SUMMARY FOR SELECTED COUNTRIES
1,000 Metric Tons
2009

2010

2011

2012

(p) 2013

(f) 2014

North America
Canada
Mexico

3

3

3

3

3

2

165

155

194

236

200

210

United States 1/
Sub-total

0

0

0

2

1

1

168

158

197

241

204

213

South America
Argentina

0

0

0

0

0

0

11

14

31

33

28

26

11

14

31

33

28

26

6

4

0

2

5

5

105

117

71

96

130

140

8

2

2

3

1

3

113

119

73

99

131

143

93

98

129

112

125

115

China

70

89

130

168

215

250

India

3

20

32

14

0

0

178

189

196

205

225

230

Japan

34

30

27

32

33

32

Korea

10

8

34

19

18

18

112

110

111

106

110

115

407

446

530

544

601

645

Australia

4

5

5

3

5

5

New Zealand

4

3

2

5

3

3

8

8

7

8

8

8

806

847

967

1,039

1,102

1,155

GCAD/OGA/FAS

Dec 2013

Brazil
Sub-total
European Union - 28

Former Soviet Union
Russia
Ukraine
Sub-total
North Africa
Algeria
Asia

Indonesia

Philippines
Sub-total
Oceania

Sub-total

TOTAL SELECTED COUNTRIES

Source: FAS post reports, official statistics, and office research.
Notes:
(p) Preliminary.
(f) Forecast.
(1) Includes NDM and SMP.

Foreign Agricultural Service/USDA
Office of Global Analysis

December 2013
SKIMMED MILK POWDER EXPORTS: SUMMARY FOR SELECTED COUNTRIES
1,000 Metric Tons
2009

2010

2011

2012

(p) 2013

(f) 2014

10

North America
Canada

10

6

10

10

11

Mexico

0

0

0

0

0

0

248

384

435

445

560

540

258

390

445

455

571

550

13

20

18

14

16

15

United States 1/
Sub-total
South America
Argentina
Brazil
Sub-total
European Union - 28

1

0

0

0

0

0

14

20

18

14

16

15

231

379

518

523

415

475

0

0

0

0

0

0

Former Soviet Union
Russia
Ukraine

27

14

22

26

16

20

Sub-total

27

14

22

26

16

20

Asia
China

0

0

0

0

1

1

India

15

18

3

37

120

90

Indonesia

5

1

1

1

1

1

Philippines

15

15

17

12

6

8

35

34

21

50

128

100

Australia

167

132

140

168

155

165

New Zealand

408

343

362

390

410

420

575

475

502

558

565

585

1,140

1,312

1,526

1,626

1,711

1,745

GCAD/OGA/FAS

Dec 2013

Sub-total
Oceania

Sub-total

TOTAL SELECTED COUNTRIES

Source: FAS post reports, official statistics, and office research.
Notes:
(p) Preliminary.
(f) Forecast.
(1) Includes NDM and SMP.

Foreign Agricultural Service/USDA
Office of Global Analysis

December 2013
WHOLE MILK POWDER PRODUCTION: SUMMARY FOR SELECTED COUNTRIES
1,000 Metric Tons

2009

2010

2011

2012

(p) 2013

(f) 2014

North America
United States
Sub-total

27

32

30

26

34

35

27

32

30

26

34

35

South America
Argentina

210

210

309

281

284

294

Brazil

473

500

515

531

549

560

55

63

73

74

75

75

Sub-total

Chile

738

773

897

886

908

929

European Union - 28

790

780

685

660

645

650

Former Soviet Union
Russia

50

40

76

67

60

60

Ukraine

16

15

10

11

11

11

Sub-total

66

55

86

78

71

71

977

1,030

1,100

1,160

1,220

1,300

56

62

66

70

71

72

Asia
China
Indonesia
Taiwan
Sub-total

0

0

0

0

0

0

1,033

1,092

1,166

1,230

1,291

1,372

Oceania
Australia

137

147

148

120

120

130

New Zealand

768

947

1,162

1,273

1,275

1,300

905

1,094

1,310

1,393

1,395

1,430

3,559

3,826

4,174

4,273

4,344

4,487

GCAD/OGA/FAS

Dec 2013

Sub-total

TOTAL SELECTED COUNTRIES

Source: FAS post reports, official statistics, and office research.
Notes:
(p) Preliminary.
(f) Forecast.

Foreign Agricultural Service/USDA
Office of Global Analysis

December 2013
WHOLE MILK POWDER CONSUMPTION: SUMMARY FOR SELECTED COUNTRIES
1,000 Metric Tons
2009

2010

2011

2012

(p) 2013

(f) 2014

North America
United States
Sub-total

35

29

30

25

28

29

35

29

30

25

28

29

South America
Argentina

54

75

89

90

91

92

517

533

569

601

606

618

Sub-total

571

608

658

691

697

710

European Union - 28

333

337

299

277

279

277

Russia

71

79

94

93

103

108

Ukraine

12

9

9

11

12

13

Sub-total

83

88

103

104

115

121

172

182

185

185

165

170

1,064

1,373

1,433

1,540

1,777

1,975

106

112

118

126

120

127

9

10

6

13

24

26

28

26

32

31

30

30

1,207

1,521

1,589

1,710

1,951

2,158

28

45

40

40

36

40

1

1

2

2

2

2

29

28

28

29

30

31

2,430

2,793

2,892

3,021

3,265

3,496

GCAD/OGA/FAS

Dec 2013

Brazil

Former Soviet Union

North Africa
Algeria
Asia
China
Indonesia
Philippines
Taiwan
Sub-total
Oceania
Australia
New Zealand
Sub-total
TOTAL SELECTED COUNTRIES

Source: FAS post reports, official statistics, and office research.
Notes:
(p) Preliminary.
(f) Forecast.

Foreign Agricultural Service/USDA
Office of Global Analysis

December 2013
WHOLE MILK POWDER IMPORTS: SUMMARY FOR SELECTED COUNTRIES
1,000 Metric Tons
2009

2010

2011

2012

(p) 2013

(f) 2014

18

7

8

10

8

6

18

7

8

10

8

6

North America
United States
Sub-total
South America
Argentina
Brazil
Sub-total

1

0

0

0

0

0

57

38

55

71

57

58

58

38

55

71

57

58

1

2

2

3

4

2

50

European Union - 28

Former Soviet Union
Russia

30

41

20

28

45

Ukraine

1

0

1

1

1

2

Sub-total

31

41

21

29

46

52

200

167

204

188

135

170

650

North Africa
Algeria
Asia
177

326

320

406

535

Indonesia

China

50

50

52

56

50

55

Philippines

36

40

30

35

32

36

Taiwan

28

26

32

31

30

30

Sub-total

291

442

434

528

647

771

15

15

13

9

12

10

1

2

1

1

1

1

16

17

14

10

13

11

615

714

738

839

910

1,070

GCAD/OGA/FAS

Dec 2013

Oceania
Australia
New Zealand
Sub-total
TOTAL SELECTED COUNTRIES

Source: FAS post reports, official statistics, and office research.
Notes:
(p) Preliminary.
(f) Forecast.

Foreign Agricultural Service/USDA
Office of Global Analysis

December 2013
WHOLE MILK POWDER EXPORTS: SUMMARY FOR SELECTED COUNTRIES
1,000 Metric Tons

2009

2010

2011

2012

(p) 2013

(f) 2014

9

10

8

11

12

12

9

10

8

11

12

12

211

North America
United States
Sub-total
South America
157

128

201

201

190

Brazil

Argentina

13

5

1

1

0

0

Chile

14

9

14

15

12

13

Sub-total

184

142

216

217

202

224

European Union - 28

458

445

388

386

370

375

Former Soviet Union
Russia

9

2

2

2

2

2

Ukraine

5

6

2

1

0

0

Sub-total

14

8

4

3

2

2

Asia
China

10

3

9

9

5

5

Philippines

27

30

24

22

8

10

37

33

33

31

13

15

Australia

133

115

116

109

90

100

New Zealand

818

949

1,110

1,261

1,275

1,350

951

1,064

1,226

1,370

1,365

1,450

1,653

1,702

1,875

2,018

1,964

2,078

GCAD/OGA/FAS

Dec 2013

Sub-total
Oceania

Sub-total
TOTAL SELECTED COUNTRIES

Source: FAS post reports, official statistics, and office research.
Notes:
(p) Preliminary.
(f) Forecast.

Foreign Agricultural Service/USDA
Office of Global Analysis

December 2013

Más contenido relacionado

La actualidad más candente

Daily livestock report feb 22 2013
Daily livestock report feb 22 2013Daily livestock report feb 22 2013
Daily livestock report feb 22 2013joseleorcasita
 
Dr Dev Kambhampati | USDA- Livestock & Poultry- World Markets & Trade
Dr Dev Kambhampati | USDA- Livestock & Poultry- World Markets & TradeDr Dev Kambhampati | USDA- Livestock & Poultry- World Markets & Trade
Dr Dev Kambhampati | USDA- Livestock & Poultry- World Markets & TradeDr Dev Kambhampati
 
19th february,2015 daily exclusive oryza rice e newsletter by riceplus magazine
19th february,2015 daily exclusive oryza rice e newsletter by riceplus magazine19th february,2015 daily exclusive oryza rice e newsletter by riceplus magazine
19th february,2015 daily exclusive oryza rice e newsletter by riceplus magazineRiceplus Magazine
 
13th may,2015 daily exclusive oryza rice e newsletter by riceplus magazine
13th may,2015 daily exclusive oryza rice e newsletter by riceplus magazine13th may,2015 daily exclusive oryza rice e newsletter by riceplus magazine
13th may,2015 daily exclusive oryza rice e newsletter by riceplus magazineRiceplus Magazine
 
Dairy market report 18th february 2015
Dairy market report   18th february 2015Dairy market report   18th february 2015
Dairy market report 18th february 2015Catherine Lascurettes
 
Sugar: World Markets and Trade
Sugar: World Markets and Trade Sugar: World Markets and Trade
Sugar: World Markets and Trade André Oliveira
 
Dairy market report 16th february 2015
Dairy market report   16th february 2015Dairy market report   16th february 2015
Dairy market report 16th february 2015Catherine Lascurettes
 
17th april,2015 daily exclusive oryza rice e newsletter by riceplus magazine
17th april,2015 daily exclusive oryza rice e newsletter by riceplus magazine17th april,2015 daily exclusive oryza rice e newsletter by riceplus magazine
17th april,2015 daily exclusive oryza rice e newsletter by riceplus magazineRiceplus Magazine
 
5th june (friday),2015 daily exclusive oryza e rice newsletter by riceplus ma...
5th june (friday),2015 daily exclusive oryza e rice newsletter by riceplus ma...5th june (friday),2015 daily exclusive oryza e rice newsletter by riceplus ma...
5th june (friday),2015 daily exclusive oryza e rice newsletter by riceplus ma...Riceplus Magazine
 
7april 2014 ,(unedited) oryza news by riceplus magazine
7april 2014 ,(unedited) oryza news by riceplus magazine7april 2014 ,(unedited) oryza news by riceplus magazine
7april 2014 ,(unedited) oryza news by riceplus magazineRiceplus Magazine
 
14th m ay,2015 daily exclusive oryza rice e newsletter by riceplus magazine
14th m ay,2015 daily exclusive oryza rice e newsletter by riceplus magazine14th m ay,2015 daily exclusive oryza rice e newsletter by riceplus magazine
14th m ay,2015 daily exclusive oryza rice e newsletter by riceplus magazineRiceplus Magazine
 
4th may,2015 daily exclusive oryza rice e newsletter by riceplus magazine
4th may,2015 daily exclusive oryza rice e newsletter by riceplus magazine4th may,2015 daily exclusive oryza rice e newsletter by riceplus magazine
4th may,2015 daily exclusive oryza rice e newsletter by riceplus magazineRiceplus Magazine
 
2nd november ,2015 daily exclusive oryza rice e newsletter by riceplus magazine
2nd november ,2015 daily exclusive oryza rice e newsletter by riceplus magazine2nd november ,2015 daily exclusive oryza rice e newsletter by riceplus magazine
2nd november ,2015 daily exclusive oryza rice e newsletter by riceplus magazineRiceplus Magazine
 
July 30 (thursday),2015 daily exclusive oryza rice e newsletter by riceplus m...
July 30 (thursday),2015 daily exclusive oryza rice e newsletter by riceplus m...July 30 (thursday),2015 daily exclusive oryza rice e newsletter by riceplus m...
July 30 (thursday),2015 daily exclusive oryza rice e newsletter by riceplus m...Riceplus Magazine
 
Dairy market report milk price strategy
Dairy market report   milk price strategyDairy market report   milk price strategy
Dairy market report milk price strategyCatherine Lascurettes
 
15th april,2015 daily exclusive oryza rice e newsletter by riceplus magazine
15th april,2015 daily exclusive oryza rice e newsletter by riceplus magazine15th april,2015 daily exclusive oryza rice e newsletter by riceplus magazine
15th april,2015 daily exclusive oryza rice e newsletter by riceplus magazineRiceplus Magazine
 
10 foods more expensive
10 foods more expensive10 foods more expensive
10 foods more expensiveTravis Klein
 

La actualidad más candente (18)

Daily livestock report feb 22 2013
Daily livestock report feb 22 2013Daily livestock report feb 22 2013
Daily livestock report feb 22 2013
 
Dr Dev Kambhampati | USDA- Livestock & Poultry- World Markets & Trade
Dr Dev Kambhampati | USDA- Livestock & Poultry- World Markets & TradeDr Dev Kambhampati | USDA- Livestock & Poultry- World Markets & Trade
Dr Dev Kambhampati | USDA- Livestock & Poultry- World Markets & Trade
 
19th february,2015 daily exclusive oryza rice e newsletter by riceplus magazine
19th february,2015 daily exclusive oryza rice e newsletter by riceplus magazine19th february,2015 daily exclusive oryza rice e newsletter by riceplus magazine
19th february,2015 daily exclusive oryza rice e newsletter by riceplus magazine
 
13th may,2015 daily exclusive oryza rice e newsletter by riceplus magazine
13th may,2015 daily exclusive oryza rice e newsletter by riceplus magazine13th may,2015 daily exclusive oryza rice e newsletter by riceplus magazine
13th may,2015 daily exclusive oryza rice e newsletter by riceplus magazine
 
Dairy market report 18th february 2015
Dairy market report   18th february 2015Dairy market report   18th february 2015
Dairy market report 18th february 2015
 
Sugar: World Markets and Trade
Sugar: World Markets and Trade Sugar: World Markets and Trade
Sugar: World Markets and Trade
 
Dairy market report 16th february 2015
Dairy market report   16th february 2015Dairy market report   16th february 2015
Dairy market report 16th february 2015
 
17th april,2015 daily exclusive oryza rice e newsletter by riceplus magazine
17th april,2015 daily exclusive oryza rice e newsletter by riceplus magazine17th april,2015 daily exclusive oryza rice e newsletter by riceplus magazine
17th april,2015 daily exclusive oryza rice e newsletter by riceplus magazine
 
5th june (friday),2015 daily exclusive oryza e rice newsletter by riceplus ma...
5th june (friday),2015 daily exclusive oryza e rice newsletter by riceplus ma...5th june (friday),2015 daily exclusive oryza e rice newsletter by riceplus ma...
5th june (friday),2015 daily exclusive oryza e rice newsletter by riceplus ma...
 
7april 2014 ,(unedited) oryza news by riceplus magazine
7april 2014 ,(unedited) oryza news by riceplus magazine7april 2014 ,(unedited) oryza news by riceplus magazine
7april 2014 ,(unedited) oryza news by riceplus magazine
 
14th m ay,2015 daily exclusive oryza rice e newsletter by riceplus magazine
14th m ay,2015 daily exclusive oryza rice e newsletter by riceplus magazine14th m ay,2015 daily exclusive oryza rice e newsletter by riceplus magazine
14th m ay,2015 daily exclusive oryza rice e newsletter by riceplus magazine
 
4th may,2015 daily exclusive oryza rice e newsletter by riceplus magazine
4th may,2015 daily exclusive oryza rice e newsletter by riceplus magazine4th may,2015 daily exclusive oryza rice e newsletter by riceplus magazine
4th may,2015 daily exclusive oryza rice e newsletter by riceplus magazine
 
2nd november ,2015 daily exclusive oryza rice e newsletter by riceplus magazine
2nd november ,2015 daily exclusive oryza rice e newsletter by riceplus magazine2nd november ,2015 daily exclusive oryza rice e newsletter by riceplus magazine
2nd november ,2015 daily exclusive oryza rice e newsletter by riceplus magazine
 
July 30 (thursday),2015 daily exclusive oryza rice e newsletter by riceplus m...
July 30 (thursday),2015 daily exclusive oryza rice e newsletter by riceplus m...July 30 (thursday),2015 daily exclusive oryza rice e newsletter by riceplus m...
July 30 (thursday),2015 daily exclusive oryza rice e newsletter by riceplus m...
 
USDA Report May 2012
USDA Report May 2012USDA Report May 2012
USDA Report May 2012
 
Dairy market report milk price strategy
Dairy market report   milk price strategyDairy market report   milk price strategy
Dairy market report milk price strategy
 
15th april,2015 daily exclusive oryza rice e newsletter by riceplus magazine
15th april,2015 daily exclusive oryza rice e newsletter by riceplus magazine15th april,2015 daily exclusive oryza rice e newsletter by riceplus magazine
15th april,2015 daily exclusive oryza rice e newsletter by riceplus magazine
 
10 foods more expensive
10 foods more expensive10 foods more expensive
10 foods more expensive
 

Destacado

HPR Integrated Design - BIM/IPD Proposal Presentation
HPR Integrated Design - BIM/IPD Proposal PresentationHPR Integrated Design - BIM/IPD Proposal Presentation
HPR Integrated Design - BIM/IPD Proposal PresentationJosh Progar
 
Technology 2021
Technology 2021Technology 2021
Technology 2021jrtard01
 
The 3rd Thing UC Davis Gets You
The 3rd Thing UC Davis Gets YouThe 3rd Thing UC Davis Gets You
The 3rd Thing UC Davis Gets YouJoeRedHead
 
Technology 2021
Technology 2021Technology 2021
Technology 2021jrtard01
 
HPR Integrated Design - BIM/IPD Proposal Presentation
HPR Integrated Design - BIM/IPD Proposal PresentationHPR Integrated Design - BIM/IPD Proposal Presentation
HPR Integrated Design - BIM/IPD Proposal PresentationJosh Progar
 

Destacado (7)

Writer Group
Writer GroupWriter Group
Writer Group
 
HPR Integrated Design - BIM/IPD Proposal Presentation
HPR Integrated Design - BIM/IPD Proposal PresentationHPR Integrated Design - BIM/IPD Proposal Presentation
HPR Integrated Design - BIM/IPD Proposal Presentation
 
Technology 2021
Technology 2021Technology 2021
Technology 2021
 
The 3rd Thing UC Davis Gets You
The 3rd Thing UC Davis Gets YouThe 3rd Thing UC Davis Gets You
The 3rd Thing UC Davis Gets You
 
Technology 2021
Technology 2021Technology 2021
Technology 2021
 
Rut
RutRut
Rut
 
HPR Integrated Design - BIM/IPD Proposal Presentation
HPR Integrated Design - BIM/IPD Proposal PresentationHPR Integrated Design - BIM/IPD Proposal Presentation
HPR Integrated Design - BIM/IPD Proposal Presentation
 

Similar a International Dairy trade

Guide to Dairy Futures
Guide to Dairy FuturesGuide to Dairy Futures
Guide to Dairy FuturesHarry Hewitt
 
Dr Dev Kambhampati | USDA- Livestock, Dairy & Poultry Outlook (July 17, 2014)
Dr Dev Kambhampati | USDA- Livestock, Dairy & Poultry Outlook (July 17, 2014)Dr Dev Kambhampati | USDA- Livestock, Dairy & Poultry Outlook (July 17, 2014)
Dr Dev Kambhampati | USDA- Livestock, Dairy & Poultry Outlook (July 17, 2014)Dr Dev Kambhampati
 
Dr Dev Kambhampati | USDA- World Agricultural Supply & Demand Estimates
Dr Dev Kambhampati | USDA- World Agricultural Supply & Demand EstimatesDr Dev Kambhampati | USDA- World Agricultural Supply & Demand Estimates
Dr Dev Kambhampati | USDA- World Agricultural Supply & Demand EstimatesDr Dev Kambhampati
 
Dr Dev Kambhampati | USDA- EU- Livestock & Products Annual Report (2013)
Dr Dev Kambhampati | USDA- EU- Livestock & Products Annual Report (2013)Dr Dev Kambhampati | USDA- EU- Livestock & Products Annual Report (2013)
Dr Dev Kambhampati | USDA- EU- Livestock & Products Annual Report (2013)Dr Dev Kambhampati
 
Dr Dev Kambhampati | USDA- BRAZIL- Semi Annual Livestock & Products Report (2...
Dr Dev Kambhampati | USDA- BRAZIL- Semi Annual Livestock & Products Report (2...Dr Dev Kambhampati | USDA- BRAZIL- Semi Annual Livestock & Products Report (2...
Dr Dev Kambhampati | USDA- BRAZIL- Semi Annual Livestock & Products Report (2...Dr Dev Kambhampati
 
Relatório USDA - setembro de 2014
Relatório USDA - setembro de 2014Relatório USDA - setembro de 2014
Relatório USDA - setembro de 2014Portal Canal Rural
 
23rd january,2014 daily exclusive rice e newsletter by riceplus magazine
23rd january,2014 daily exclusive rice e newsletter by riceplus magazine23rd january,2014 daily exclusive rice e newsletter by riceplus magazine
23rd january,2014 daily exclusive rice e newsletter by riceplus magazineRiceplus Magazine
 
12th february,2014 daily exclusive oryza rice e newsletter by riceplus magazine
12th february,2014 daily exclusive oryza  rice e newsletter by riceplus magazine12th february,2014 daily exclusive oryza  rice e newsletter by riceplus magazine
12th february,2014 daily exclusive oryza rice e newsletter by riceplus magazineRiceplus Magazine
 
Milking the Emerging Market Dairy Demand | Aranca Articles and Publications
Milking the Emerging Market Dairy Demand | Aranca Articles and PublicationsMilking the Emerging Market Dairy Demand | Aranca Articles and Publications
Milking the Emerging Market Dairy Demand | Aranca Articles and PublicationsAranca
 
Analysis of new zealand milk supply situation
Analysis of new zealand milk supply situationAnalysis of new zealand milk supply situation
Analysis of new zealand milk supply situation恒州博智QYResearch
 
Milk scenario in 2015
Milk scenario in 2015Milk scenario in 2015
Milk scenario in 2015Sarwar Ali
 
Usda report march 2013
Usda report march 2013Usda report march 2013
Usda report march 2013joseleorcasita
 
Usda report december 2012
Usda report december 2012Usda report december 2012
Usda report december 2012joseleorcasita
 
30th january,2014 daily exclusive oryza rice e newsletter by riceplus magazine
30th january,2014 daily exclusive oryza rice e newsletter by riceplus magazine30th january,2014 daily exclusive oryza rice e newsletter by riceplus magazine
30th january,2014 daily exclusive oryza rice e newsletter by riceplus magazineRiceplus Magazine
 
Dr Dev Kambhampati | USDA- World Agricultural Production (July 2014)
Dr Dev Kambhampati | USDA- World Agricultural Production (July 2014)Dr Dev Kambhampati | USDA- World Agricultural Production (July 2014)
Dr Dev Kambhampati | USDA- World Agricultural Production (July 2014)Dr Dev Kambhampati
 

Similar a International Dairy trade (20)

Ldp m february 2013
Ldp m february 2013Ldp m february 2013
Ldp m february 2013
 
Guide to Dairy Futures
Guide to Dairy FuturesGuide to Dairy Futures
Guide to Dairy Futures
 
Dr Dev Kambhampati | USDA- Livestock, Dairy & Poultry Outlook (July 17, 2014)
Dr Dev Kambhampati | USDA- Livestock, Dairy & Poultry Outlook (July 17, 2014)Dr Dev Kambhampati | USDA- Livestock, Dairy & Poultry Outlook (July 17, 2014)
Dr Dev Kambhampati | USDA- Livestock, Dairy & Poultry Outlook (July 17, 2014)
 
Ldp m august 2012
Ldp m august 2012Ldp m august 2012
Ldp m august 2012
 
Dr Dev Kambhampati | USDA- World Agricultural Supply & Demand Estimates
Dr Dev Kambhampati | USDA- World Agricultural Supply & Demand EstimatesDr Dev Kambhampati | USDA- World Agricultural Supply & Demand Estimates
Dr Dev Kambhampati | USDA- World Agricultural Supply & Demand Estimates
 
Dr Dev Kambhampati | USDA- EU- Livestock & Products Annual Report (2013)
Dr Dev Kambhampati | USDA- EU- Livestock & Products Annual Report (2013)Dr Dev Kambhampati | USDA- EU- Livestock & Products Annual Report (2013)
Dr Dev Kambhampati | USDA- EU- Livestock & Products Annual Report (2013)
 
Dr Dev Kambhampati | USDA- BRAZIL- Semi Annual Livestock & Products Report (2...
Dr Dev Kambhampati | USDA- BRAZIL- Semi Annual Livestock & Products Report (2...Dr Dev Kambhampati | USDA- BRAZIL- Semi Annual Livestock & Products Report (2...
Dr Dev Kambhampati | USDA- BRAZIL- Semi Annual Livestock & Products Report (2...
 
Ldp m july 2012
Ldp m july 2012Ldp m july 2012
Ldp m july 2012
 
Relatório USDA - setembro de 2014
Relatório USDA - setembro de 2014Relatório USDA - setembro de 2014
Relatório USDA - setembro de 2014
 
23rd january,2014 daily exclusive rice e newsletter by riceplus magazine
23rd january,2014 daily exclusive rice e newsletter by riceplus magazine23rd january,2014 daily exclusive rice e newsletter by riceplus magazine
23rd january,2014 daily exclusive rice e newsletter by riceplus magazine
 
12th february,2014 daily exclusive oryza rice e newsletter by riceplus magazine
12th february,2014 daily exclusive oryza  rice e newsletter by riceplus magazine12th february,2014 daily exclusive oryza  rice e newsletter by riceplus magazine
12th february,2014 daily exclusive oryza rice e newsletter by riceplus magazine
 
Milking the Emerging Market Dairy Demand | Aranca Articles and Publications
Milking the Emerging Market Dairy Demand | Aranca Articles and PublicationsMilking the Emerging Market Dairy Demand | Aranca Articles and Publications
Milking the Emerging Market Dairy Demand | Aranca Articles and Publications
 
Analysis of new zealand milk supply situation
Analysis of new zealand milk supply situationAnalysis of new zealand milk supply situation
Analysis of new zealand milk supply situation
 
Milk scenario in 2015
Milk scenario in 2015Milk scenario in 2015
Milk scenario in 2015
 
Usda report march 2013
Usda report march 2013Usda report march 2013
Usda report march 2013
 
Usda report december 2012
Usda report december 2012Usda report december 2012
Usda report december 2012
 
USDA - Novembro 2014
USDA - Novembro 2014USDA - Novembro 2014
USDA - Novembro 2014
 
Ldp m junio 2012
Ldp m junio 2012Ldp m junio 2012
Ldp m junio 2012
 
30th january,2014 daily exclusive oryza rice e newsletter by riceplus magazine
30th january,2014 daily exclusive oryza rice e newsletter by riceplus magazine30th january,2014 daily exclusive oryza rice e newsletter by riceplus magazine
30th january,2014 daily exclusive oryza rice e newsletter by riceplus magazine
 
Dr Dev Kambhampati | USDA- World Agricultural Production (July 2014)
Dr Dev Kambhampati | USDA- World Agricultural Production (July 2014)Dr Dev Kambhampati | USDA- World Agricultural Production (July 2014)
Dr Dev Kambhampati | USDA- World Agricultural Production (July 2014)
 

Último

Separation of Lanthanides/ Lanthanides and Actinides
Separation of Lanthanides/ Lanthanides and ActinidesSeparation of Lanthanides/ Lanthanides and Actinides
Separation of Lanthanides/ Lanthanides and ActinidesFatimaKhan178732
 
Accessible design: Minimum effort, maximum impact
Accessible design: Minimum effort, maximum impactAccessible design: Minimum effort, maximum impact
Accessible design: Minimum effort, maximum impactdawncurless
 
SOCIAL AND HISTORICAL CONTEXT - LFTVD.pptx
SOCIAL AND HISTORICAL CONTEXT - LFTVD.pptxSOCIAL AND HISTORICAL CONTEXT - LFTVD.pptx
SOCIAL AND HISTORICAL CONTEXT - LFTVD.pptxiammrhaywood
 
18-04-UA_REPORT_MEDIALITERAСY_INDEX-DM_23-1-final-eng.pdf
18-04-UA_REPORT_MEDIALITERAСY_INDEX-DM_23-1-final-eng.pdf18-04-UA_REPORT_MEDIALITERAСY_INDEX-DM_23-1-final-eng.pdf
18-04-UA_REPORT_MEDIALITERAСY_INDEX-DM_23-1-final-eng.pdfssuser54595a
 
_Math 4-Q4 Week 5.pptx Steps in Collecting Data
_Math 4-Q4 Week 5.pptx Steps in Collecting Data_Math 4-Q4 Week 5.pptx Steps in Collecting Data
_Math 4-Q4 Week 5.pptx Steps in Collecting DataJhengPantaleon
 
Hybridoma Technology ( Production , Purification , and Application )
Hybridoma Technology  ( Production , Purification , and Application  ) Hybridoma Technology  ( Production , Purification , and Application  )
Hybridoma Technology ( Production , Purification , and Application ) Sakshi Ghasle
 
Paris 2024 Olympic Geographies - an activity
Paris 2024 Olympic Geographies - an activityParis 2024 Olympic Geographies - an activity
Paris 2024 Olympic Geographies - an activityGeoBlogs
 
Contemporary philippine arts from the regions_PPT_Module_12 [Autosaved] (1).pptx
Contemporary philippine arts from the regions_PPT_Module_12 [Autosaved] (1).pptxContemporary philippine arts from the regions_PPT_Module_12 [Autosaved] (1).pptx
Contemporary philippine arts from the regions_PPT_Module_12 [Autosaved] (1).pptxRoyAbrique
 
Sanyam Choudhary Chemistry practical.pdf
Sanyam Choudhary Chemistry practical.pdfSanyam Choudhary Chemistry practical.pdf
Sanyam Choudhary Chemistry practical.pdfsanyamsingh5019
 
Employee wellbeing at the workplace.pptx
Employee wellbeing at the workplace.pptxEmployee wellbeing at the workplace.pptx
Employee wellbeing at the workplace.pptxNirmalaLoungPoorunde1
 
Concept of Vouching. B.Com(Hons) /B.Compdf
Concept of Vouching. B.Com(Hons) /B.CompdfConcept of Vouching. B.Com(Hons) /B.Compdf
Concept of Vouching. B.Com(Hons) /B.CompdfUmakantAnnand
 
Presentation by Andreas Schleicher Tackling the School Absenteeism Crisis 30 ...
Presentation by Andreas Schleicher Tackling the School Absenteeism Crisis 30 ...Presentation by Andreas Schleicher Tackling the School Absenteeism Crisis 30 ...
Presentation by Andreas Schleicher Tackling the School Absenteeism Crisis 30 ...EduSkills OECD
 
Solving Puzzles Benefits Everyone (English).pptx
Solving Puzzles Benefits Everyone (English).pptxSolving Puzzles Benefits Everyone (English).pptx
Solving Puzzles Benefits Everyone (English).pptxOH TEIK BIN
 
Q4-W6-Restating Informational Text Grade 3
Q4-W6-Restating Informational Text Grade 3Q4-W6-Restating Informational Text Grade 3
Q4-W6-Restating Informational Text Grade 3JemimahLaneBuaron
 
The basics of sentences session 2pptx copy.pptx
The basics of sentences session 2pptx copy.pptxThe basics of sentences session 2pptx copy.pptx
The basics of sentences session 2pptx copy.pptxheathfieldcps1
 
APM Welcome, APM North West Network Conference, Synergies Across Sectors
APM Welcome, APM North West Network Conference, Synergies Across SectorsAPM Welcome, APM North West Network Conference, Synergies Across Sectors
APM Welcome, APM North West Network Conference, Synergies Across SectorsAssociation for Project Management
 
MENTAL STATUS EXAMINATION format.docx
MENTAL     STATUS EXAMINATION format.docxMENTAL     STATUS EXAMINATION format.docx
MENTAL STATUS EXAMINATION format.docxPoojaSen20
 
POINT- BIOCHEMISTRY SEM 2 ENZYMES UNIT 5.pptx
POINT- BIOCHEMISTRY SEM 2 ENZYMES UNIT 5.pptxPOINT- BIOCHEMISTRY SEM 2 ENZYMES UNIT 5.pptx
POINT- BIOCHEMISTRY SEM 2 ENZYMES UNIT 5.pptxSayali Powar
 
Measures of Central Tendency: Mean, Median and Mode
Measures of Central Tendency: Mean, Median and ModeMeasures of Central Tendency: Mean, Median and Mode
Measures of Central Tendency: Mean, Median and ModeThiyagu K
 

Último (20)

Separation of Lanthanides/ Lanthanides and Actinides
Separation of Lanthanides/ Lanthanides and ActinidesSeparation of Lanthanides/ Lanthanides and Actinides
Separation of Lanthanides/ Lanthanides and Actinides
 
Accessible design: Minimum effort, maximum impact
Accessible design: Minimum effort, maximum impactAccessible design: Minimum effort, maximum impact
Accessible design: Minimum effort, maximum impact
 
Staff of Color (SOC) Retention Efforts DDSD
Staff of Color (SOC) Retention Efforts DDSDStaff of Color (SOC) Retention Efforts DDSD
Staff of Color (SOC) Retention Efforts DDSD
 
SOCIAL AND HISTORICAL CONTEXT - LFTVD.pptx
SOCIAL AND HISTORICAL CONTEXT - LFTVD.pptxSOCIAL AND HISTORICAL CONTEXT - LFTVD.pptx
SOCIAL AND HISTORICAL CONTEXT - LFTVD.pptx
 
18-04-UA_REPORT_MEDIALITERAСY_INDEX-DM_23-1-final-eng.pdf
18-04-UA_REPORT_MEDIALITERAСY_INDEX-DM_23-1-final-eng.pdf18-04-UA_REPORT_MEDIALITERAСY_INDEX-DM_23-1-final-eng.pdf
18-04-UA_REPORT_MEDIALITERAСY_INDEX-DM_23-1-final-eng.pdf
 
_Math 4-Q4 Week 5.pptx Steps in Collecting Data
_Math 4-Q4 Week 5.pptx Steps in Collecting Data_Math 4-Q4 Week 5.pptx Steps in Collecting Data
_Math 4-Q4 Week 5.pptx Steps in Collecting Data
 
Hybridoma Technology ( Production , Purification , and Application )
Hybridoma Technology  ( Production , Purification , and Application  ) Hybridoma Technology  ( Production , Purification , and Application  )
Hybridoma Technology ( Production , Purification , and Application )
 
Paris 2024 Olympic Geographies - an activity
Paris 2024 Olympic Geographies - an activityParis 2024 Olympic Geographies - an activity
Paris 2024 Olympic Geographies - an activity
 
Contemporary philippine arts from the regions_PPT_Module_12 [Autosaved] (1).pptx
Contemporary philippine arts from the regions_PPT_Module_12 [Autosaved] (1).pptxContemporary philippine arts from the regions_PPT_Module_12 [Autosaved] (1).pptx
Contemporary philippine arts from the regions_PPT_Module_12 [Autosaved] (1).pptx
 
Sanyam Choudhary Chemistry practical.pdf
Sanyam Choudhary Chemistry practical.pdfSanyam Choudhary Chemistry practical.pdf
Sanyam Choudhary Chemistry practical.pdf
 
Employee wellbeing at the workplace.pptx
Employee wellbeing at the workplace.pptxEmployee wellbeing at the workplace.pptx
Employee wellbeing at the workplace.pptx
 
Concept of Vouching. B.Com(Hons) /B.Compdf
Concept of Vouching. B.Com(Hons) /B.CompdfConcept of Vouching. B.Com(Hons) /B.Compdf
Concept of Vouching. B.Com(Hons) /B.Compdf
 
Presentation by Andreas Schleicher Tackling the School Absenteeism Crisis 30 ...
Presentation by Andreas Schleicher Tackling the School Absenteeism Crisis 30 ...Presentation by Andreas Schleicher Tackling the School Absenteeism Crisis 30 ...
Presentation by Andreas Schleicher Tackling the School Absenteeism Crisis 30 ...
 
Solving Puzzles Benefits Everyone (English).pptx
Solving Puzzles Benefits Everyone (English).pptxSolving Puzzles Benefits Everyone (English).pptx
Solving Puzzles Benefits Everyone (English).pptx
 
Q4-W6-Restating Informational Text Grade 3
Q4-W6-Restating Informational Text Grade 3Q4-W6-Restating Informational Text Grade 3
Q4-W6-Restating Informational Text Grade 3
 
The basics of sentences session 2pptx copy.pptx
The basics of sentences session 2pptx copy.pptxThe basics of sentences session 2pptx copy.pptx
The basics of sentences session 2pptx copy.pptx
 
APM Welcome, APM North West Network Conference, Synergies Across Sectors
APM Welcome, APM North West Network Conference, Synergies Across SectorsAPM Welcome, APM North West Network Conference, Synergies Across Sectors
APM Welcome, APM North West Network Conference, Synergies Across Sectors
 
MENTAL STATUS EXAMINATION format.docx
MENTAL     STATUS EXAMINATION format.docxMENTAL     STATUS EXAMINATION format.docx
MENTAL STATUS EXAMINATION format.docx
 
POINT- BIOCHEMISTRY SEM 2 ENZYMES UNIT 5.pptx
POINT- BIOCHEMISTRY SEM 2 ENZYMES UNIT 5.pptxPOINT- BIOCHEMISTRY SEM 2 ENZYMES UNIT 5.pptx
POINT- BIOCHEMISTRY SEM 2 ENZYMES UNIT 5.pptx
 
Measures of Central Tendency: Mean, Median and Mode
Measures of Central Tendency: Mean, Median and ModeMeasures of Central Tendency: Mean, Median and Mode
Measures of Central Tendency: Mean, Median and Mode
 

International Dairy trade

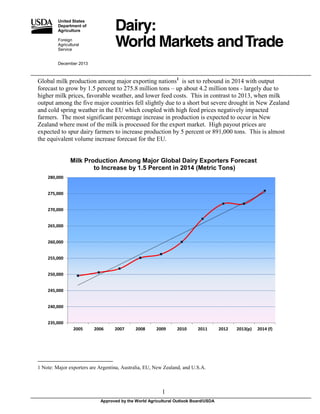
  • 1. United States Department of Agriculture Foreign Agricultural Service December 2013 Global milk production among major exporting nations1 is set to rebound in 2014 with output forecast to grow by 1.5 percent to 275.8 million tons – up about 4.2 million tons - largely due to higher milk prices, favorable weather, and lower feed costs. This in contrast to 2013, when milk output among the five major countries fell slightly due to a short but severe drought in New Zealand and cold spring weather in the EU which coupled with high feed prices negatively impacted farmers. The most significant percentage increase in production is expected to occur in New Zealand where most of the milk is processed for the export market. High payout prices are expected to spur dairy farmers to increase production by 5 percent or 891,000 tons. This is almost the equivalent volume increase forecast for the EU. Milk Production Among Major Global Dairy Exporters Forecast to Increase by 1.5 Percent in 2014 (Metric Tons) 280,000 275,000 270,000 265,000 260,000 255,000 250,000 245,000 240,000 235,000 2005 2006 2007 2008 2009 2010 2011 1 Note: Major exporters are Argentina, Australia, EU, New Zealand, and U.S.A. 1 Approved by the World Agricultural Outlook Board/USDA 2012 2013(p) 2014 (f)
  • 2. Dairy Production and Trade Developments Summary U.S. dairy exporters experienced an outstanding year and exceed all expectations with FY 2013 exports hitting a record $6.1 billion. This was partially due to reduced competition from such traditional suppliers as the EU and New Zealand, the growing competitiveness of U.S. dairy products and increased global demand for dairy products which continues to grow despite sharply higher prices. This demand has been particularly impressive since prices for such commodities as WMP have increased from about $3,300 per ton (Oceania FOB) in early January to approximately $5,000 per ton in late November. Although not as dramatic, this has been similarly true for skimmed milk powder (SMP) which over the same time span has increased from around $3,400 per ton to $4,600 per ton. It is interesting to note that although the volume forecast to be supplied by such suppliers as Australia and the EU in 2013 is expected to drop by 121,000 tons this is likely to be offset by increased supplies from New Zealand, India, and the United States which results in a net gain of 97,000 tons. Despite this significant additional volume, prices for SMP have remained extraordinarily resilient signaling that demand particularly from China and other Asian markets remains firm. SMP Exports by Major Suppliers (1,000 tons) Change in 2013 Change in 2014 forecast vs 2012 Forecast vs 2013 Australia -13 +10 EU -108 +60 India +83 -30 New Zealand +20 +10 United States +115 -20 Net Change +97 +30 For 2014, lower feed prices, favorable weather, and strength in global dairy prices are expected to provide a strong incentive for farmers to produce more milk and milk production among selected countries is set to grow by 2 percent. Despite the expectation of increased volumes, global dairy prices for the main dairy commodities have recently started to trend up signaling that import demand and more critically consumer demand appears to be unfazed by higher prices. The macroeconomic outlook supports this view as the income growth rate for Asia and Oceania in 2014 is expected to reach 4.2 percent and in the critical Chinese market, it is forecast at 7.7 percent – slightly higher than in 2013. In addition, dairy supply lines remain finely balanced as there are no Government surplus stocks of dairy commodities overhanging markets and given the high prices of 2013 commercial stocks are likely to be minimal. Consequently, buyers will likely be covering their needs well in advance and any potential interruptions due to adverse weather will undoubtedly ratchet prices up even further. 2 Foreign Agricultural Service/USDA Office of Global Analysis December 2013
  • 3. Milk Production: Forecast Summary Milk Production Summary for Major Exporters 2012 Argentina Australia EU-28 New Zealand United States Total  1,679 9,811 139,000 20,567 90,824 271,881 (1,000 Metric Tons) 2013 (p) 11,796 9,570 139,100 19,678 91,444 271,588 2014(f) Forecast % Change 12,209 9,880 140,000 20,569 93,123 275,781 4% 2% 1% 5% 2% 2% In 2013, dairy farmers in Argentina faced uneven weather conditions – dry conditions early in the year followed by a delayed spring – which negatively affected milk production mostly in the first half of the year. Production is expected to rebound in the second half of the year and milk output for 2013 is anticipated to be up 1 percent over 2012. For 2014, milk production in Argentina is forecast to expand by 4 percent over 2013 as a result of high international prices for WMP and increased domestic demand for cheese which are expected to improve producer margins. In addition, milk production is being concentrated in medium to large farms which are more efficient. To this extent, although the milk herd in 2014 is expected to remain about the same size as in 2013, milk production per cow is forecast to improve by 4 percent to 5.57 tons per cow. Source: Dairy Australia  For the current year, Australian milk production through October 2013 is down 6 percent 3 Foreign Agricultural Service/USDA Office of Global Analysis December 2013
  • 4. over the same period last year but ample rains during the winter and improved fodder availability is expected to boost milk output during the last quarter of the year. Nevertheless, milk production for 2013 the year is forecast to be down over 2012 by 2 percent. Australian milk production in 2014 is set to expand by 3 percent driven by an increase in the size of the herd and improved margins. At present, current domestic milk prices have improved significantly in comparison to last year due in large part to the strength of global dairy markets and a decline in the value of the Australian dollar.  In the EU, milk production in 2013 is forecast to grow marginally due to a significant lag in output during the first half of the year. During this period, farmers faced high production costs, severe winter conditions, and a delayed spring which resulted in milk production through June lagging by 2 percent in comparison to the same period last year. Milk output in the second half of the year is anticipated to rebound as favorable weather has led to a decline in feed prices, improved pastures and higher farm-gate milk prices which have considerably improved margins. For 2014, the long term contraction of the dairy herd is expected to an end and cow inventories are expected to stabilize at about the same level as in 2013. Milk production, however, is anticipated to grow by 1 percent due to improved milk per cow productivity. Most of the additional milk is expected to flow into the production of cheese. Over the longer term, the EU’s milk production quota is scheduled to be discontinued on April 1, 2015 and this is expected to further encourage farmers to expand dairy herds. Source: Eurostat  Although New Zealand milk production for 2013 through September is down 6 percent relative to the same period last year, milk output in August and September in comparison to the same months in 2012, was up 9 percent and 7 percent, respectively. This end-year boost in output as the main phase of seasonal production ramps up is forecast to increase 2013 production and limit the decline to 4 percent from 2012. For 2014, the outlook is bright as 4 Foreign Agricultural Service/USDA Office of Global Analysis December 2013
  • 5. farmers are expecting a significant increase in the 2013/14 milk price payout currently anticipated to be between NZ$ 7.60-8.60 per kilogram of milk solids. Consequently, milk production is forecast to grow by 5 percent as the herd is expected to expand by 68,000 cows and milk per cow output is forecast to increase by 3 percent. The near term climatic outlook is currently neutral between an El Niño and La Niña weather patterns which would likely lead to normal amounts of rainfall. Source: DCANZ  In the United States, milk production for 2014 is set to enter into a strong expansionary phase as low feed prices coupled with strong dairy product prices are expected to result in high milk feed ratios. Although the herd is forecast to grow by 30,000 head, the majority of the increase in output will be due to a 1 percent increase in milk per cow. Cheese:  In the United States, cheese production is set to grow by almost 2 percent in 2013 and is forecast to keep increasing in 2014 by less than 2 percent to reach 5.1 million MT. The U.S. trade sector has experienced a boom as cheese exports in 2013 through October are up 17 percent over 2012. As a result the 2013 July export forecast is revised up by 7 percent to reach a record 307,000 tons. Exports of fresh cheese have been notable for their explosive growth, rising from 17,000 tons in 2009 to 57,000 tons in 2012. In 2013, exports of fresh cheese through October have nearly reached 83,000 tons far surpassing the pace of 2012. Although fresh cheeses can include a broad range of fresh cheeses (cottage, cream, etc.) it is likely that the majority of cheese being shipped consists of mozzarella cheese. The principal destinations for these fresh cheeses in 2013 have so far been South Korea, Mexico, and China. For 2014, total U.S. cheese exports are forecast to decline slightly to 303,000 tons as increased competition from the EU and Oceania are expected to displace U.S. cheeses. U.S. domestic consumption is expected to remain fairly robust and grow by almost 2 percent; consequently, ending stocks in 2014 are anticipated to hit the lowest level since 2004. 5 Foreign Agricultural Service/USDA Office of Global Analysis December 2013
  • 6.  The EU’s domestic consumption of cheese continues to be the driving force behind the domestic dairy market accounting for nearly 70 percent of the milk supply (factory use milk) used for dairy production. For 2014, EU cheese production is forecast to expand by 1 percent as high global prices and increased availability of fluid milk is expected to stimulate output. As a result, 2014 cheese exports are forecast to grow by 3 percent to 825,000 tons. In 2013, about one third of total cheese exports through September were shipped to Russia and for 2014 Russia and the United States are likely to remain major markets.  Oceania cheese exports are forecast to decline in 2013 by 2 percent but then are expected to rebound in 2014 by 7 percent largely due to increased exports from New Zealand. In 2013, New Zealand cheese exports are forecast to drop by 8 percent largely due to the lower availability of milk supplies following a drought in the first half of the year. For 2014, increased supplies of milk, improved cheese margins, growing demand for ingredient cheese, and higher prices for whey by-products are expected to promote increased output. Consequently, production – of mostly cheddar - is forecast to grow by 2 percent to 320,000 tons and exports are anticipated to expand by 7 percent. SMP:  Chinese imports of SMP have been growing at an impressive clip averaging 32 percent growth over the 2009-2012 periods and China in 2013 will likely become the largest single import market for SMP. For 2014, Chinese production of SMP relative to 2013 is forecast to slip by 6 percent to 51,000 tons as demand for milk for other uses limits availability for SMP production. Domestic demand, however, remains robust driven by an increasingly affluent population and a continuing distrust of the quality of domestically sourced supplies; consequently, imports are forecast to grow by 16 percent to reach 250,000 tons in 2014.  Since the lifting of an export ban in June 2012, Indian exports of SMP in 2013 have accelerated and 6 Foreign Agricultural Service/USDA Office of Global Analysis December 2013
  • 7. shipments through September are up over six fold in comparison to the same period in the previous year. Consequently, exports in 2013 are expected to reach a record 120,000 tons. The principal destination for this SMP has been Bangladesh, Yemen, and Algeria. For 2014, although the production of SMP is expected to grow by 6 percent, exports are expected to decline but still remain at a relatively high volume of 90,000 tons.  Limited supplies of milk in the EU during 2013 are expected to lead to a 5 percent decline in the production of SMP which is forecast to result in a sharp 21 percent drop in SMP exports compared to 2012. For 2014, despite strong global prices, the processing of milk into cheese is likely to be financially more attractive than producing SMP and output is forecast to rebound by only 5 percent. Although EU SMP shipments are anticipated to rebound by 15 percent in 2014 they are expected to well below shipment levels reached in 2011 and 2012.  Mexican imports of SMP for 2013 through August are reported down 17 percent in comparison to the same period last year. Consequently, the July 2013 forecast has been revised down to 200,000 tons. For 2014, Mexican imports of SMP are expected to recover, increasing by 5 percent as domestic supplies are unable to meet the growing domestic market for dairy products.  In Oceania, total exports of SMP for 2013 are forecast to grow marginally by 1 percent over 2012 as the increase in New Zealand exports is likely to be offset by a decline in Australian shipments. For 2014, Oceania exports are forecast to increase by 4 percent or 20,000 tons of SMP. In the case of New Zealand, the vast majority of the increased milk supply will be directed to the production of WMP because of its relative profitability with respect to SMP/butter production.  U.S. exports of SMP have been booming and are forecast to reach a record 560,000 tons in 2013. U.S. exporters of SMP, based on shipment data through October 2013, appear to have made significant gains over the comparable period in 2012 to such key Asian markets as China, Philippines, Indonesia, and Vietnam and Malaysia. The gains in sales to China have been particularly notable as exports of SMP in 2013 through October are up over 254 percent over the same period in 2012. For 2014, exports are forecast to decline by 4 percent to 540,000 tons as increased competition from the EU and to a lesser extent New Zealand, are expected to displace U.S. sales. WMP:  Global WMP markets continue to be dominated by China’s seemingly insatiable demand for imports of WMP. For 2013, China’s imports of WMP are slated to increase by 32 percent over 2012 to reach 535,000 tons. Demand does not appear to be particularly price sensitive since Oceania FOB prices of WMP increased from about $3,340 per ton in January 2013 to over $6,000 per ton in April 2013 and has averaged approximately $4,670 per ton for most of the year. In fact, the average (Oceania FOB mid-point) price of WMP in 2013 through November is up 44 percent in comparison to the average mid-point price ($3,230 per ton) posted in 2012. China’s imports for 2014 are forecast to grow by 22 percent over 2013 to reach 650,000. This equates to an extra 115,000 tons of imported volume. Although domestic WMP production is expected to increase by 7 percent in 2014, strong demand for use of WMP in the production of processed products such as infant formula, yogurt, beverage drinks, etc., continues to outstrip domestic supply and drive import growth.  In New Zealand, WMP production remains the most profitable relative to other dairy products given current export prices. This situation is expected to persist in early 2014, and WMP production 7 Foreign Agricultural Service/USDA Office of Global Analysis December 2013
  • 8. for 2014 is expected to grow by 2 percent over 2013. In 2013, WMP production is likely to remain stagnant relative to 2012 due to early-year drought conditions. Consequently, exports are forecast to expand by only 1 percent over 2012. China has become New Zealand’s major customer for WMP and in 2012 China accounted for about one third of New Zealand’s total exports of WMP. For 2013, New Zealand’s exports to China through October accounted for about 43 percent of its total exports. For 2014, New Zealand’s exports of WMP are pegged at 1.35 million tons – an increase of 6 percent.  Although the 2013 WMP production forecast for the EU was revised up by 645,000 tons this still represents a decline of 2 percent from 2012. Cold weather and a delayed spring in the first half of 2013 reduced milk flows and available supplies were channeled primarily into the production of cheese. For 2014, increased milk availability is expected increase WMP output and exports are slated to increase by 1 percent or 5,000 tons over 2013 to reach 375,000 tons. Butter:  New Zealand remains the dominant exporter of butter accounting for about 65 percent of total trade among the major exporters. This share is not expected to change significantly in 2013 or 2014. Butter production in 2013 is forecast to drop by 4 percent from 2012 which is expected to lead a drop of 7 percent in exports. The situation is expected to reverse in 2014, with butter output pegged to grow by 4 percent relative to 2013. Similarly, exports are set to increase by 7 percent to 510,000 tons. Iran, Egypt, and Russia have in the past been the leading destinations for New Zealand butter, however, recently China has rapidly emerged to become a primary destination accounting for 10 percent of total New Zealand butter exports in 2012. For 2013, China remains a leading destination and will likely account for the same proportion of total New Zealand exports as in 2012.  The 2013 U.S. forecast for U.S. exports of butter has been revised from July to 91,000 tons - up almost double the 2012 level. Saudi Arabia is the leading destination accounting for about 22 percent of total butter exports for the year through October. For 2014, butter exports are expected to drop by 23 percent over 2013 as increased exportable supplies in the EU and New Zealand are expected to sharpen the competitive landscape for U.S. exporters. 8 Foreign Agricultural Service/USDA Office of Global Analysis December 2013
  • 9. International Prices Cheese Prices - Oceania FOB $/MT 5,500 5,000 4,500 4,000 3,500 3,000 2,500 Range Mid-point Butter Prices - Oceania FOB $/MT 5,500 5,000 4,500 4,000 3,500 3,000 2,500 Range Mid-Point 9 Foreign Agricultural Service/USDA Office of Global Analysis December 2013
  • 10. SMP Prices - Oceania FOB $/MT 7,000 6,500 6,000 5,500 5,000 4,500 4,000 3,500 3,000 2,500 Range Mid-Point WMP Prices - Oceania FOB $/MT 7,000 6,500 6,000 5,500 5,000 4,500 4,000 3,500 3,000 2,500 2,000 Range Mid-point Source: Agricultural Marketing Service, USDA 10 Foreign Agricultural Service/USDA Office of Global Analysis December 2013
  • 11. COWS MILK: SUMMARY FOR SELECTED COUNTRIES 1,000 Head Milk Cow Numbers 2009 2010 2011 2012 (p) 2013 (f) 2014 North America Canada Mexico United States Sub-total 979 981 983 960 961 955 6,400 6,480 6,400 6,350 6,300 6,300 9,203 9,119 9,194 9,233 9,220 9,250 16,582 16,580 16,577 16,543 16,481 16,505 South America Argentina 2,100 2,100 2,150 2,193 2,193 2,193 17,200 17,600 19,200 19,900 20,450 20,859 Sub-total 19,300 19,700 21,350 22,093 22,643 23,052 European Union - 28 24,192 23,566 23,122 23,051 23,052 23,050 8,450 Brazil Former Soviet Union Russia 9,530 8,858 8,650 8,600 8,515 Ukraine 2,856 2,736 2,631 2,582 2,554 2,540 Sub-total 12,386 11,594 11,281 11,182 11,069 10,990 42,600 43,600 44,900 46,400 48,250 50,100 China 7,115 7,320 7,620 8,000 8,380 8,900 Japan 848 830 805 813 798 800 7,963 8,150 8,425 8,813 9,178 9,700 Australia 1,676 1,596 1,620 1,650 1,650 1,660 New Zealand 4,597 4,680 4,816 5,018 5,043 5,111 6,273 6,276 6,436 6,668 6,693 6,771 129,296 129,466 132,091 134,750 137,366 140,168 GCAD/OGA/FAS Dec 2013 South Asia India Asia Sub-total Oceania Sub-total TOTAL SELECTED COUNTRIES Source: FAS post reports, official statistics, and office research. Notes: (p)Preliminary (f) Forecast. Foreign Agricultural Service/USDA Office of Global Analysis December 2013
  • 12. COWS MILK: SUMMARY FOR SELECTED COUNTRIES 1,000 Metric Tons Fluid Milk Production 2009 2010 2011 2012 (p) 2013 (f) 2014 8,280 8,350 8,400 8,614 8,535 8,450 11,350 North America Canada Mexico 10,866 11,033 11,046 11,274 11,270 United States 85,880 87,474 88,978 90,824 91,444 93,123 105,026 106,857 108,424 110,712 111,249 112,923 Sub-total South America Argentina 10,350 10,600 11,470 11,679 11,796 12,209 Brazil 28,795 29,948 30,715 31,490 32,380 33,375 39,145 40,548 42,185 43,169 44,176 45,584 133,700 135,472 138,220 139,000 139,100 140,000 Sub-total European Union - 28 1/ Former Soviet Union Russia 32,600 31,847 31,646 31,917 31,400 31,400 Ukraine 11,370 10,977 10,804 11,080 11,160 11,220 Sub-total 43,970 42,824 42,450 42,997 42,560 42,620 48,160 50,300 53,500 55,500 57,500 60,125 China 28,445 29,300 30,700 32,600 34,500 37,000 Japan 7,910 7,721 7,474 7,631 7,560 7,580 Sub-total 36,355 37,021 38,174 40,231 42,060 44,580 9,326 9,327 9,568 9,811 9,570 9,880 South Asia India Asia Oceania Australia New Zealand TOTAL SELECTED COUNTRIES 16,983 17,173 18,965 20,567 19,678 20,569 26,309 26,500 28,533 30,378 29,248 30,449 432,665 439,522 451,486 461,987 465,893 476,281 GCAD/OGA/FAS Sub-total Dec 2013 Source: FAS post reports, official statistics, and office research. Notes: (p) Preliminary. (f) Forecast. (1) Based on deliveries Foreign Agricultural Service/USDA Office of Global Analysis December 2013
  • 13. COWS MILK : SUMMARY FOR SELECTED COUNTRIES MT/Head Fluid Milk Production Per Cow 2009 2010 2011 2012 (p) 2013 (f) 2014 Canada 8.46 8.51 8.55 8.97 8.88 8.85 Mexico 1.70 1.70 1.73 1.78 1.79 1.80 United States 9.33 9.59 9.68 9.84 9.92 n.a. Argentina 4.93 5.05 5.33 5.33 5.38 5.57 Brazil 1.67 1.70 1.60 1.58 1.58 1.60 5.53 5.75 5.98 6.03 6.03 6.07 Russia 3.42 3.60 3.66 3.71 3.69 3.72 Ukraine 3.98 4.01 4.11 4.29 4.37 4.42 1.13 1.15 1.19 1.20 1.19 1.20 China 4.00 4.00 4.03 4.08 4.12 4.16 Japan 9.33 9.30 9.28 9.39 9.47 9.48 Australia 5.56 5.84 5.91 5.95 5.80 5.95 New Zealand 3.69 3.67 3.94 4.10 3.90 4.02 GCAD/OGA/FAS Dec 2013 North America South America European Union - 28 1/ Former Soviet Union South Asia India Asia Oceania Source: FAS post reports, official statistics, and office research. Notes: (p) Preliminary. (f) Forecast. (1) Based on deliveries Foreign Agricultural Service/USDA Office of Global Analysis December 2013
  • 14. COWS MILK: SUMMARY FOR SELECTED COUNTRIES 1,000 Metric Tons Fluid Milk Consumption 2009 2010 2011 2012 (p) 2013 (f) 2014 3,103 3,184 3,164 3,040 3,014 3,000 North America Canada Mexico United States Sub-total 5,206 5,167 4,100 4,168 4,171 4,209 28,550 28,896 28,281 28,769 28,884 29,121 36,859 37,247 35,545 35,977 36,069 36,330 South America Argentina 2,100 2,130 2,093 2,133 2,155 2,200 10,895 11,278 11,429 11,712 12,000 12,415 Sub-total 12,995 13,408 13,522 13,845 14,155 14,615 European Union - 28 33,700 33,738 33,870 33,800 33,500 33,400 Russia 12,114 11,775 11,650 11,040 10,615 10,640 Ukraine 3,483 5,342 5,442 5,588 5,667 5,692 Sub-total 15,597 17,117 17,092 16,628 16,282 16,332 48,160 49,140 51,660 52,000 54,400 57,460 China 11,791 12,060 12,600 13,517 14,350 15,460 Japan 4,264 4,150 4,058 4,045 3,950 3,950 Sub-total 16,055 16,210 16,658 17,562 18,300 19,410 2,272 2,284 2,422 2,511 2,525 2,550 Brazil Former Soviet Union South Asia India Asia Oceania Australia 2/ New Zealand TOTAL SELECTED COUNTRIES 300 300 300 275 300 300 2,572 2,584 2,722 2,786 2,825 2,850 165,938 169,444 171,069 172,598 175,531 180,397 GCAD/OGA/FAS Sub-total Dec 2013 Source: FAS post reports, official statistics, and office research. Notes: (p) Preliminary. (f) Forecast. Foreign Agricultural Service/USDA Office of Global Analysis December 2013
  • 15. CHEESE PRODUCTION: SUMMARY FOR SELECTED COUNTRIES 1,000 Metric Tons 2009 2010 2011 2012 (p) 2013 (f) 2014 North America Canada 1/ 291 297 300 549 550 545 Mexico 242 264 270 264 270 270 4,570 4,737 4,806 4,940 5,035 5,115 5,103 5,298 5,376 5,753 5,855 5,930 United States Sub-total South America Argentina 530 540 572 564 570 589 Brazil 614 648 679 700 722 736 Sub-total 1,144 1,188 1,251 1,264 1,292 1,325 European Union - 28 8,739 8,959 8,981 9,142 9,175 9,250 Former Soviet Union Russia 400 438 425 446 420 425 Ukraine 228 212 185 145 147 150 Sub-total 628 650 610 591 567 575 Asia Japan 45 48 45 47 47 48 Korea 23 27 25 23 27 27 Philippines Sub-total 2 2 2 2 2 2 70 79 86 82 84 77 321 319 339 330 329 360 Oceania Australia New Zealand TOTAL SELECTED COUNTRIES 308 268 300 321 314 320 629 587 639 651 643 680 16,313 16,761 16,943 17,483 17,616 17,837 GCAD/OGA/FAS Sub-total Dec 2013 Source: FAS post reports, official statistics, and office research. Notes: (p) Preliminary. (f) Forecast. 1/ Includes fresh cheese 2012 onwards Foreign Agricultural Service/USDA Office of Global Analysis December 2013
  • 16. CHEESE CONSUMPTION: SUMMARY FOR SELECTED COUNTRIES 1,000 Metric Tons 2009 2010 2011 2012 (p) 2013 (f) 2014 318 318 313 537 560 565 North America Canada 1/ Mexico United States Sub-total 311 338 344 349 366 366 4,540 4,638 4,716 4,788 4,851 4,939 5,169 5,294 5,373 5,674 5,777 5,870 South America Argentina 495 490 514 513 518 528 Brazil 624 666 715 724 751 762 Sub-total 1,119 1,156 1,229 1,237 1,269 1,290 European Union - 28 8,245 8,367 8,374 8,444 8,450 8,500 Former Soviet Union Russia 690 780 759 792 789 798 Ukraine 160 144 117 95 105 113 Sub-total 850 924 876 887 894 911 295 Asia Japan 229 247 260 282 290 Korea 72 88 101 101 112 113 Sub-total 301 335 361 383 402 408 220 225 256 240 232 248 24 24 30 32 34 35 244 249 286 272 266 283 15,928 16,325 16,499 16,897 17,058 17,262 GCAD/OGA/FAS Dec 2013 Oceania Australia New Zealand Sub-total TOTAL SELECTED COUNTRIES Source: FAS post reports, official statistics, and office research. Notes: (p) Preliminary. (f) Forecast. 1/ Includes fresh cheese from 2012 onwards Foreign Agricultural Service/USDA Office of Global Analysis December 2013
  • 17. CHEESE IMPORTS: SUMMARY FOR SELECTED COUNTRIES 1,000 Metric Tons 2009 2010 2011 2012 (p) 2013 (f) 2014 North America Canada 1/ 24 25 25 25 25 25 Mexico 73 80 78 89 100 100 United States Sub-total 131 110 110 122 115 109 228 215 213 236 240 234 South America Argentina 3 3 3 3 3 2 16 22 39 27 31 29 Sub-total 19 25 42 30 34 31 European Union - 28 84 84 75 78 75 75 310 353 344 356 375 385 9 11 12 17 18 23 319 364 356 373 393 408 184 199 215 235 243 247 Brazil Former Soviet Union Russia Ukraine Sub-total Asia Japan Korea 49 61 76 78 85 86 Philippines 15 15 17 20 17 18 248 275 308 333 345 351 65 76 72 76 76 76 6 6 5 5 5 5 71 82 77 81 81 81 969 1,045 1,071 1,131 1,168 1,180 GCAD/OGA/FAS Dec 2013 Sub-total Oceania Australia New Zealand Sub-total TOTAL SELECTED COUNTRIES Source: FAS post reports, official statistics, and office research. Notes: (p) Preliminary. (f) Forecast. 1/ Includes fresh cheese from 2012 onwards Foreign Agricultural Service/USDA Office of Global Analysis December 2013
  • 18. CHEESE EXPORTS: SUMMARY FOR SELECTED COUNTRIES 1,000 Metric Tons 2009 2010 2011 2012 (p) 2013 (f) 2014 Canada 1/ 9 9 9 10 10 9 Mexico 4 6 4 4 4 4 108 173 225 260 307 303 121 188 238 274 321 316 48 45 60 54 55 60 6 4 3 3 2 3 63 53 43 54 49 53 578 676 682 776 800 825 21 11 9 10 10 10 North America United States Sub-total South America Argentina Brazil Sub-total European Union - 28 Former Soviet Union Russia Ukraine 77 79 80 67 60 60 Sub-total 98 90 89 77 70 70 Oceania Australia 162 160 168 163 180 190 New Zealand 290 265 253 306 280 300 452 425 421 469 460 490 1,312 1,432 1,473 1,650 1,700 1,754 GCAD/OGA/FAS Dec 2013 Sub-total TOTAL SELECTED COUNTRIES Source: FAS post reports, official statistics, and office research. Notes: (p) Preliminary. (f) Forecast. 1/ Includes fresh cheese from 2012 onwards Foreign Agricultural Service/USDA Office of Global Analysis December 2013
  • 19. BUTTER PRODUCTION: SUMMARY FOR SELECTED COUNTRIES 1/ 1,000 Metric Tons 2009 2010 2011 2012 (p) 2013 (f) 2014 North America Canada 86 80 85 98 92 88 Mexico 171 182 187 190 185 185 United States Sub-total 713 709 821 843 852 865 970 971 1,093 1,131 1,129 1,138 South America Argentina 51 55 63 58 60 62 Brazil 76 78 79 81 83 85 127 133 142 139 143 147 2,030 1,980 2,055 2,100 2,090 2,100 200 Sub-total European Union - 28 Former Soviet Union Russia 246 207 217 216 205 Ukraine 75 79 76 88 90 92 Sub-total 321 286 293 304 295 292 3,910 4,162 4,330 4,525 4,745 4,887 81 74 63 69 71 73 3,991 4,236 4,393 4,594 4,816 4,960 Asia India Japan Sub-total Oceania Australia 118 132 121 119 117 122 New Zealand 482 441 487 527 506 525 519 519 519 519 519 519 7,958 8,125 8,495 8,787 8,992 9,156 GCAD/OGA/FAS Dec 2013 Sub-total TOTAL SELECTED COUNTRIES Source: FAS post reports, official statistics, and office research. Notes: (p) Preliminary. (f) Forecast. (1) Includes Butteroil/AMF butter equivalent. Foreign Agricultural Service/USDA Office of Global Analysis December 2013
  • 20. BUTTER CONSUMPTION: SUMMARY FOR SELECTED COUNTRIES 1/ 1,000 Metric Tons 2009 2010 2011 2012 (p) 2013 (f) 2014 North America Canada 96 90 96 97 95 95 Mexico 224 231 222 226 238 238 United States Sub-total 694 683 757 793 780 809 1,014 1,004 1,075 1,116 1,113 1,142 South America Argentina 34 37 35 38 40 40 Brazil 81 75 78 80 82 84 115 112 113 118 122 124 1,894 1,934 1,982 2,031 2,033 2,035 348 Sub-total European Union - 28 Former Soviet Union Russia 349 319 330 335 348 Ukraine 90 84 78 96 101 105 Sub-total 439 403 408 431 449 453 3,910 4,170 4,320 4,525 4,736 4,876 74 86 83 77 72 74 Asia India Japan Taiwan Sub-total 14 16 18 18 19 19 3,998 4,272 4,421 4,620 4,827 4,969 Oceania Australia 60 73 78 82 85 86 New Zealand 20 20 20 21 22 22 80 93 98 103 107 108 7,540 7,818 8,097 8,419 8,651 8,831 GCAD/OGA/FAS Dec 2013 Sub-total TOTAL SELECTED COUNTRIES Source: FAS post reports, official statistics, and office research. Notes: (p) Preliminary. (f) Forecast. (1) Includes Butteroil/AMF butter equivalent. Foreign Agricultural Service/USDA Office of Global Analysis December 2013
  • 21. BUTTER IMPORTS: SUMMARY FOR SELECTED COUNTRIES 1/ 1,000 Metric Tons 2009 2010 2011 2012 (p) 2013 (f) 2014 North America Canada 12 8 10 7 7 8 Mexico 53 49 35 37 55 55 United States Sub-total 17 10 12 18 13 15 82 67 57 62 75 78 7 2 0 1 1 1 84 93 66 63 65 65 150 South America Brazil European Union - 28 Former Soviet Union Russia 107 113 116 119 145 Ukraine 16 6 4 8 12 14 Sub-total 123 119 120 127 157 164 India 28 25 0 8 0 0 Japan 0 3 15 10 1 4 Asia Taiwan 14 16 18 18 19 19 Sub-total 42 44 33 36 20 23 18 19 19 21 23 25 1 1 1 0 1 1 19 20 20 21 24 26 357 345 296 310 342 357 GCAD/OGA/FAS Dec 2013 Oceania Australia New Zealand Sub-total TOTAL SELECTED COUNTRIES Source: FAS post reports, official statistics, and office research. Notes: (p) Preliminary. (f) Forecast. (1) Includes Butteroil/AMF butter equivalent. Foreign Agricultural Service/USDA Office of Global Analysis December 2013
  • 22. BUTTER EXPORTS: SUMMARY FOR SELECTED COUNTRIES 1/ 1,000 Metric Tons 2009 2010 2011 2012 (p) 2013 (f) 2014 Canada 3 1 0 0 5 3 Mexico 0 0 0 1 2 2 North America United States Sub-total 30 59 65 47 91 70 33 60 65 48 98 75 17 15 27 21 20 22 2 5 1 2 2 2 19 20 28 23 22 24 149 154 124 120 120 120 1 1 2 0 1 1 28 11 11 8 9 9 5 10 15 28 4 10 South America Argentina Brazil Sub-total European Union - 28 Former Soviet Union Ukraine Asia India Sub-total Oceania Australia 87 58 42 54 55 62 492 429 449 509 475 510 Sub-total 579 487 491 563 530 572 TOTAL SELECTED COUNTRIES 786 732 725 782 775 802 GCAD/OGA/FAS Dec 2013 New Zealand Source: FAS post reports, official statistics, and office research. Notes: (p) Preliminary. (f) Forecast. (1) Includes Butteroil/AMF butter equivalent. Foreign Agricultural Service/USDA Office of Global Analysis December 2013
  • 23. SKIMMED MILK POWDER PRODUCTION: SUMMARY FOR SELECTED COUNTRIES 1,000 Metric Tons 2009 2010 2011 2012 (p) 2013 (f) 2014 North America Canada 83 72 76 85 78 76 Mexico 25 13 26 55 55 55 United States 1/ Sub-total 786 824 882 973 979 1,015 894 909 984 1,113 1,112 1,146 33 35 39 32 32 33 South America Argentina Brazil Sub-total European Union - 28 125 130 132 141 151 154 158 165 171 173 183 187 1,080 1,060 1,180 1,270 1,210 1,270 70 42 55 57 50 50 Former Soviet Union Russia Ukraine 51 53 43 52 52 52 Sub-total 121 95 98 109 102 102 Asia China 54 55 56 57 54 51 India 360 380 430 450 480 510 145 Japan 167 156 137 139 142 Korea 15 10 4 14 12 12 Sub-total 596 601 627 660 688 718 Australia 203 205 230 235 225 235 New Zealand 385 344 366 404 390 420 588 549 596 639 615 655 3,437 3,379 3,656 3,964 3,910 4,078 GCAD/OGA/FAS Dec 2013 Oceania Sub-total TOTAL SELECTED COUNTRIES Source: FAS post reports, official statistics, and office research. Notes: (p) Preliminary. (f) Forecast. (1) Includes NDM and SMP production. Foreign Agricultural Service/USDA Office of Global Analysis December 2013
  • 24. SKIMMED MILK POWDER CONSUMPTION: SUMMARY FOR SELECTED COUNTRIES 1,000 Metric Tons 2009 2010 2011 2012 (p) 2013 (f) 2014 North America Canada 84 72 72 69 70 70 Mexico 190 168 220 291 255 265 United States 1/ Sub-total 568 434 438 522 433 460 842 674 730 882 758 795 South America Argentina 17 18 19 18 18 18 135 144 163 174 179 180 Sub-total 152 162 182 192 197 198 European Union - 28 596 749 807 799 800 800 190 Brazil Former Soviet Union Russia 175 159 126 153 180 Ukraine 32 41 23 29 37 35 Sub-total 207 200 149 182 217 225 Asia China 124 144 186 225 268 300 India 355 390 410 425 400 416 Indonesia 172 184 197 205 222 231 Japan 152 162 157 146 147 150 Korea 25 21 38 27 30 31 Philippines 89 97 92 96 100 105 917 998 1,080 1,124 1,167 1,233 50 56 68 76 80 80 1 3 3 3 4 4 51 59 71 79 84 84 2,765 2,842 3,019 3,258 3,223 3,335 GCAD/OGA/FAS Dec 2013 Sub-total Oceania Australia New Zealand Sub-total TOTAL SELECTED COUNTRIES Source: FAS post reports, official statistics, and office research. Notes: (p) Preliminary. (f) Forecast. (1) Includes NDM and SMP. Foreign Agricultural Service/USDA Office of Global Analysis December 2013
  • 25. SKIMMED MILK POWDER IMPORTS: SUMMARY FOR SELECTED COUNTRIES 1,000 Metric Tons 2009 2010 2011 2012 (p) 2013 (f) 2014 North America Canada Mexico 3 3 3 3 3 2 165 155 194 236 200 210 United States 1/ Sub-total 0 0 0 2 1 1 168 158 197 241 204 213 South America Argentina 0 0 0 0 0 0 11 14 31 33 28 26 11 14 31 33 28 26 6 4 0 2 5 5 105 117 71 96 130 140 8 2 2 3 1 3 113 119 73 99 131 143 93 98 129 112 125 115 China 70 89 130 168 215 250 India 3 20 32 14 0 0 178 189 196 205 225 230 Japan 34 30 27 32 33 32 Korea 10 8 34 19 18 18 112 110 111 106 110 115 407 446 530 544 601 645 Australia 4 5 5 3 5 5 New Zealand 4 3 2 5 3 3 8 8 7 8 8 8 806 847 967 1,039 1,102 1,155 GCAD/OGA/FAS Dec 2013 Brazil Sub-total European Union - 28 Former Soviet Union Russia Ukraine Sub-total North Africa Algeria Asia Indonesia Philippines Sub-total Oceania Sub-total TOTAL SELECTED COUNTRIES Source: FAS post reports, official statistics, and office research. Notes: (p) Preliminary. (f) Forecast. (1) Includes NDM and SMP. Foreign Agricultural Service/USDA Office of Global Analysis December 2013
  • 26. SKIMMED MILK POWDER EXPORTS: SUMMARY FOR SELECTED COUNTRIES 1,000 Metric Tons 2009 2010 2011 2012 (p) 2013 (f) 2014 10 North America Canada 10 6 10 10 11 Mexico 0 0 0 0 0 0 248 384 435 445 560 540 258 390 445 455 571 550 13 20 18 14 16 15 United States 1/ Sub-total South America Argentina Brazil Sub-total European Union - 28 1 0 0 0 0 0 14 20 18 14 16 15 231 379 518 523 415 475 0 0 0 0 0 0 Former Soviet Union Russia Ukraine 27 14 22 26 16 20 Sub-total 27 14 22 26 16 20 Asia China 0 0 0 0 1 1 India 15 18 3 37 120 90 Indonesia 5 1 1 1 1 1 Philippines 15 15 17 12 6 8 35 34 21 50 128 100 Australia 167 132 140 168 155 165 New Zealand 408 343 362 390 410 420 575 475 502 558 565 585 1,140 1,312 1,526 1,626 1,711 1,745 GCAD/OGA/FAS Dec 2013 Sub-total Oceania Sub-total TOTAL SELECTED COUNTRIES Source: FAS post reports, official statistics, and office research. Notes: (p) Preliminary. (f) Forecast. (1) Includes NDM and SMP. Foreign Agricultural Service/USDA Office of Global Analysis December 2013
  • 27. WHOLE MILK POWDER PRODUCTION: SUMMARY FOR SELECTED COUNTRIES 1,000 Metric Tons 2009 2010 2011 2012 (p) 2013 (f) 2014 North America United States Sub-total 27 32 30 26 34 35 27 32 30 26 34 35 South America Argentina 210 210 309 281 284 294 Brazil 473 500 515 531 549 560 55 63 73 74 75 75 Sub-total Chile 738 773 897 886 908 929 European Union - 28 790 780 685 660 645 650 Former Soviet Union Russia 50 40 76 67 60 60 Ukraine 16 15 10 11 11 11 Sub-total 66 55 86 78 71 71 977 1,030 1,100 1,160 1,220 1,300 56 62 66 70 71 72 Asia China Indonesia Taiwan Sub-total 0 0 0 0 0 0 1,033 1,092 1,166 1,230 1,291 1,372 Oceania Australia 137 147 148 120 120 130 New Zealand 768 947 1,162 1,273 1,275 1,300 905 1,094 1,310 1,393 1,395 1,430 3,559 3,826 4,174 4,273 4,344 4,487 GCAD/OGA/FAS Dec 2013 Sub-total TOTAL SELECTED COUNTRIES Source: FAS post reports, official statistics, and office research. Notes: (p) Preliminary. (f) Forecast. Foreign Agricultural Service/USDA Office of Global Analysis December 2013
  • 28. WHOLE MILK POWDER CONSUMPTION: SUMMARY FOR SELECTED COUNTRIES 1,000 Metric Tons 2009 2010 2011 2012 (p) 2013 (f) 2014 North America United States Sub-total 35 29 30 25 28 29 35 29 30 25 28 29 South America Argentina 54 75 89 90 91 92 517 533 569 601 606 618 Sub-total 571 608 658 691 697 710 European Union - 28 333 337 299 277 279 277 Russia 71 79 94 93 103 108 Ukraine 12 9 9 11 12 13 Sub-total 83 88 103 104 115 121 172 182 185 185 165 170 1,064 1,373 1,433 1,540 1,777 1,975 106 112 118 126 120 127 9 10 6 13 24 26 28 26 32 31 30 30 1,207 1,521 1,589 1,710 1,951 2,158 28 45 40 40 36 40 1 1 2 2 2 2 29 28 28 29 30 31 2,430 2,793 2,892 3,021 3,265 3,496 GCAD/OGA/FAS Dec 2013 Brazil Former Soviet Union North Africa Algeria Asia China Indonesia Philippines Taiwan Sub-total Oceania Australia New Zealand Sub-total TOTAL SELECTED COUNTRIES Source: FAS post reports, official statistics, and office research. Notes: (p) Preliminary. (f) Forecast. Foreign Agricultural Service/USDA Office of Global Analysis December 2013
  • 29. WHOLE MILK POWDER IMPORTS: SUMMARY FOR SELECTED COUNTRIES 1,000 Metric Tons 2009 2010 2011 2012 (p) 2013 (f) 2014 18 7 8 10 8 6 18 7 8 10 8 6 North America United States Sub-total South America Argentina Brazil Sub-total 1 0 0 0 0 0 57 38 55 71 57 58 58 38 55 71 57 58 1 2 2 3 4 2 50 European Union - 28 Former Soviet Union Russia 30 41 20 28 45 Ukraine 1 0 1 1 1 2 Sub-total 31 41 21 29 46 52 200 167 204 188 135 170 650 North Africa Algeria Asia 177 326 320 406 535 Indonesia China 50 50 52 56 50 55 Philippines 36 40 30 35 32 36 Taiwan 28 26 32 31 30 30 Sub-total 291 442 434 528 647 771 15 15 13 9 12 10 1 2 1 1 1 1 16 17 14 10 13 11 615 714 738 839 910 1,070 GCAD/OGA/FAS Dec 2013 Oceania Australia New Zealand Sub-total TOTAL SELECTED COUNTRIES Source: FAS post reports, official statistics, and office research. Notes: (p) Preliminary. (f) Forecast. Foreign Agricultural Service/USDA Office of Global Analysis December 2013
  • 30. WHOLE MILK POWDER EXPORTS: SUMMARY FOR SELECTED COUNTRIES 1,000 Metric Tons 2009 2010 2011 2012 (p) 2013 (f) 2014 9 10 8 11 12 12 9 10 8 11 12 12 211 North America United States Sub-total South America 157 128 201 201 190 Brazil Argentina 13 5 1 1 0 0 Chile 14 9 14 15 12 13 Sub-total 184 142 216 217 202 224 European Union - 28 458 445 388 386 370 375 Former Soviet Union Russia 9 2 2 2 2 2 Ukraine 5 6 2 1 0 0 Sub-total 14 8 4 3 2 2 Asia China 10 3 9 9 5 5 Philippines 27 30 24 22 8 10 37 33 33 31 13 15 Australia 133 115 116 109 90 100 New Zealand 818 949 1,110 1,261 1,275 1,350 951 1,064 1,226 1,370 1,365 1,450 1,653 1,702 1,875 2,018 1,964 2,078 GCAD/OGA/FAS Dec 2013 Sub-total Oceania Sub-total TOTAL SELECTED COUNTRIES Source: FAS post reports, official statistics, and office research. Notes: (p) Preliminary. (f) Forecast. Foreign Agricultural Service/USDA Office of Global Analysis December 2013