Unemployment Charts
•
1 recomendación•4,034 vistas

Ten charts covering the UK labour market and aspects of unemployment in the British economy

Recomendados
Recomendados
Más contenido relacionado
Destacado
Destacado (18)
Similar a Unemployment Charts
Similar a Unemployment Charts (20)
Más de tutor2u
Más de tutor2u (20)
Último
Último (20)
Unemployment Charts
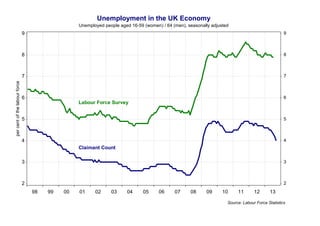
- 1. Unemployment in the UK Economy Unemployed people aged 16-59 (women) / 64 (men), seasonally adjusted 9 8 8 7 per cent of the labour force 9 7 6 6 Labour Force Survey 5 5 4 4 Claimant Count 3 3 2 2 98 99 00 01 02 03 04 05 06 07 08 09 10 11 12 13 Source: Labour Force Statistics
- 2. UK Unemployment and Consumer Price Inflation Annual percentage change in consumer prices, unemployment rate (%) 10 9 9 8 8 7 7 6 6 5 Percent 10 5 4 4 Unemployment 3 2 3 Inflation 2 1 1 0 0 -1 -1 -2 -2 89 90 91 92 93 94 95 96 97 98 99 00 01 02 03 04 05 06 07 08 09 10 11 12 13 Source: Reuters EcoWin
- 3. Regional Unemployment Rates in the UK A selection of regional unemployment rates, per cent of the labour force, LFS measure 12 11 11 10 10 9 9 8 8 7 7 6 6 5 5 4 4 3 3 GBP 12 Jan May Sep Jan May Sep Jan May Sep 07 08 09 London Northern Ireland North East Scotland Jan May Sep Jan May Sep 10 11 South East Yorks and Humber Jan May Sep 12 Jan May 13 Source: UK Labour Market Statistics
- 4. UK Unemployment, By Duration 1.6 1.6 1.4 1.4 1.2 1.2 Unemployed for up to six months 1.0 1.0 0.8 0.8 0.6 0.6 millions Persons (millions) Millions, seasonally adjusted, using Labour Force Survey data Unemployed for over 12 months 0.4 0.4 0.2 0.2 Unemployed for over 24 months 0.0 0.0 03 04 05 06 07 08 09 10 11 12 13 Source: Reuters EcoWin
- 5. Annual Change in Weekly Regular Pay and CPI Inflation 6.0 6.0 Percent Percent Annual growth of regular weekly pay, consumer price inflation (%) Consumer Price Inflation (%) 5.0 5.0 4.0 4.0 3.0 3.0 2.0 2.0 1.0 Regular Weekly Pay (% annual change) 1.0 0.0 0.0 Jan May Sep Jan May Sep Jan May Sep Jan May Sep Jan May Sep Jan May Sep Jan May 07 08 09 10 11 12 13 Average Weekly Pay, 3 month average, seasonally adjusted Consumer Price Index (All Items) Source: Office of National Statistics
- 6. Unemployment Expectations Net % balance of people expecting higher unemployment in the next year 80 70 70 60 60 50 Net balance 80 50 40 40 30 30 20 20 10 10 0 0 00 01 02 03 04 05 06 07 08 09 10 11 12 13 Source: Reuters EcoWin
- 7. Unfilled Vacancies in the UK Labour Market Three month average, seasonally adjusted 700000 650000 650000 600000 Number of 700000 600000 550000 550000 500000 500000 450000 450000 400000 400000 05 06 07 08 09 10 11 12 13 Source: Reuters EcoWin
- 8. Long Term Unemployment for people Aged 18-24 Thousands, people out of work for at least a year 275000 275000 250000 250000 225000 225000 200000 200000 175000 175000 150000 150000 125000 125000 100000 100000 75000 75000 50000 50000 25000 25000 93 94 95 96 97 98 99 00 01 02 03 04 05 06 07 08 09 10 11 12 13 Source: Reuters EcoWin
- 9. Unemployment Rates for some OECD Countries Percent of the labour force Unemployment rate - per cent of the labour force (annual) 30 30 25 25 20 20 15 15 10 10 5 5 0 0 00 01 02 Greece Ireland Italy 03 04 05 06 07 Spain Germany United Kingdom 08 09 10 11 12 13 14 South Korea United States Source: OECD World Economic Outlook
- 10. Real GDP Growth and UK Unemployment 10.0 8.0 10.0 8.0 Unemployment (% of the labour force) RHS 6.0 6.0 4.0 4.0 2.0 2.0 0.0 Per cent of the labour force Percentage growth of GDP Annual % change in UK GDP at constant prices,% of labour force unemployed 0.0 -2.0 Real GDP (Annual % Change) LHS -2.0 -4.0 -4.0 -6.0 -6.0 -8.0 -8.0 02 03 04 05 06 07 08 09 10 11 12 Source: UK Statistics Commission