
Recomendados
Más contenido relacionado
Similar a Sust 4103 capstone project poster rogers
Similar a Sust 4103 capstone project poster rogers (7)
Más de uaocs
Más de uaocs (14)
Sust 4103 capstone project poster rogers
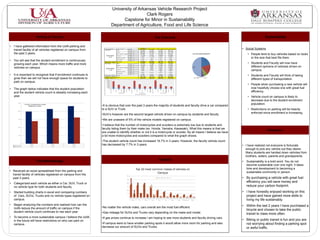
- 1. University of Arkansas Vehicle Research Project Clark Rogers Capstone for Minor in Sustainability Department of Agriculture, Food and Life Science Parking on Campus The Outcome Sustainability • I have gathered information from the UofA parking and transit facility of all vehicles registered on campus from Fayettev Student ille Campus Car Type Car Data Vech Count Ye a r 2009-2010 6,659 2010-2011 7,484 2011-2012 7,875 Gra nd Tota l 22,018 • Social Systems Year % 36.8% 38.4% 39.3% 38.2% SUV Vech Count 3,615 4,232 4,299 12,146 the past 3 years. No Vech Type Year % Vech Count Year % 20.0% 2,023 11.2% 21.7% 1,751 9.0% 21.4% 2,167 10.8% 21.1% 5,941 10.3% • People tend to buy vehicles based on looks Student Vehicle Truck Vech Count 1,615 2,149 1,825 5,589 +16.7% Motorcycle Year % Vech Count Year % 8.9% 7 0.0% 11.0% 7 0.0% 9.1% 17 0.1% 9.7% 31 0.1% or the size that best fits them. • You will see that the student enrollment is continuously Scooter Vech Count Year % 3 0.0% 9 0.0% 4 0.0% 16 0.0% • Students and Faculty will now have Stude nt Ve ch Count 13,922 15,632 16,187 45,741 Stude nt Ye a r % 76.9% 80.3% 80.7% 79.4% growing each year. Which means more traffic and more Faculty Car Vech Count Year % 1,833 10.1% 1,568 8.1% 1,628 8.1% 5,029 8.7% different opinions of vehicles driven on SUV Vech Count 1,008 926 1,024 2,958 vehicles on campus. Year % 5.6% 4.8% 5.1% 5.1% No Vech Type Vech Count 807 745 649 2,201 Faculty Vehicle Year % 4.5% 3.8% 3.2% 3.8% - 7.7% Truck Motorcycle Vech Count Year % Vech Count 536 3.0% 1 602 3.1% 559 2.8% 6 1,697 2.9% 7 campus. Year % 0.0% 0.0% 0.0% 0.0% • Scooter Vech Count 2 2 It is important to recognize that if enrollment continues to Faculty Vech Count Faculty Year % Year % 0.0% 4,187 23.1% 0.0% 3,841 19.7% 0.0% 3,866 19.3% 0.0% 11,894 20.6% • Students and Faculty will think of taking Tota l Ve ch Count 18,109 19,473 20,053 57,635 grow then we will not have enough space for students to Tota l Ye a r % 10, 000 100.0% 100.0% 100.0% 100.0% different types of transportation. 9, 000 park on campus. 8, 000 7, 000 • People when purchasing a new vehicle will 6, 000 5, 000 4, 000 3, 000 2, 000 • The graph below indicates that the student population 1, 000 0 now hopefully choose one with great fuel No Vech Type No Vech Type No Vech Type SUV SUV SUV Car Car Car Truck Truck Truck and the student vehicle count is steadily increasing each 2009-2010 2010-2011 2011-2012 efficiency. F acility Student year. • Vehicle count on campus is likely to decrease due to the student enrollment 25,000 population. 7 of Every 10 Students have a vehicle Registered on campus •It is obvious that over the past 3 years the majority of students and faculty drive a car compared 20,000 to a SUV or Truck. • Restrictions on parking will be heavily enforced since enrollment is increasing. •SUV’s however are the second largest vehicle driven on campus by students and faculty. 15,000 •We are unaware of 5% of the vehicle models registered on campus. •I believe that the number of motorcycles and scooters is extremely low due to students and 10,000 faculty listing them by their make (ex. Honda, Yamaha, Kawasaki). What this means is that we Reflections are unable to identify whether or not it is a motorcycle or scooter. By all means I believe we have 5,000 a lot more motorcycles and scooters compared to what the graph shows. •The student vehicle count has increased 16.7% in 3 years. However, the faculty vehicle count 0 Student Enrolement 2009-2010 19,845 2010-2011 21,405 2011-2012 23,199 has decreased by 7.7% in 3 years. • I have realized not everyone is fortunate Student Vech Count 13,922 15,632 16,187 enough to pick any vehicle out they desire. Many students are handed down vehicles from brothers, sisters, parents and grandparents. Outlook The Methodology • Sustainability is a bold word. You do not become sustainable over one night. It takes Top 10 most common makes of vehicles on time and development to becoming a • Received an excel spreadsheet from the parking and sustainable community or person. Campus transit facility of vehicles registered on campus from the 3000 past 3 years. 2500 2009-2010 2010-2011 2011-2012 • By purchasing a vehicle with great fuel • Categorized each vehicle as either a Car, SUV, Truck or 2000 efficiency you will save money and no vehicle type for both students and faculty. 1500 reduce your carbon footprint. • I have honestly enjoyed working on this 1000 • Started building charts in excel and comparing numbers 500 of Cars, SUVs, Trucks and no vehicle types registered on 0 project and have gained more skills to Student Faculty Student Faculty Student Faculty Student Faculty Student Faculty Student Faculty Student Faculty Student Faculty Student Faculty Student Faculty campus. Chevrolet Ford Honda Toyota Nissan Jeep Dodge Hyundai General Motors Mazda living my life sustainably. • Began analyzing the numbers and realized how can the • Within the last 2 years I have purchased a UofA reduce the amount of traffic on campus if the •No matter the vehicle make, cars overall are the most fuel efficient. bicycle and chosen to take the public student vehicle count continues to rise each year. •Gas mileage for SUVs and Trucks vary depending on the make and model. transit to class more often. • To become a more sustainable campus I believe the UofA •If gas prices continue to increase I am hoping to see more students and faculty driving cars. in the future will have restrictions on who can park on • Biking or public transit is fun and you are campus. •If campus were to have smaller parking spots it would allow more room for parking and also not worrying about finding a parking spot decrease our amount of SUVs and Trucks. or awful traffic.