
Recommended
More Related Content
What's hot
What's hot (20)
Similar to Cdp imphal
Similar to Cdp imphal (20)
Recently uploaded
Recently uploaded (20)
Cdp imphal
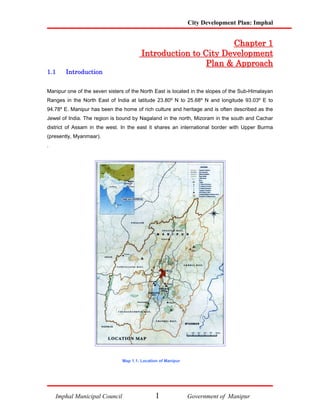
- 1. City Development Plan: Imphal C h ap t e r 1 I nt r o duc t i o n t o C i t y D e ve l o pme nt P l an & A p p r o ac h 1.1 Introduction Manipur one of the seven sisters of the North East is located in the slopes of the Sub-Himalayan Ranges in the North East of India at latitude 23.80º N to 25.68º N and longitude 93.03º E to 94.78º E. Manipur has been the home of rich culture and heritage and is often described as the Jewel of India. The region is bound by Nagaland in the north, Mizoram in the south and Cachar district of Assam in the west. In the east it shares an international border with Upper Burma (presently, Myanmaar). . Map 1.1: Location of Manipur Imphal Municipal Council 1 Government of Manipur
- 2. City Development Plan: Imphal Described by Lord Irwin as the 'Switzerland of India', Manipur boasts of an exotic landscape with gently undulating hills, emerald green valleys, blue lakes and dense forests. Manipur, literally meaning the land of jewel, is a paradise on earth where Mother Nature has been extra generous in her beauty. And from the very inception, this princely state of Manipur has always been a shining outpost of the country. Imphal, the capital city of Manipur is a rapidly growing urban area and a bustling town. It is the centre of all cultural, commercial and political activities in the State. It is a small and picturesque city and is a attractive tourist attraction. Imphal lies in the valley of the Manipur River and is surrounded by the North-Eastern hills. Imphal is the only Class I City in the State and is the centre for cultural traditions, festivals, as well as commerce. Map 1.2: Location of Imphal Imphal Municipal Council 2 Government of Manipur
- 3. City Development Plan: Imphal Imphal Municipal Council, which is spread over an area of 30.75 Sq. km, has a total population of 2,21,292 spread over East and West Imphal Districts. The Imphal Urban Agglomeration also takes into account fringe areas and has a total population of 2,50,234. The break up of the population under Imphal Urban Agglomeration covered by the City Development Plan in line with the applicability of the Jawaharlal Nehru National Urban Renewal Mission is as follows: Area Population Imphal Municipal Council Area (West District) 150595 Imphal Municipal Council Area (East District) 70897 Fringe Area (Outgrowth) in West District 11711 Outgrowth/Census Towns incl in East District 17031 Total Population (Imphal Urban Agglomeration) 250234 Table 1.1: Population of Imphal Urban Agglomeration With growth in urban population, growing population density and scaling up of activities, there has been substantial stress on the available infrastructure. The stress in the Infrastructure is reflected by the state of the basic infrastructure such as road, water, sanitation and drainage, which are grossly inadequate, and requires substantial development and investment. The ability of the State to provide basic services to the urban population requires substantial institution building and investments. 1.2 Overall Urbanisation in India and Trends According to the 2001 census, India has a population of 1027 million with approximately 28% or 285 million people living in urban areas. As a result of the liberalization policies adopted by the Government of India, the share of the urban population may increase to about 40 per cent of total population by the year 2021. It is estimated that by the year 2011, urban areas would contribute about 65 per cent of gross domestic product (GDP). Imphal Municipal Council 3 Government of Manipur
- 4. City Development Plan: Imphal 900 820 800 700 Population (Millions) 700 583 600 473 500 372 400 285 300 217 159 200 109 62.4 78.9 100 0 1951 1961 1971 1981 1991 2001 2011 2021 2031 2041 2051 Table 1.2: Projected Urbanisation However, this higher productivity is contingent upon the availability and quality of infrastructure services. Urban economic activities are dependent on infrastructure, such as power, telecom, roads, water supply and mass transportation, coupled with civic infrastructure, such as sanitation and solid waste management. Cities and towns in India constitute the second largest urban system in the world, and contribute over 50 per cent of the country’s GDP. They are central to economic growth. For the cities to realise their full potential and become effective engines of growth, it is necessary that focused attention be given to the improvement of infrastructure. This requires a Mission led initiative to be implemented on a time bound basis. In view of this the Government of India has launched the Jawaharlal Nehru National Urban Renewal Mission (JNNURM) in FY 2005-06; with an aim to create economically productive, efficient, equitable and responsive cities, The mission rest on the postulate that in order to make cities work and meaningfully contribute to the country’s economic growth and poverty reduction objective, it is essential to create incentive and urban reforms both at state and city level, appropriate enabling framework enhance the credit worthiness of the Municipal governance and integrate the poor with service delivery system. The objectives of the JNNURM are to ensure that the following are achieved in the urban sector: (a) Focussed attention to integrated development of infrastructure services in cities covered under the Mission; (b) Establishment of linkages between asset-creation and asset-management through a slew of reforms for long-term project sustainability; (c) Ensuring adequate funds to meet the deficiencies in urban infrastructural services; Imphal Municipal Council 4 Government of Manipur
- 5. City Development Plan: Imphal (d) Planned development of identified cities including peri-urban areas, outgrowths and urban corridors leading to dispersed urbanisation; (e) Scale-up delivery of civic amenities and provision of utilities with emphasis on universal access to the urban poor; (f) Special focus on urban renewal programme for the old city areas to reduce congestion; (g) Provision of basic services to the urban poor including security of tenure at affordable prices, improved housing, water supply and sanitation, and ensuring delivery of other existing universal services of the government for education, health and social security. The objectives of the Mission shall be met through the adoption of the following strategy: (1) Preparing City Development Plan: Every city will be expected to formulate a City Development Plan (CDP) indicating policies, programmes and strategies, and financing plans. (2) Preparing Projects: The CDP would facilitate identification of projects. The Urban Local Bodies (ULBs) / parastatal agencies will be required to prepare Detailed Project Reports (DPRs) for undertaking projects in the identified spheres. It is essential that projects are planned in a manner that optimises the life-cycle cost of projects. The life-cycle cost of a project would cover the capital outlays and the attendant O&M costs to ensure that assets are in good working condition. A revolving fund would be created to meet the O&M requirements of assets created, over the planning horizon. In order to seek JNNURM assistance, projects would need to be developed in a manner that would ensure and demonstrate optimisation of the life-cycle costs over the planning horizon of the project. (4) Release and Leveraging of Funds: It is expected that the JNNURM assistance would serve to catalyse the flow of investment into the urban infrastructure sector across the country. Funds from the Central and State Government will flow directly to the nodal agency designated by the State, as grants-in-aid. The funds for identified projects across cities would be disbursed to the ULB/Parastatal agency through the designated State Level Nodal Agency (SLNA) as soft loan or grant-cum-loan or grant. The SLNA / ULBs in turn would leverage additional resources from other sources. (5) Incorporating Private Sector Efficiencies: In order to optimise the life-cycle costs over the planning horizon, private sector efficiencies can be inducted in development, management, implementation and financing of projects, through Public Private Partnership (PPP) arrangements. Imphal Municipal Council 5 Government of Manipur
- 6. City Development Plan: Imphal It is thus recognized that Urban Social and Economic Growth is largely dependent on development of infrastructure, such as transportation, water supply, sanitation and solid waste management. For the cities to reach its potential and to develop truly as Growth Centers, a long- term vision, an assessment of the present status of the region, focused strategies and action plan needs to be developed. At the same time, Urban Local Bodies needs to be strengthened in order to make them independent and self-sustaining so that they are capable of developing and implementing sustainable projects on their own. ULBs also need to develop systems to ensure that they remain transparent and accountable. The North Eastern States are largely characterized by medium to low level of developments, which are reflected in low per capita income, poor economic base, limited industrial development. The States however are endowed with rich natural resources. Side by side the region is also endowed with rich cultural and heritage background. 1.3 City Development Plan The preparation of City Development Plan (CDP) is a pre-requisite for accessing funds under JNNURM. The CDP is both a perspective and a vision for the future development of a city it indicates: • Where a city is now? • Where it wants to go? – Vision, goals • What are its priorities? • How can it reach there? • What interventions are required? The CDP would provide a framework and vision within which projects can be identified and implemented. The goal of CDP is to create an economically productive, efficient, equitable, and responsive cities. 1.4 City Development Plan for Imphal Imphal is the only Class I City in the state of Manipur and is the centre of economic and social activity. The city is also the Gateway of North East India. Given the criticality of the region, there is strong requirement to develop physical infrastructure in order to drive the development process forward. At the same time, the growth in population places severe strain on urban amenities and infrastructure such as housing stock, public transport system, water supply, rubbish collection (solid waste), sanitation and sewerage systems. Also, unplanned development leads to Imphal Municipal Council 6 Government of Manipur
- 7. City Development Plan: Imphal unplanned growth and clustered settlements. A large number of their citizens are deprived of the basic urban services. Urban environment also gets severely affected. . Imphal City reaffirms its commitment to develop and implement strategies and programs with an aim to bring about focused development in infrastructure and provide its citizens a high quality of life and universal access to basic urban amenities while maintaining the rich cultural and heritage base of the city. As a first step to this end, a City Development Plan (CDP) has been prepared, which is both a vision document as well as a Perspective Plan. The City Development Plan is anchored on the Jawaharlal Nehru National Urban Renewal Mission goal on economically productive and efficient cities. The Plan has been developed with the assistance of IL&FS Infrastructure Development Corporation Limited. The CDP focuses on development of the infrastructure and builds up strategies that deal specifically with issues affecting the urban poor, strengthening of municipal governments, their financial accounting, budgeting systems and procedures, creation of structures for bringing in accountability and transparency, and elimination of legal and other bottlenecks that have stifled the land and housing markets. It provides a basis for cities to undertake urban sector reforms that help direct investment into city-based infrastructure. The principles of sustainability are fundamental to this approach and it is recognized that Assets created out of this Plan needs to be maintained in order to contribute to its potential. The objectives of the CDP shall be accomplished by a series of programs and schemes, which has been identified and included in the Plan. It is recognized that the CDP is a dynamic document and has been designed to be responsive to ever-changing requirement of its citizens. To this extent, the Plan will be continuously reviewed and developed to ensure that it is in line with the changing aspirations of its people. Imphal Municipal Council 7 Government of Manipur
- 8. City Development Plan: Imphal 1.5 Process Followed for CDP Preparation APPROACH TO FORMULATION OF CITY DEVELOPMENT Review of available data, reports and surveys on the city and initial consultations with the stakeholders. 1 F I Discussion with Government Officials, Identified N Stakeholders to Understand the Opportunities, Strength, A 2 Risk and Weaknesses of Imphal L C I T Y Data collection conducted on different parameters 3 followed by reconnaissance surveys, field visits like Demography, economy, Land use, environment, basic D infrastructure facilities and Institutional framework E V E L st O 1 Consultative Workshop to identify demand/gaps in infrastructure and felt needs of the people as well as P 4 aspirations. M E N T Preparation of Draft City Development Plan taking in to P account the above 1,2,3,4 points and peoples perception L 5 in line with the Mission Objective. A N nd I 2 Consultative Workshop; Finalisation of Vision and Strategies and Options based on vision and M P 6 Prioratisation. H A L 7 rd 3 Consultative Workshop; Discussion with different Stakeholders, concerned line departments, selected eminent citizens for finalization of the CDP taking in to consideration of the above points Imphal Municipal Council 8 Government of Manipur
- 9. City Development Plan: Imphal 1.6 Stakeholders Views and Concerns The CDP is an output of a wide-ranging consultation with key stakeholders. At the first stage, a vision for the future development of the city was developed which was a shared development in the medium perspective. There was almost unanimity of the concerns of the people. The stakeholders particularly representing the civil society were severely concerned at the lack of basic amenities and “disamenities” (negative amenities). There was a strong plea for planned development, decentralization, decongestion and/or expansion in a planned manner. There was also concerns of hazards such as “uncollected garbage/solid waste; heavily polluted Nambul River, choked drains, lack of sewerage; scanty drinking water; water logging/floods during monsoon; off season droughts. It was clear from the workshops and also substantiated by analysis, that there was a severe lack of basic services to the citizens. In terms of priority, Sewerage and drainage, decongestion and transportation, Water and Environment Protection were given high priority. The requirement was listed a safe and adequate 24x7 water and power supply, effective sewerage and drainage covering each zone, most accessible and systematically arrayed roads with outer/inner roads, mixed land use with adequate open space as to minimize traffic congestion, optimize accessibility, provide greener/sunnier living; well planned schools, systematic parking and shopping complexes for each zone. The services need to be delivered on a time bound basis to fulfill the strong aspirations of the people. There was a complete unanimity on the importance of maintaining the culture and heritage of the City. The city needed to be well developed and organized but also retain its spiritual culture and heritage culture. There was also a plea to develop Greater Imphal on an integrated manner so as to reduce the pressure on Imphal City. One of the critical issues raised by the Stakeholders was empowerment and capacity building of the Municipal Council. There was an acceptance that the municipal council needs to carry out a reform process so as to make it more responsive and accountable to the general people. Imphal Municipal Council 9 Government of Manipur
- 10. City Development Plan: Imphal JNNURM JNNURM 1sssttt Consullttattiive Workshop 1 Consu a ve Workshop IMPHAL IMPHAL Imphal Municipal Council 10 Government of Manipur
- 11. City Development Plan: Imphal JNNURM JNNURM 2nndd Consullttattiive Workshop nd 2 Consu a ve Workshop IMPHAL IMPHAL Imphal Municipal Council 11 Government of Manipur
- 12. City Development Plan: Imphal JNNURM JNNURM 3rrdd Consullttattiive Workshop rd 3 Consu a ve Workshop IMPHAL IMPHAL Imphal Municipal Council 12 Government of Manipur
- 13. City Development Plan: Imphal Some of the Speakers of the Workshops Imphal Municipal Council 13 Government of Manipur
- 14. City Development Plan: Imphal 1.7 Objectives and Overall Goals The overall goals of the Plan shall form the strategic priorities of the region and is aimed at achieving its vision. The overall vision of the region based on the discussions with the Stakeholders Meet is – Making Imphal City a vibrant, w ell administered and developed city while maintaining and further developing its transcending character as a ceremonial and spiritual city, rich in culture and heritage and providing its Citizens a comfortable and secured life by Developing and making available basic infrastructure services and efficient delivery framew orks to all its citizens so as to ensure that they are able to live a comfortable and quality life; Development of fringe areas and improve the regional linkages in the context of India’s Look East Policy; Endeavour to further develop the rich cultural heritage of the city Developed strong framew ork for Urban Governance and Institutional Development; Addressing Vital Issues of Urban Sociology in a multi-ethnic city. Strategic Aims & Implementation Programme The overall goals and visions are in turn integrated into strategic aims of what the Region seeks to achieve in the lifespan of the Mission. These form the basis for the various identified schemes and programs as well and formulation of policies to be taken up over the Mission Period. Strategic aims for each of the sectors have been provided in this City Development Plan (CDP). In order to achieve these aims a series of interventions in the form of schemes and programme have been identified. These schemes and programs have also been included under the various sections of the plan. Imphal Municipal Council 14 Government of Manipur
- 15. City Development Plan: Imphal Imphal has a very strong heritage and cultural background. It is recognized that preservation of the unique culture and heritage of the city is important and all projects and action plans need to take into account this background. It may be recognized that CDP is a dynamic document and has been designed to be responsive to ever-changing requirement of its citizens. To this extent, the Plan will be continuously reviewed and developed to ensure that it is in line with the changing aspirations of its people. 1.8 City Investment Plan (CIP) Based on the overall vision of the region, sectoral vision and present status, the CIP identifies specific interventions in the form of projects that can be implemented over the JNNURM period of seven years. These comprise a mix of short, medium and long-term projects. The CIP also include a block estimate of the said projects and the institutional and financial mechanism for implementation of the respective projects. The identification of the projects shall be an ongoing process and shall be in line with aspirations and needs of the people. 1.9 Adoption of CDP The Final City Development Plan was prepared after taking into account the various views and was adopted by Imphal Municipal Council. Imphal Municipal Council 15 Government of Manipur
- 16. City Development Plan: Imphal C h ap t e r 2 I nt r o duc t i o n t o t he R e gi o n Chapter 2: Introduction to the Region 2.1 Introduction to Imphal Urban Agglomeration Imphal, the capital city of Manipur, is situated at the centre of the valley of Manipur state. Imphal is the biggest urban settlement and the only class I city in the region. Primarily an administrative city, Imphal is of prime importance to almost all the urban centres and settlements surrounding it. NH 39 connects the city with Myanmar in the east and Nagaland in the North. Though the city has air connectivity with important cities like Delhi, Kolkata and Guwahati, it does not have any railway connectivity. The nearest railway head is at Dimapur in Nagaland. Imphal Municipal Council, which is spread over an area of 30.75 Sq. km, has a total population of 2,21,292 comprising municipal area in East and West Imphal. The Imphal Urban Agglomeration also takes into account fringe areas and has a total population of 250234. The break up of the population of the Area covered by the City Development Plan and in line with the applicability of the Mission is as follows: Area Population Imphal Municipal Council Area (West District) 150595 Imphal Municipal Council Area (East District) 70897 Fringe Area (Outgrowth) in West District 11711 Outgrowth/Census Towns incl in East District 17031 Total Population (Imphal Urban Agglomeration) 250234 Table 2.1: Population of Imphal Urban Agglomeration Imphal Municipal Council 16 Government of Manipur
- 17. City Development Plan: Imphal Map: 2.1: Imphal City Map 2.2 Population Imphal Urban Area recorded a population of 2,50,234 as per the Census of 2001 registering a decadal growth rate of 26.04% and comprising nearly 10% of the entire state's population. Population State/District/Town Civic Status Male Female Total Manipur State 1095634 1071154 2166788 Imphal West District 221781 222601 444382 Imphal East District 198371 196505 394876 Urban Imphal 123859 126375 250234 Agglomeration Table 2.1: Break-up of Population Source: Census 2001 Imphal Municipal Council 17 Government of Manipur
- 18. City Development Plan: Imphal 2.3 Location The city of Imphal is located at the longitude 93.57o E and latitude 24.50o N. Located nearly at the centre of the Manipur valley, Imphal is generally flat, elongated and tapering towards the south. Surrounded by hillocks (about 1500-2000 mt high), Imphal is at an average elevation of 790 m above mean sea level. Imphal River, Nambul River and Kongba River is running in the north- south direction and are having numerous tributaries through the town. The town is below the high flood level of Imphal River. The physiographic character has significant influence on the population growth pattern in the Imphal city. Major growth has taken place towards the south along the highways. The growth along the north, east and northwest has been restricted by hills. 2.4 Climate of the Region Imphal enjoys salubrious climate. The valley usually experiences a cool and pleasant climate. January is the coldest months while April-May is the hot season for Imphal. The prevailing wind direction during summer is from south and southeast to northwest. The Range of temperature and rainfall is as below: Maximum Temperature during summer: 36 Degree Centigrade Minimum Temperature during the winter: 0 Degree Centigrade Average temperature 20.4 Degree Centigrade Average Rainfall in the area: 1413mm. Source: www.imphalwest.nic.in 2.5 Soil Profile of the Region The soil in Imphal region is fertile land and is mainly made up of alluvial soil of recent origin. The soil is mainly made up of shallow black, brown and alluvial soils which have been technically classified as Udalfs-Ochrepts and Orchrepts-Aquepts-Fluvents. 2.6 Industries There are no large or medium scale industries in Imphal. Handloom weaving is the traditional household industry. Female work participation rate in the sector in over 60%. Skilled artisans in trades of imitation jewellery and silver works are also found in certain pockets in the region. Imphal Municipal Council 18 Government of Manipur
- 19. City Development Plan: Imphal General trade establishment comprises more than 90% of trade and commerce activity in the region. In Imphal, there were more than 3389 registered commercial establishments, out of which 80% are located in the core area. Retail shops are located along the Thangal Road, Raona Road, Bir Tikendrajit Road and Gandhi Avenue. There are few local shopping areas around the municipal area such as Kwakeithel, Singjamei, Kongba, Checkon, Lamlong, Naoremthong and Tera bazaar. There are ‘Nuphi Keithal’ (Women’s Market) in the core area and the periphery of the city. Factories and Industrial Total Units % to total state Units in the state units Agartala 36 2884 1.2 Aizawl 1439 4668 30.8 Gangtok 115 385 29.8 Guwahati 507 45193 1.1 Imphal 177 5779 3.1 Itanagar 27 4750 0.6 Kohima 80 1119 7.1 Shillong 321 4599 7 Table 2.2: Manipur Physical Map Imphal Municipal Council 19 Government of Manipur
- 20. City Development Plan: Imphal ject report Map 2.2. Physical Map Map 2.3: Forest Map of Manipur Imphal Municipal Council 20 Government of Manipur
- 21. City Development Plan: Imphal C h ap t e r 3 S o c i o an d D e m o gr ap h i c P r o f i l e 3.1 Background This section analyses and presents the social and demographical profile of the city of Imphal. Data has been obtained from Census data; various surveys conducted by IMC, ADB (NERUDP) as well as published data. The data has been computed based on available census data for the Municipal Council Area. In areas where trends for population of fringe areas are not available, trends for the Municipal Region has been followed. 3.2 Overall Population & Growth Rate Imphal with a total population of 2,50,234 (Census 2001) is spread over 27 wards in two districts, namely Imphal East and Imphal West. It contributes to more than 29.81 % of population of these two districts and 11.54 % of the entire state’s population (21, 66,788). Growth Population rate (1991-2001) State/District/Town Civic Male Female Total Status Manipur State 1095634 1071154 2166788 17.94 Imphal West District 221781 222601 444382 16.69 Imphal East District 198371 196505 394876 19.49 Imphal MC 123859 126375 250234 11.56 Table 3.1: Total Population Source: Census 2001 Imphal Municipal Council 21 Government of Manipur
- 22. City Development Plan: Imphal 3.3 Decadal Growth Rate The State of Manipur had experienced decadal population growth rate of around 17.94% during 1991-2001, which is though lower than the national average of 22.66 %. The decadal population growth rate in the two districts, namely Imphal West and Imphal East, among which IMC is spread was 16.69 % and 19.49 % respectively during 1991-2001. In this backdrop, Imphal Municipal Corporation has recorded a decadal population growth rate of 11.56 % during 1991- 2001 preceded by a significantly higher decadal growth of 26.76% during 1981-91. Decadal Grow th Rate-Im phal 100.00 90.00 80.00 70.00 60.00 50.00 gr owt h r at e 40.00 30.00 20.00 10.00 0.00 1961 1971 1981 1991 2001 Ye a r Table : 3.2 Decadal Growth Imphal Municipal Council 22 Government of Manipur
- 23. City Development Plan: Imphal Decadal growth of the various districts is presented in the graph below. Decadal Growth Rate (2001-1991) 70.00 60.00 50.00 40.00 66.41 30.00 29.36 29.24 28.83 20.00 26.04 23.87 19.49 17.94 15.26 16.69 10.00 0 0.00 Ukhrul Imphal West Chandel Churachandpur Imphal East * Manipur Bishnupur Tamenglong Thoubal Senapati (Excluding 3 Sub-Divisions) Imphal Munipal Corporation Sources: Census 2001 and Individual district website Figure 3.1: Decadal Growth 1991-2001 3.4 Population Density The population density in Imphal recorded at 7,202 persons per sq. km as compared to the state’s density of 97 persons per sq.km of area. With only 0.13% of the total area, Imphal Municipal Corporation area contributes to more than 10% of the state’s population. The density has been significantly and sharply growing over the last few decades as shown in the figure below. Population Density 8000 7000 6000 5000 4000 density 7203 6456 3000 5093 2000 3924 2689 1000 0 1961 1971 1981 1991 2001 Year Table 3.3 Trend of Decadal Growth Imphal Municipal Council 23 Government of Manipur
- 24. City Development Plan: Imphal Density 2001 Region (Persons per Sqkm) India 324 West Bengal 904 Manipur District 97 Imphal Municipal Corporation 7202 Area Table 3.4: Population Density – Comparative Scenario Source: Census 2001 The population density in the Imphal city has already crossed 7202, comparable with much larger municipal area. In addition, the density is likely to cross 9500 persons per sq.km of area if the population grows as estimated. The forecasted population density in Imphal is given below (Fig 3.4.1) 12000 10000 9587 8716 7923 8000 7203 6456 Density 6000 Predicted Density 4000 2000 0 1991 2001 2011 2021 2031 Figure 3.5: Predicted Population Density Source: Based on forecasted population 3.5 Population Projections In the last five decade, the North Eastern Region has witnessed drastic demographic change due to several historic and economic reasons. On one hand, certain states have witnessed decline in population growth rate whereas on the other hand, for certain states urban population growth rate has gone up drastically. This clearly indicates that the growth trend has not stabilized over the years. Imphal Municipal Council 24 Government of Manipur
- 25. City Development Plan: Imphal 1951-61 1961-71 1971-81 1981-91 1991-01 State U R T U R T U R T U R T U R T Arunachal NA NA NA 0 3 3.3 9.1 2.7 3.1 10.3 2.5 3.2 7.2 1.4 2.4 Pradesh Assam 8.5 2.7 3.0 5.1 2.9 3 3.3 2 2.1 3.4 2.1 2.2 3.1 1.6 1.7 Manipur 37.2 2.2 3.0 7.6 2.7 3.2 10.3 1.2 2.9 3.0 2.4 2.6 1.2 3.2 2.7 Meghalaya 7.2 1.8 2.4 2.3 2.9 2.8 5.1 2.4 2.8 3.2 2.8 2.9 3.2 2.5 2.7 Mizoram 7.4 2.9 3.1 10.2 1.6 2.3 12.4 2.4 4.0 10.1 0.0 3.4 3.3 1.9 2.6 Nagaland 16.6 5.3 5.7 10.4 2.9 3.4 8.9 3.5 4.1 5.6 4.3 4.6 5.4 5.0 5.1 Sikkim 9.6 1.4 1.6 11.1 2.0 2.6 10.0 3.4 4.2 -3.2 3.4 2.5 5.0 2.7 2.9 Tripura 9.2 5.7 6.0 4.7 3.0 3.1 3.3 2.7 2.8 6.5 2.5 3.0 2.6 1.3 1.5 Table 3.6: Population Density – Comparative Scenario Source: NERUSP Project report In a similar fashion, Imphal, the capital city of Manipur has also experienced growth in population due to a mix of factors including annexation, natural growth and migration but the change in the growth rate has been declining significantly. The decadal growth rate has declined during 1991- 2001 from 45.94% during 1961-71. In the meantime, the density in the Imphal city had already crossed 7202 persons per sq.km of area in 2001. Considering relevant factors including Imphal remaining the only major urban centre in Manipur, high population density, urban migration, amongst others, it has been estimated that the population will continue to grow in the Municipal corporation area with the decadal growth rate stabilizing at around 10% for the next few decades. Based on the estimation, the projected population is given below. Year 1961 1971 1981 1991 2001 2011 2021 2031 79510 116034 156622 198535 250234 275257 302783 333061 Table 3.7. Population Trends for Imphal Municipal Corporation Area Source: Prediction based on Census Data The population in the Municipal Corporation area is estimated to cross 3.33 lakh within 2031. Though the figure is not extremely high but considering the area under the corporation and expected growth in business development, it would create huge pressure on the city. Imphal Municipal Council 25 Government of Manipur
- 26. City Development Plan: Imphal Actual & Predicted Population 350000 300000 250000 200000 333061.454 Population 302783.14 Predicted Population 275257.4 150000 250234 198535 100000 156622 116034 50000 79510 0 1961 1971 1981 1991 2001 2011 2021 2031 Year Fig 3.8: Projected Population Source: Census 2001 3.6 Population Distribution The growth pattern of Imphal city is highly influenced by its physiographic character. The major growth of the city has taken place towards the South, particularly along the highways. The growth in North, East and North West is restricted by hills. Low-lying areas restrict the growth on the east. The existing population density of Imphal is pyramidal. The density is higher in the central area, especially on South, and hence major population density is in the southern part. 3.7 Migration The North East Urban cities have been experiencing significant in-migrant population. The table below shows that cities like Guwahati; Agartala has witnessed huge in-migrant population in 1991. In Imphal, the in-migrant population figure was 1,98,535 accounting for 8.05% of the total population in 1991. Agartala Aizawl Gangtok Guwahati Imphal Itanagar Kohima Shillong In Migrants 47042 26568 1104 140885 15991 4745 9576 26172 Total Pop (1991) 157358 155240 25024 584342 198535 16545 51418 131719 % of migrants to total pop 29.89 17.11 4.41 24.11 8.05 28.68 18.62 19.87 Table 3.8: In-Migrant Population in 1991 Source: NERUSP Project report Imphal Municipal Council 26 Government of Manipur
- 27. City Development Plan: Imphal 3.8 Urbanization Urbanisation in Manipur district has been skewed. In several districts including Senapati (excluding 3 sub divisions), Tamenglong, Churachandpur and Ukhrul, the entire population resides in rural areas. Meanwhile, share of urban population in the Manipur state in 2001 was around 26.58%, clearly indicating that the urban population was concentrated in the remaining districts. Out of the two districts among which the Imphal Municipal Corporation area is divided, share of urban population in Imphal West was highest at 55.51% whereas the corresponding figure for Imphal East was relatively higher at 27.43%. % o f Urba n P o pula t io n 60.00 50.00 40.00 55.51 30.00 35.87 36.05 20.00 27.43 26.58 10.00 12.64 0.00 0.00 0.00 0.00 0.00 Figure 3.9: Urban Population Share Source: Census 2001 Data further shows, the level of urbanisation in Imphal West is much higher as compared to Imphal East. Urban/Rural ratio in Imphal West stood at 1.24:1 against Imphal East’s comparable figure of 0.37:1. Imphal Municipal Council 27 Government of Manipur
- 28. City Development Plan: Imphal Urbanisation Scenario 2500000 2166788 2000000 1590820 1500000 Population 1000000 575968 444382 500000 394876 246683 286566 250234 197699 108310 0 Total Rural Urban Total Rural Urban Total Rural Urban Urban Manipur Imphal West Imphal East Imphal Muni. Corp Figure 3.10: Urban Population Scenario – Manipur The level of urbanisation in the Imphal city has been significantly and steadily growing over the past few decades. Imphal Municipal Council 28 Government of Manipur
- 29. City Development Plan: Imphal 3.9 Sex Ratio The following figure provides details of the Sex Ratio (Females per 1000 Males) of Manipur State and the districts since 1971. The Sex Ratio for Imphal district (i.e. Imphal East and Imphal West) stood at 998, higher than the state corresponding figure of 978. The Sex Ratio in the district has recorded significant growth over the previous decade, 973 (1991). The Sex Ratio of the Imphal Municipal Corporation area is significantly higher than the district and state average at 1017. Sex Ratio (Females per 1000 Males) 1050 1017 998 998 993 1000 981 978 951 944 950 2001 922 1991 916 1981 900 1971 850 800 Churachandpur Tamenglong Corporation Chandel Thoubal Imphal Bishnupur Ukhrul Sub-Divisions) MANIPUR (Excl. 3 Sub-divisions) (Excluding 3 Municipal Imphal Senapati Figure 3.11: Sex ratio Source: SRS Website and Census 2001 data 29
- 30. City Development Plan: Imphal 3.10 Literacy Rate The following table represents a brief picture of the general educational standards of people in the Imphal Municipal Council area. Over 78% of the population in the Imphal Municipal Area is literate which is significantly higher than the state average of 60%. Following similar trend, 83% of the male population and 73% of female population are literate in the Imphal Municipal Council area as compared to state average figure of 68% and 52% respectively. Total Total Male Male Female Female Literate Illiterate Literate Illiterate Literate Illiterate Imphal Municipal Council (%) 78.43 21.56 83.94 16.05 73.02 26.97 Manipur (%) 60.48 39.51 68.76 31.23 52.00 47.99 Table 3.10: Literacy Scenario in Manipur and Imphal Source: Census 2001 3.11 Workforce Variance Census 2001 shows that the ratio of working to dependent population comes out to be 1:1.3 for the state. The ratio though is higher in case of the Municipal Council area recording around 1:1.97. Work force distribution 1000000 900000 800000 700000 600000 TOT_WORK_P 945213 500000 MAINWORK_P MARGWORK_P 400000 659364 300000 285849 200000 74370 64807 9563 100000 0 Manipur Total Imphal M Corp. Urban Fig : 3.12 Source: Census 2001 30
- 31. City Development Plan: Imphal The following figure further shows, that only 1% of the main working population are involved in casual and agricultural sectors whereas 8% is involved in household sector. Main Workers Profile-Imphal 1% 1% 8% MAIN_CL_P MAIN_AL_P MAIN_HH_P MAIN_OT_P 90% . Figure 3.12: Distribution of Main Work Force Source: Census 2001 3.11 Expenditure Variance The following tables show the monthly per capita expenditure (MPCE) for urban and rural areas of Manipur. MPCE provides a signal of the purchasing capacity of the population residing in Manipur state. Urban Manipur - Monthly per capita expenditure MPCE (Rs) 261-451 451-521 521-601 601-682 682-751 751-942 >942 Group ST 16.82 11.21 14.02 13.08 9.35 14.95 20.56 SC 23.08 7.69 7.69 15.38 15.38 7.69 23.08 OBC 9.56 12.97 13.31 20.14 20.14 16.72 7.17 OTHERS 19.05 20.24 15.48 10.71 12.7 14.68 7.14 Rural Manipur - Monthly per capita expenditure MPCE (Rs) <352 352-412 412-471 471-521 521-591 591-702 >702 Group ST 27.78 13.33 12.73 14.72 9.72 12.5 4.17 SC 0 19.44 27.78 19.44 22.22 8.33 2.78 OBC 4.73 11.49 11.49 19.59 24.32 14.19 14.19 OTHERS 4.64 15.46 13.92 9.28 18.04 20.1 18.56 Source: NSS Data & State Government Website 31
- 32. City Development Plan: Imphal Chapter 4 Economic & Industrial Base 4.1 Background The North Eastern Region is characterized by low level of economic and industrial activities. Majority of the urban population in the region is engaged in service, both Government and Private (as depicted in the following table); Imphal does not produce any significant consumer goods. Most of the items are imported from other states by roadways. City Service Shop Labour & Business Others Owners Daily Wage Earners Agartala 58.5 25.2 0.6 5.9 9.9 Aizawl 51.9 11.5 16.7 10.4 9.6 Gangtok 68.6 8.6 7.1 4.3 11.4 Guwahati 72.2 9.7 3.7 6.2 8.3 Imphal 56.9 13.7 15.4 9.5 4.6 Itanagar 65.5 10.7 1.7 3.7 18.5 Kohima 66.2 6.6 2.4 9.7 15.2 Shillong 54.5 14 4.7 3.9 23.0 Total 64.3 11.5 5.8 6.8 11.6 Table 4.1: Distribution of Employees by Category in major urban cities Source: NERUSP Project report 4.2 Industry The industries are not a major economic driver of any of the major urban centres in the region, with Imphal not being an exception 32
- 33. City Development Plan: Imphal Factories and Industrial Total Units % to total state Units in the state units Agartala 36 2884 1.2 Aizawl 1439 4668 30.8 Gangtok 115 385 29.8 Guwahati 507 45193 1.1 Imphal 177 5779 3.1 Itanagar 27 4750 0.6 Kohima 80 1119 7.1 Shillong 321 4599 7 Figure 4.2 Registered Factories and Industrial Units in NE urban cities Source: NERUSP Project report Handloom weaving is a traditional household industry with female work participation rate of over 65%. Traditional skilled artisans, especially in silk spinning and weaving are mainly concentrated in Chingmeirong, Singjamei and Chingamakha area. Skilled artisans in trades of imitation jewellery and silver works are concentrated around Keisampat, Kwakeithel and Singjamei Bazar area. The area has one industrial estate set up at Takyelpat. The industries in the region are mainly producing plastic items, paper and surgical equipment. In order to facilitate rapid and substantial industrial development in the State through enhanced investment, an investor-friendly environment, provision for infrastructure and institutional support, attractive incentive package and optimum utilisation of existing resources amongst others, the state government formulated the New Industrial Policy of Manipur in 2002. The aim is to achieve the desired goal by providing industry access to high quality infrastructure, extending institutional support for technology up-gradation, deregulating the business environment for an efficient, proactive and transparent administrative frame-work and catalyzing the entrepreneurial as well as creative capabilities of the human resources. Some of the major goals are to create gainful employment for local population, promote export-oriented industries, encourage large and medium industries in public, private, joint and assisted sectors, develop food processing industry by facilitating forward and backward linkages. 33
- 34. City Development Plan: Imphal 4.3 Trade & Commerce General trade establishments comprise over 90% of trade and commerce activity in the region. In Imphal, there are more than 3389 Registered Commercial Establishment, out of which 80% are located in the core area. Retail shops are located along the Thangal Road, Raona Road, Bir Tikendrajit Road and Gandhi Avenue. There are few local shopping areas around the municipal area such as Kwakeithel, Singjamei, Kongba, Checkon, Lamlong, Naoremthong and Tera bazaar. There are ‘Nuphi Keithals’ (Women’s Markets) in the core area and the periphery of the city. Hotel/Restaurant/ Confectionery General shop/ tea Trade % share shop % share Agartala 2768 94.6 159 5.4 Aizwal 3475 91.2 335 8.8 Gangtok 1056 96.8 35 3.2 Guwahati 55000 96.5 2000 3.5 Imphal 3212 94.8 177 5.2 Itanagar 1362 96.9 44 3.1 Kohima 2384 94.6 135 5.4 Shillong 2489 94.5 144 5.5 Table 4.3. Registered Trade Establishments in 2001-01 Source: NERUSP Project report 34
- 35. City Development Plan: Imphal 4.4 Agriculture Manipur state is predominantly an agricultural economy. As per data available with State Government, the share of agriculture in the state income has declined from 45.6% in 1980-81 to 24.7% in 2003-04 and is a serious concern. Over 57% of the state’s working population is comprised of cultivators and agricultural labourers. Meanwhile, the four valley districts, which cover 10.02% of total geographical area, include 73.18% of total agricultural land. But due to swelling population, it is becoming more and more difficult to expand agricultural area. Paddy is by far the most important crop in the region followed by maize and different type of millets, pulses and beans, mustard and seasum, sugarcane, cotton, yams and sweet potatoes, pineapples and many other kinds of fruits and vegetables. 4.5 Tourism Tourism is one of the most important sectors in this region with immense potential. Table 4.7.1 shows that Imphal city received a significant number of tourists during 2001-02. Data further showed that there were 49 hotels in Imphal with average rent ranging between Rs 150-300 per day. The hotels experienced average occupancy between 65% and 70%. 35
- 36. City Development Plan: Imphal A comparative table of occupancy of major hotels in the major northeast cities are given below: Domestic International Agartala 156475 1280 Aizwal 25000 - Gangtok 146923 7757 Guwahati 1000000 6000 Imphal 73482 131 Itanagar 8452 106 Kohima 29952 920 Shillong 178697 2390 Table 4.4 : Tourist inflow in the major cities in the NE Region in 2001-02 Source: NERUSP Project report At present the places open to foreign tourists are: Loktak Lake, Moirang; INA Memorial, Moirang; Keibul Lamjao Wildlife Sanctuary, Waithou Lake, Thoubal; and the Khongjom War Memorial, Thoubal. The places open to foreign tourists in groups are: (a) Imphal-Bishnupur-Phubala- Moirang-Sendra-Keibullamjao-Imphal. (b) Imphal-Moirang-Loktak Lake-Keibullamjao- Churachandpur-Khuga Imphal, (c) Imphal-Ukhrul-Siroi-Sangsak-Imphal, (d) Imphal-Thoubal- Waithou Lake-Khongjom-Kakching- Thonjao-Waikhong-Sugnu-Imphal, (e) Imphal-Khonghampat- Kanglatombi-Kangpokpi-Senapati-Karong-Mao Gate-Imphal, and (f) Imphal- Noney- Khongshang- Nungba- Jiribam- Imphal 4.6 Workforce Majority of the population in Imphal city is engaged in administrative and other related services. Census 2001 data shows that the ratio of working to dependent population comes out to be 1:1.3 for the state. The ratio though is higher in case of the Municipal Council area recording around 1:1.97. Data further reveals that 87% of the working population in Imphal city area belongs to the category of main workers whereas the remaining are marginal workers. Share of main worker’s category in the city is higher than state corresponding figure of around 70%. Table 4.6.1: Working Population Details Total Working Female Working Population Pop Male Working Pop Pop Imphal 250234 84785 52116 32669 Table 4.5 Workforce Source: Census 2001 36
- 37. City Development Plan: Imphal Chapter 5 Environment & Disaster Recovery Plan 5.1 Background Rapid urbanization can create enormous stresses on the natural environment. These stresses extend far beyond the land that urban areas actually occupy to affect the land that provides the resources to sustain urban life. Urban areas claim the ecological output and life support functions of both nearby areas and distant regions. The growing rate of population in the townships of the Planning Area is a prime example of the effect of urbanization. Environmental impact of urban areas is often invisible to urban residents themselves because the ecosystems that support them are far away. Thus as urban areas expand, so does their environmental impact. The number of urban households is growing at a faster rate than the population on account of the trend for having nuclear families with a decline in the average number of people per household. More households increase the amount of land and materials needed for housing construction. Economic growth is accompanied by the commensurate increase in amount of waste generated per person. In many cases, the waste is dumped in open sites, including wetlands that are not able to contain seepage into local waters. With the growing population density in urban areas and steep growth in the population trends, the ULBs are likely to face major challenges in maintaining the ecological balance and sustaining the development processes at the same time. The effect of this would lead to impacting of: • Public Health: Unclean water, poor sanitation, air pollution, heavy metals and other contaminants will cause widespread health problems; • Food Supply: Population pressures degrade considerable areas of arable land; • Freshwater: The supply of freshwater deteriorates with population growth; • Biodiversity: Economic growth affects biodiversity and pushes animal and plant species towards extinction; • Global Climate change: Global warming has become a serious problem 37
- 38. City Development Plan: Imphal 5.2 Situation Appraisal and Action Taken As there are no major industrial activities in Imphal, the level of pollution is lower than that of other centers. However, it has been noted that urban planning and land use regulation are not followed in several cases and this has an adverse affect on the environment. There is a need to develop an environmental management plan for improving the environment of the city. The specific objectives of the study are: Mapping of characteristic and environmental profile of the project cities and identification of environmental pollution and hot spots. Preparation of an environmental management plan that includes rehabilitation and mitigation measures; and Recommendation of guidelines for environmentally compatible land use planning. The ENVIRONMENT AND ECOLOGY WING came into exist during 1997 under the Environment and Forests Department of the Govt. of Manipur. The wing acts as a nodal agency in the state for planning, co-ordination and promotion of environmental sustainable development & its ecology in the state. Simply, the office deals with all the matter pertaining to environment & ecology of the state. The wing also acts as the state nodal agency for National Bio-diversity Strategy and Action Plan, preparation of State of Environment (SoE) report of Manipur, preparation of Health & Environment Mapping of Manipur, regional resource agency of Manipur for National Environmental Awareness Campaign, etc. The wing has also been successfully enforcing / implementing the various Acts and Rules laid down by the Ministry of Environment & Forests, Govt of India. 38
- 39. City Development Plan: Imphal Policy Planning: To evolve a State Environment Policy Resolution for adoption by the Government and its periodic views thereafter To promote and catalyze other Ministries / Departments to incorporate environmental concerns in their spectral policies Review of existing sectoral policies with a view to synthesize environmental component with them To ensure incorporation of environmental dimensions in future legislative enactment Conservation: To conserve the genetic diversity of different biogeographically provinces of the State To conserve the natural resources specially water bodies, flora & fauna, etc. To establish and manage State Botanical Garden and Environmental/Ecological Parks To conserve Biological diversity, identify endangered species and to undertake effective conservation measures for their protection and habitat restoration To promote and expand community based biodiversity conservation network in the State To protect and conserve sacred Groves/places/ sites/zones To carry out mapping of strategic and ecologically fragile areas with a view in involving rational land use plan to manage the natural resources To carry out eco-development work and restoration of fragile ecosystem Regulatory: To ensure the effective implementation of the following legislation : The Water (Prevention & Control of Pollution) Act 1974 and Rules 1978 The Water (Prevention & Control of Pollution) Cess Act 1977 and Rules 1978 The Air (Prevention & Control of Pollution) Act 1981 and Rules 1982 The Environment (Protection) Act 1986 and Rules 1998 Co-ordination: Co-ordinate various activities of the State Government in the areas of Environmental management Co-ordinate programmes of different agencies on Environmental Education, Training and 39
- 40. City Development Plan: Imphal Conservation of Eco-system Co-ordinate the work of various agencies other than Pollution Control Board relating to pollution monitoring and control Co-ordinate relevant activities of Non-Governmental Organisations/Institutions in Environmental protection Promotion: To promote all activities necessary to execute the nodal co-ordination work, regulatory and other conservation functions of different Departments To promote environmental awareness at all levels To promote environmental information dissemination network To promote multidisciplinary environmental and ecological research and studies To promote the aspect of human ecology for sustainable development To promote a State of experts on ecology and environment concerned, where services could be freely available to all State Government Departments and NGOs/Institutions Some of the ongoing approved schemes (as on 2006 – 07): Scheme Objective Eco Development Programme • This scheme seeks to prevent damage of the ecosystem in the state Environmental Information & Dissemination • This aims to build up public awareness about environmental issues and concerns Environment Education / Awareness • This imparts specific environment programme training to individuals and other stakeholders Environment Monitoring, Research & • Monitoring the quality of soil, air, Development water & human including lakes, rivers, community ponds, etc Study of catchment areas of major basins • Improvement of major river basins and the catchment areas Prevention and Control of pollution • Prevention of pollution by monitoring activities of small industries and motor vehicles Waste Management • Scientific management of wastes Table 5.1 Ongoing approved Schemes 40
- 41. City Development Plan: Imphal Some of the key targets during the 10th Five Year Plan period include: Improvement of State Environment monitoring, Research & Development Plan Augmentation of existing Environment Monitoring, R & D Laboratory of the office Nambul river Pollution abatement project Studies on Jhum cultivation Project on wasteland management, wetland management and conservation Implementation of Bio-diversity conservation programme including afforestation activities Expansion of Environment Information activities Setting up of Eco Clubs Ecological impact assessment programme Formulation of Environmental Action Plan for the state of Manipur Expansion of Community Biodiversity Conservation network 5.3 Status of Environment of Manipur A ‘soft-state’ on the North-Eastern border between India and Myanmar, Manipur has a total geographical area of 22,327 Sq. Km. of which 61.54% of the total population(2001) is in the valley while 38.46% in the hill districts. The state shares with a length of international border of 352 kms with Myanmar (Burma), accounting for 41.21% of the total length of the border. It is noted that Manipur is lies in one of the most severe seismic vulnerable zones in India. Other natural hazards such as land slides and floods are also common in most parts of the region. Recognising the peculiarities of the region, a Natural Disaster Management Program is being worked out covering the entire North-East. The entire state of Manipur falls in Seismic Zone – V. 41
- 42. City Development Plan: Imphal Fig 5.1: Seismic Zone Natural Resources: a) WATER Resources: The water resources in Manipur are from both the surface water (like Lake, River, Ponds, etc) & sub – surface (underground) water. As per land use data, total water bodies of the state is about 1.65% of the total land coverage. 9.45 % Submerged Cropped Land others 1.280% Land with or without 23.34 % Biomass scrub 38.725% Water Bodies 31.30 % Waterlogged / Marshy / Swampy land 1.649% Forests 49.249% Settlement 2.442% 35.90 % Lake / Reservoir / Tank / Canal Agricultureal Land 6.654% Fig : 5.2 : Land Cover Land Use Pattern SURFACE WATER of the region includes all the water resources from wetland, lakes, ponds & rivers. Wetland is one of the major characters of the State. However, the nature and demographic pattern over the last 1 or 2 centuries showed spectacular change and numerous 42
- 43. City Development Plan: Imphal wetlands had been lost. They are having wide variation in water spread during pre monsoons and post monsoons showing distinct hydro periods (exception for Loktak Lake in which water level is kept constant to run the existing hydro-electric project). Drainage & River System : Manipur lies in the catchment area of two river system, namely Ganga - Brahamaputra and Chindwin – Irrawaddi river system.. The main rivers including Barak, the biggest river of the state drain into Ganga – Brahamaputra river system. Imphal River, Nambul River, Iril River, Thoubal River, etc are some of the major rivers in the state. Profile of Basins Wetlands & Lakes : No. Wetland Water Spread ( in Ha ) Aquatic Vegetation ( in Area Ha ) ( in Ha ) Post- Pre-monsoon Post- Pre-monsoon monsoon monsoon A: Natural : Lake : 21* 43,358 14,548 105,84 295,32 33,708 Ox-bow Lake : 2 35 35 20 35 35 Waterlogged : 130 9,466 8,563 - 8,726 9,466 B: Man - Made: Reservoirs : 2 100 100 57 - 43 Total 155 52,959 Ha 23,246 Ha 10,661 Ha 38,293 Ha 43,252 Ha 2 2 2 2 529.6 km 232.5 km 106.6 km 382.9 km 432.5 km2 Source : Wetlands of Manipur (1997) : Space application Centre (ISRO) & Manipur Repote Sensing Application Centre 2 Ha = Hacter (100 Ha = 1 k m ) Table 5.2: Wetlands and Lake Out of these identified natural fresh water lakes, only the Loktak Lake (24,672 Ha) has been identified for taking up conservation urgently so far & also being one of the Ramsar Site for International Importance since 1996. Further, 12 Lakes more are also proposed for further identification under NLCP, as described below. Sl. No. Name of the propose District Area Lakes 01. Pumlen / Khoidum Pat Thoubal 8,022 Ha 02. Ikop /Kharung Pat Thoubal 6,520 Ha 03. Loushi Pat Thoubal 1,064 Ha 04. Waithou / PunnemPat Thoubal 455 Ha 05. Aongbikhong Pat Thoubal 225 Ha 43
- 44. City Development Plan: Imphal 06. Ushoipokpi Pat Thoubal 65 Ha 07. Sanapat Bishnupur 282 Ha 08. Utrapat Bishnupur 185 Ha 09. Tankha Pat Imphal West 65 Ha 10. Karam Pat Imphal West 185 Ha 11. Lamphel Pat Imphal West 5 Ha Table 5.3: Wetlands and Lake GROUND WATER table data of Manipur varies as per its geological formation i.e. for the plan areas (Central Valley districts) the ground water table is reported at 2 – 4 meter bgl (below ground level), whereas, for the hill & foothill areas (Hill districts) reported as 4 – 5 meter bgl (below ground level). Groundwater is mostly exploited through open wells, occurs under sub-artesian and artesian conditions in the deeper aquifers. Through tube-wells, the underground water are targeted to exploit the valley areas with the yields ranging from 0.6 to 4 cu.m./hr and an estimated annual recharge of 44 M cum has been estimated. Considering the clayey nature of formation in the top acuifer, development of this resource is not considered promising on a large scale either in irrigation of water supply. However, it can be exploited for local water supplied through open wells dug-cum-bore wells and tube wells. Recently, the North Eastern Regional Institute of Water and Land Management (NERIWALAM) and the Central Pollution Control Board, Delhi have reported the presence of arsenic in some of the existing underground water (Tube Well) in Kakching, Thoubal districts of the state. 44
- 45. City Development Plan: Imphal Fig 5.3: Profile of Ground Basins Water Quality Problems : Water quality for both the surface & sub surface has been monitoring by the Environment Monitoring, R & D Laboratory of the Environment & Ecology Office, Govt. of Manipur regularly. Environmental Pollution Status of Manipur Pollution Pollution Status Problems & Pollution Sources Level Surface Water - Lake : Moderate Eutrophic Domestic Sewage & Agriculture runoff Surface Water - River : Moderate Eutrophic Domestic Sewage & Agriculture runoff Surface Water - Pond : Moderate Eutrophic Domestic Sewage Underground Water : Low, but Contamination Host Rock, Solid Wastes Disposal considerable Air Pollution : Medium Ambient Air Smoke from Vehicles / Transport Soil Pollution : Low, but Contamination Solid Wastes Disposal considerable Wastes Disposal : High Non Segregation Urban, Domestic & Hospital Noise Pollution : Low -- Table 5.4: Wetlands and Lake 45
- 46. City Development Plan: Imphal Some of the hot spots for water quality resources & its problems have been identified as below: 1. Nambul River, in the urban area of Imphal City; 2. Loktak Lake and its periphery lakes; 3. Underground water at Kakching Town; 4. Community ponds namely Ningthem Pukhri, Thangmeiband Pukhri, Bijoy Govinda Moat, Kangla Moat, etc. at Imphal City; b) Forest Resources : District wise forests coverage of Manipur (2003) (area in Sq. km) Table 5.5 : Forest Resources c) Biodiversity: Manipur, physically adorned with microclimatic & monsoonic climate. The elevation of the state varies from 400 msl (Jiribam) to 2,994.36 msl (Tenipu Hill at western region of the state). Adapted to these, there are different types of forest ranging, say from tropical to sub-alpine. Hence, the state has a large number of flora and fauna considerably. Moreover, the north-eastern Himalyan region including Manipur happens to be one of the two mega biodiversity ‘hotspots’ in India. The state has a number of proposed biosphere reserves, like Yangoupokpi, Siroi, Kailam. Khongho- tenepu-Dzuko, Jial lake & Keibul Lamjao National Park where there are a number of wild palnts and animals (resident – migrant), including the much talked brow antlered deer, locally called SANGAI (cervus eldi eldi). However, a major threat for rapid great losing / diminishing of biological diversity has been facing by the state. Some of the major Biodiversity statistics may be highlighted as 46