

Recomendados
Recomendados
Más contenido relacionado
La actualidad más candente
La actualidad más candente (19)
Similar a Mall and afsl
Similar a Mall and afsl (20)
Último
Último (20)
Mall and afsl
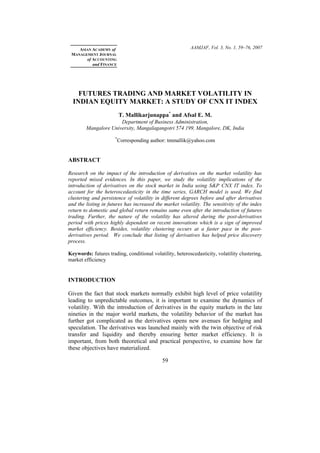
- 1. AAMJAF, Vol. 3, No. 1, 59–76, 2007ASIAN ACADEMY of MANAGEMENT JOURNAL of ACCOUNTING and FINANCE FUTURES TRADING AND MARKET VOLATILITY IN INDIAN EQUITY MARKET: A STUDY OF CNX IT INDEX T. Mallikarjunappa* and Afsal E. M. Department of Business Administration, Mangalore University, Mangalagangotri 574 199, Mangalore, DK, India * Corresponding author: tmmallik@yahoo.com ABSTRACT Research on the impact of the introduction of derivatives on the market volatility has reported mixed evidences. In this paper, we study the volatility implications of the introduction of derivatives on the stock market in India using S&P CNX IT index. To account for the heteroscedasticity in the time series, GARCH model is used. We find clustering and persistence of volatility in different degrees before and after derivatives and the listing in futures has increased the market volatility. The sensitivity of the index return to domestic and global return remains same even after the introduction of futures trading. Further, the nature of the volatility has altered during the post-derivatives period with prices highly dependent on recent innovations which is a sign of improved market efficiency. Besides, volatility clustering occurs at a faster pace in the post- derivatives period. We conclude that listing of derivatives has helped price discovery process. Keywords: futures trading, conditional volatility, heteroscedasticity, volatility clustering, market efficiency INTRODUCTION Given the fact that stock markets normally exhibit high level of price volatility leading to unpredictable outcomes, it is important to examine the dynamics of volatility. With the introduction of derivatives in the equity markets in the late nineties in the major world markets, the volatility behavior of the market has further got complicated as the derivatives opens new avenues for hedging and speculation. The derivatives was launched mainly with the twin objective of risk transfer and liquidity and thereby ensuring better market efficiency. It is important, from both theoretical and practical perspective, to examine how far these objectives have materialized. 59
- 2. T. Mallikarjunappa and Afsal E. M. In India, trading in derivatives started in June 2000 with the launch of futures contracts in BSE Sensex and S&P CNX Nifty index on the Bombay Stock Exchange (BSE) and National Stock Exchange (NSE), respectively. Options trading commenced in June 2001 in Indian market. Since then the futures and options (F&O) segment has been continuously growing in terms of new products, contracts, trade volume and value. At present, NSE has established itself as the market leader in this segment in the country with more than 99.5% market share. The F&O segment of the NSE outperformed the cash market segment with an average daily turnover of INR 191.44 billion as against INR.90.09 billion of cash segment in the year 2005–2006 (Derivatives Updates, NSE, www.nseindia.com). It shows the importance of derivatives in the capital market of the economy. The previous studies on the volatility effects of derivatives listing provide mixed results suggesting case based diagnosis of the problem. In addition to this, there is a large vacuum of robust examination of the impact of derivatives on the market volatility in India. In India, trading in derivatives contracts has been in existence for the last seven years, which is a substantial time period to provide some major inputs on its implications. In this backdrop it assumes significance to empirically examine the impact of derivatives on the stock market. In this paper we attempt to study the volatility implications of the introduction of derivatives on the cash market. Through this study we examine whether listing of futures leads to any significant change in the volatility of the cash market in India. Further, admitting the non-constant error variance in the return series we applied GARCH model that was found more appropriate to describe the data. Therefore the present work offers a value addition to the existing literature and proves to be useful to the investors as well as regulators. REVIEW OF LITERATURE The effects of introduction of derivatives on stock market have been widely studied across the world. The empirical works have focused on the derivatives market to address a wide range of issues such as volatility implications, lead-lag relationship between spot and derivatives markets, market efficiency, etc. Since derivatives is expected to be an effective risk management tool, researchers are particularly engaged to further their understanding of how derivatives introduction and trading affect the risk in the market. The debate over this issue has got fillip since the stock market crash of 1987 for which some blamed derivatives contracts (Becketti & Sellon, 1989). However, a general consensus does not exist on the volatility implications of options and futures listing. 60
- 3. Futures Trading and Market Volatility in Indian Market As Harris (1989) observes, theoretical analyses of the effect of the derivative contracts on the volatility of the underlying asset led to conflicting conclusions depending on the assumptions made. The empirical evidence on this subject is also mixed. Models developed by Danthine (1978) argue that the futures markets improve market depth and reduce volatility because the cost to informed traders of responding to mispricing is reduced. Conversely, Ross (1989) assumes that there exists an economy that is devoid of arbitrage and proceeds to provide a condition under which the no arbitrage situation will be sustained. It implies that the variance of the price change will be equal to the rate of information flow. The implication of this is that the volatility of the asset price will increase as the rate of information flow increases. Thus, if futures increases the flow of information, then in the absence of arbitrage opportunity, the volatility of the spot price must increase. Overall, the theoretical work on futures listing effects offer no consensus on the size and the direction of the change in volatility. We therefore need to turn to the empirical literature on evidence relating to the volatility effects of listing index futures and options. The empirical evidence is however quite mixed. Most studies summarize that the introduction of derivatives does not destabilize the underlying market; either there is no effect or perhaps only a very small decline in volatility (Hodges, 1992; Damodaran & Subrahmanyam, 1992; Sutcliffe, 1997; Mayhew & Mihov, 2000). The impact however, seems to vary depending on the time period studied and the country studied. For example, in a study of 25 countries, Gulen and Mayhew (2000) find that futures trading is associated with increased volatility in the US and Japan. In some countries, there is no robust, significant effect, and in many others, volatility is lower after futures have been introduced. In the first study on the impact of listing options on the Chicago Board of Exchange, Nathan Associates (1974) reported that the introduction of options has helped stabilize the cash market. This result has been supported by Skinner (1989) and also by other authors for the UK, Canada, Switzerland and Sweden. Lamoureux and Panickath (1994), Freund et al., (1994) and Bollen (1998) have found that the direction of the volatility effect is not consistent over time. Basal et al. (1989) concludes options listing leads to decrease in the total, but not systematic risk of optioned firms. This offers support for the theoretical research by Ross (1976) suggesting that option trading should actually improve the overall pricing efficiency of the equities markets through the "noise reduction". Bessembinder and Seguin (1992) examine whether greater futures trading activity (volume and open interest) is associated with greater equity volatility. Their findings are consistent with the theories predicting that active futures markets enhance the liquidity and depth of the equity markets. They provide additional 61
- 4. T. Mallikarjunappa and Afsal E. M. evidence suggesting that active futures markets are associated with decreased rather than increased volatility. Findings of Conrad (1989) suggest introduction of options on individual securities causes a permanent price increase accompanied by a decline in volatility. The systematic risk of securities does not appear to be affected by options introduction. Fedenia and Grammatikos (1992) report the listing significantly affects the spread on the underlying stock. The empirical findings show an average decline (increase) in spreads of NYSE (OTC) traded stocks associated with options trading. Trennepohl and Dukes (1979) also examined the effects of options market and find no adverse effect of options on stock volatility. The optioned stocks report a decrease in volatility compared to non-optioned ones. There are conclusions of "no effects" also in the literature of derivatives listing. Chamberlain et al. (1993) studied the effects of listing of options on Canadian stock exchanges and arrive at a conclusion that options listing has had little impact on the price behavior, trading volume or liquidity of the underlying stocks. Kabir (1999) observes a significant decline in stock price with the introduction of option trading, but no significant change in the volatility of underlying stocks. Some suggest that derivative markets caused an increase in speculative activity that in turn destabilized cash markets, causing higher volatility. For example, Harris (1989) indicates that volume in index futures and index options has increased dramatically since their introductions in 1982 and 1983 in the US market. Hence, a large speculative trading in the derivative markets makes the suggestion plausible. Mayhew and Mihov (2000) in a study on options market reports that volatility increases with options listing which is consistent with the hypothesis that forward-looking exchanges list options in anticipation of increasing volatility. Ma and Rao (1988) notice options trading does not have a uniform impact on the volatility of underlying stocks. According to their study stocks that were originally volatile, that is, traded primarily by uninformed traders, will be stabilized by the introduction of options and stocks that were more stable become destabilized by options trading. Comparing the spread in NYSE before and after the introduction of futures on S&P 500 index, Jegadeesh and Subrahmanyam (1993) find that average spread has increased subsequent to the introduction of futures trading. When they repeat their test by controlling for factors like price, return variance, and volume of trade, they still find higher spreads during the post-futures period. Their overall results suggest that the introduction of index futures did not reduce 62
- 5. Futures Trading and Market Volatility in Indian Market spreads in the spot market, and there is weak evidence that spreads might have increased in the post-futures period. About Indian market, Shenbagaraman (2003) opines the introduction of futures and options has had no effect on spot market volatility, at least none that is statistically significant. The increase in volatility in the Indian market might have been a consequence of increased volatility in the US markets. Thenmozhi (2002) investigated the empirical relationship between the NSE 50 futures and the NSE 50 index to determine if there is any change in the volatility of the underlying index due to the introduction of NSE 50 index futures and whether movements in the futures price provide predictable information regarding subsequent movements in the index. The finding that the volatility of the spot market has decreased with the introduction of futures trading and the explanatory power of index futures on spot market volatility support the introduction of derivatives trading and validates the financial sector reforms in the country. Raju and Karande (2003) studied price discovery and volatility in the context of introduction of Nifty futures at NSE. Co-integration and GARCH techniques were used to study price discovery and volatility, respectively. The major findings are that the futures market responds to deviations from equilibrium; price discovery occurs in both the futures and the spot market. The results also show that volatility in the spot market has come down after the introduction of stock index futures. Nath (2003) studied the behavior of stock market volatility after derivatives and arrived at the conclusion that the volatility of the market as measured by benchmark indices like S&P CNX Nifty and S&P CNX Nifty Junior has fallen during the post-derivatives period. The finding is in- line with the earlier findings of Thenmozhi (2002), and Raju and Karande (2003). In short there exists no consensus on the impact of introduction of derivatives. Theoretical frameworks as well as empirical evidences differ on the exact effect of futures and options on the market volatility. However studies on Indian market by far suggest that the listing of futures and options have further strengthened the capital market, providing liquidity and better price discovery. Also, there is no proof for destabilizing the market after the introduction of derivatives. DATA AND ECONOMETRIC METHODOLOGY Data In India, NSE accounts for about 99.5% of the total trading volume in the derivatives segment which consists of three indices and 116 individual stocks. 63
- 6. T. Mallikarjunappa and Afsal E. M. We use S&P CNX IT index to study the volatility behavior of the market. The study uses daily closing price of Spot S&P CNX IT index, Nifty Junior index and spot S&P 500 index for the period of January 2, 2000 through December 29, 2006. S&P CNX IT and Nifty Junior index price data were collected from the official website of NSE. S&P 500 index price series was downloaded from Yahoo Finance. The closing price data was converted to daily compounded return by taking the first log difference. Return Rt at the time t is given by where P)/ln( 1−= ttt PPR t is the closing price of the day t. S&P CNX IT is a well diversified stock index of 20 IT scripts. Companies in this index have more than 50% of their turnover from IT related activities like software development, hardware manufacture, vending, support and maintenance. The average total traded value for the last six months of CNX IT index stocks is approximately 91% of the traded value of the IT sector. CNX IT index stocks represent about 96% of the total market capitalization of the IT sector as at March 31, 2006. The average total traded value for the last six months of all CNX IT index constituents is approximately 14% of the traded value of all stocks on the NSE. CNX IT index constituents represent about 14% of the total market capitalization as at March 31, 2006. The next most liquid security after S&P CNX Nifty is the CNX Nifty Junior. CNX Nifty Junior represents about 9.77% of the total market capitalization as at March 31, 2006. The S&P 500 is an index consisting of 500 stocks. It is one of the most commonly used benchmarks for the overall US equities and is meant to reflect the risk/return characteristics of the large-cap universe. Econometric Methodology To start with, each time series we use in this study was subjected to a check for stationarity. Dickey-Fuller test was separately employed for price and return series of CNX IT, Nifty Junior, and S&P 500 time series. The unit root hypothesis (i.e., series is non-stationary) is found true in the closing price series of all the three cases whereas all the return series are stationary. Table 1 reports the result of unit root test. The stock market returns assumes conditional and unconditional variances; the former relates to the contemporaneous or short term shocks and is unlikely to be constant over time and the latter is assumed to be constant. Thus, the disturbance or error term in the return series normally exhibits unequal variance and hence requires the treatment of heteroscedasticity. In such situations, volatility modeling is better carried out by Auto Regressive Conditional Hetersedasticity Process (ARCH)/GARCH representations. In a seminal work, Engle (1982) proposed ARCH to model the conditional variance. In ARCH framework, the error variance is set to be a function of the squared 64
- 7. Futures Trading and Market Volatility in Indian Market error variance in the previous term. To avoid the long lag lengths on the disturbance term, Bollerslev (1986) suggested Generalized ARCH, known as GARCH (p, q) in which lags of the variance terms are also included in the variance equation. In this model q refers to the lag on 2 t iε − (squared disturbance term) and p to the lag on (variance). In other words p is the number of autoregressive terms and q is the number of moving averages used in the model. It takes into account excess kurtosis (i.e., fat tail behavior) and volatility clustering, two important characteristics of financial time series. Since GARCH model captures the tendency in financial data for volatility clustering, it is possible to relate information to volatility explicit, as any change in the rate of information arrival to the market will change the volatility in the market. Thus, unless information remains constant, which is hardly the case, volatility must be time varying, even on a daily basis. Therefore we make use of GARCH tools to study the implications of futures trading on the underlying market volatility. th Table 1 Unit Root Test CNX IT Spot t Stat Nifty Junior t Stat S&P 500 t Stat β1 0.00 –0.81 0.00 0.47 0.00 0.03Return series δ –0.98* –41.15 –0.81* –34.61 –1.02* –43.06 β1 30.71 0.85 –0.40 –0.12 3.67 1.69 δ 0.00 –2.00 0.00 0.67 0.00 –1.72 Notes: * Significant at 1% critical level Dickey-Fuller statistic at 1% = –3.34 and at 5% = –2.86 1 1t TY Y Tβ δ −∆ = + + ε , where 1t t tY Y Y −∆ = − This paper mainly focuses on two aspects. One, if the very introduction of futures/options has altered the volatility of the spot market. To examine this issue, we introduce a dummy variable into the conditional variance equation which measures the volatility (Pilar & Rafael, 2002; Calado et al., 2005). It is to be noted that any change in the market behavior including volatility would be a result of a mixture of factors. The introduction of futures/options contracts may also have a role in the volatility dynamics. However we are interested in the individual effect of futures introduction on the spot market volatility. We want to control for the market wide factors with potential to influence the return/volatility of the CNX IT spot index. Antoniou and Holmes (1995), Kamara et al. (1992) and Gregory and Michael (1996) have sought to filter out the factors that lead to market wide volatility by regressing spot market returns against a proxy variable for which there was no related futures contract. In this study, we use the returns of Nifty Junior index as the proxy variable, which essentially captures the market wide volatility and thus serves as a perfect control factor. Further in order to 65
- 8. T. Mallikarjunappa and Afsal E. M. isolate the unique impact of the futures introduction on the spot market volatility we need to remove any predictability associated with world returns (Pagan & Schwartz, 1990; Engle & Ng, 1993; Shembagaraman, 2003). Therefore, we incorporate lagged returns of S&P 500 index in the model. The following conditional mean equation is estimated. , . 1, & 500 .t t N Jun t S PR R R tα β γ − ε= + + + (1) Where Rt is the daily return on the S&P CNX IT index calculated as the first difference of the log of the index, Rt, N. Jun is the return on Nifty Junior index and Rt–1, S&P500 is the lagged S&P 500 index return. The error term or residual εt is expected to follow N(0, ht), where, ht is the conditional variance. However, given the fact that the GARCH family has nearly three dozen members (Bauer, 2005) it is an empirical question as to which model best fits the data. The evidence from the previous studies on Indian market suggests that GARCH (1, 1), EGARCH (Shembagaraman, 2003) and IGARCH (Nath, 2003) fit the data well. Since we are not concerned with asymmetric effects in this particular study, we use GARCH (p, q) model in this study. The lag truncation length (p and q) is determined using Likelihood Ratio (LR) tests and we choose p and q equal to one. Thus, in this paper the following GARCH (1, 1) conditional variance model is used. 0 1 1 1 2 1 .t t t h h Dα α ε β λ− − = + + + (2) Where ht is the conditional variance during time period t, 2 t iε − is the squared disturbance term (residual) at lag 1 in the general conditional mean model described in (1) and is the futures dummy variable taking a value zero if it is before futures introduction and one otherwise. If λ, the coefficient of dummy is statistically significant then the introduction of futures contracts has an impact on the spot market volatility. The sign of the coefficient is also important such a way that a negative (positive) value implies fall (rise) in the spot market volatility with the inception of futures trading. α0 is the ARCH constants, α1 and β1 are GARCH and ARCH coefficients, respectively. D The second issue of our interest is to see if the nature of the volatility has changed after the introduction of the index futures contracts. For this, we divide the sample period into two sub periods – pre-futures and post-futures – using the cut off date as August 29, 2003 and fit a GARCH model separately for each 66
- 9. Futures Trading and Market Volatility in Indian Market period.1 A formal test to check the parameter stability in the models of two sub samples is also conducted. This allows us to compare the nature of the volatility before and after the futures introduction. The result of the analysis is presented in the next section. RESULTS AND ANALYSIS Descriptive Statistics Table 2 presents the descriptive statistics of the CNX IT index and Nifty Junior index daily returns. There are 1,756 daily time series observations. CNX IT index has a mean return of –0.0012 with a standard deviation of 0.0636. If we divide the period into pre-futures and post-futures using August 29, 2003 as the cut off date, the daily return is more or less the same during both the sub periods. Standard deviation, a measure of volatility, has moved up from 0.0371 to 0.0833 during post-futures period. It shows that there is an increase in the spread with the inception of futures trading. Further investigation is required to infer if there is a change in volatility after the introduction of derivatives. We consider the returns of Nifty Junior, which has a daily mean return of 0.0003 with a standard deviation of 0.0189. Even though the Nifty Junior has no derivative contracts traded on it, it is sensible to examine the risk-return pattern before and after the introduction of derivatives into the market. Prior to futures introduction the return is –0.0007 with a standard deviation of 0.0202 whereas the return has increased to 0.0014 with a declined standard deviation of 0.0173 during the post-futures period. The analysis shows that the volatility of the market has considerably changed during the post-futures period. However, we have to examine if this change is because of futures introduction, which is discussed later on in this section. CNX IT index and Nifty Junior returns show evidence of fat tails since the kurtosis exceeds 3, which is the normal value, considering the entire period and especially post-futures, and evidence of negative skewness which means that the negative tail is particularly extreme. The Indian market faced a crisis in the pre-futures period due to the stock market scam of 2001. After the scam, a large number of IT companies experienced an unprecedented level of fall in their prices. It took more time for many stocks to come to the normal trading levels. Prior to this period, a large number of IT stocks had yielded very high returns and these returns were more distributed. However, in the post-futures period, only a limited number of companies could gain the market credibility by showing good operating 1 Options trading on the CNX IT index also started on the same day, but it is thinly traded and we do not separately consider options introduction in this study. 67
- 10. T. Mallikarjunappa and Afsal E. M. Table 2 Descriptive Statistics Period Mean return Std. deviation Skewness Kurtosis 02/01/2000 CNX IT –0.0012 0.0636 –29.1038 1077.5581 29/12/2006 Nifty.Jun 0.0003 0.0189 –0.9661 4.9161 Prefutures CNX IT –0.0012 0.0371 –0.4100 2.8222 (up to 29/08/2003) Nifty.Jun –0.0007 0.0202 –0.6360 2.1537 Post-futures CNX IT –0.0012 0.0833 –27.0063 765.2922 (after 29/08/2003) Nifty.Jun 0.0014 0.0173 –1.4603 10.2044 performance and therefore, the returns of these companies increased as the prices started rising from a very low level. But a large number of companies could not establish the credibility and their returns either declined or remained very low. As the number of stocks giving high returns was relatively less and the number of stocks giving either negative or low returns was relatively more in the post- futures period compared to the pre-futures period, the average returns have remained the same but the distributions has tended to be asymmetrical. This also caused more concentration of returns among a few stocks. The average returns have not changed because a few stocks have yielded higher returns making up the lower returns of other stocks in this segment. As Kurtosis measures the dispersion or concentration of returns around the mean, we find that the concentration has increased giving rise to more bulginess of the curve (as represented by higher Kurtosis value). Another possibility is that post-futures period particularly witnessed a large number of market players and restructuring activities in the Indian IT industry to capitalize on high demand and growth rate, and this directly affects the stock prices of IT companies in a disproportionate way. A few heavily traded stocks which are also traded in the F&O gave relatively higher returns but others reported either low or negative returns. This caused the return volatility of IT index showing more skewed and volatile behavior than it was in pre-futures period. Since the return distribution is centered on more risky stocks, the mean return of the index did not increase in-line with market index represented by Nifty Junior. In spite of higher volatility, the returns remain more or less the same in the post-futures. This can be further explained by the fact that trading in futures brought about a return-volatility tradeoff for the F&O traded stocks in the index. 68
- 11. Futures Trading and Market Volatility in Indian Market Volatility Analysis As we have stated, in order to measure the impact of the introduction of futures and options contract, we introduce the dummy variable in the conditional variance equation. A significant positive (negative) coefficient is an indication of increase (decrease) in the volatility as a result of introduction of futures contracts. The results of GARCH (1, 1) estimation with futures dummy are reported in Table 3. It is clear that market wide factors (measured by the Nifty Junior return) and worldwide factors (ascertained by lagged returns of S&P 500 index) explain the return series of CNX IT index. Notably the coefficient of the futures dummy, λ (6.334 with a t ratio of 3.720) is significantly different from zero, suggesting that the introduction of futures appears to have an impact on spot market volatility. This is a major result conveying the market volatility has increased with the launch of futures trading. This finding conforms to the findings of Jegadeesh and Subrahmanyam (1993), Mayhew and Mihov (2000) and others. Taking one of the sector wise indices, i.e. CNX IT index, we find that market volatility has been increased with the launch of futures trading. This is the first attempt, to our knowledge that takes a sector wise index to study the volatility implication of the futures trading in India. Other studies focussed on a general index, Nifty index and report a decline/neutral effect of futures trading on the spot market volatility. Our result disagrees with them. However, it will be more realistic to agree with Ma and Rao (1988) who infers that introduction of derivatives does not have a uniform impact on the volatility of underlying stocks. Stock specific characteristics have to be studied before arriving at a general conlusion. Table 3 GARCH (1, 1) Estimates with Futures Dummy Coefficient t value α Intercept –0.002# –2.010 β Nifty Jun. 1.940* 44.681 γ Lagged S&P 500 –3.347* –3.713 λ Dummy Futures 6.334* 3.720 α0 ARCH(0) 0.001* 13.040 α1 GARCH(1) 0.837* 62.840 β1 ARCH(1) 0.160* 8.005 Notes: * Significant at 1% level, # critical level 5% Observations = 1756 Conversely it is to be noted that listing of futures has not reduced the volatility of the cash market in India while volatility had reduced in the major markets as reported in the empirical literature (Conrad, 1989; Fedenia & Grammatikos, 1992; Harris, 1989). One of the possible reasons for the increase in 69
- 12. T. Mallikarjunappa and Afsal E. M. volatility is the large number of foreign institutional investors (FIIs) operating in the Indian market. Indian economy has been reporting robust growth rate lead by improved profitability of the Indian companies and, this has attracted a large number of investors to the market, including the FIIs. The coefficients of GARCH constant (α0), GARCH (α1) and ARCH (β1) are significantly different from zero at 1% critical level and are within the parametric restrictions implying greater impact shocks (news) on volatility. A significant ARCH coefficient (β1) indicates large shock on day t – 1 leads to a large (conditional) variances on day t. β1 being the "news" component explains that recent news has a greater impact on price changes. Specifically it relates to the impact of yesterday's news on today's volatility. The GARCH coefficient (α1) measures the impact of "old news". A relatively higher value of α1 in this implies a large memory of the model to the shocks. The sum of the coefficients α1 and β1 is near unity and indicates the large degree of persistence. GARCH predicted conditional volatility of the CNX IT index (the middle figure) along with residuals and returns for a period of January 2000 to December 2006 is plotted in Figure 1. The model does a good job in capturing volatility clustering, which has occurred at different intervals as is seen in the plot. 0 200 400 600 800 1000 1200 1400 1600 1800 -4 -2 0 2 Innovations Innovation 0 200 400 600 800 1000 1200 1400 1600 1800 0 0.5 1 Conditional Standard Deviations StandardDeviation 0 200 400 600 800 1000 1200 1400 1600 1800 -5 0 5 Returns Return Figure 1. GARCH plots of CNX IT index 70
- 13. Futures Trading and Market Volatility in Indian Market Nature of Volatility To examine if the nature of the volatility remains the same after the introduction of futures, we divide the sample period into pre-futures and post-futures and then separately run the GARCH process for each period. The model estimates are presented in Table 4. Sensitivity of the CNX IT index return towards domestic (measured by the Nifty Junior return) and worldwide factors (ascertained by lagged returns of S&P 500 index) still exists in both sub periods. In the pre- futures estimates the coefficients of ARCH and GARCH are statistically significant at 1% level of significance. A higher GARCH coefficient in the pre- futures period shows that the prices respond to old news effectively. With the introduction of futures, the market volatility is determined by recent innovations only, as evidenced by a higher ARCH value and an insignificant GARCH value during the post-futures period. Before futures introduction, the sum of ARCH and GARCH coefficients being 0.8574 indicates relatively lower level of persistence. Conversely, post-futures estimates reveals extreme level of persistence of recent shocks. The market now reflects only recent shocks (innovations). One possible explanation is that with the introduction of futures, quality of information and market's ability to absorb and reflect them has increased substantially. This is because of increase in the number of players and the number of choices available to the investors. A large number of players (including foreign institutional investors) and the choices combined with rapid information flow to the cash market based on the position taken by the operators and investors in the derivatives market is supposed to contribute to the efficient flow of information. All these reasons, in turn resulted in relatively less memory of shocks and thus contributing to market efficiency. Returns still shows persistence of only recent shocks and therefore, it can be inferred that market is becoming more efficient. Further research is required to determine the form of efficiency which the market is attaining with the introduction of futures. In short, it can be concluded that the nature of the volatility has also changed after the introduction of futures trading and it has contributed to market efficiency also. Chow Test for Parameter Stability In order to check the parameter stability in the regression models of pre- and post-futures, assuming constant error variance, we conduct a Chow test for structural change. In this case a comparison is made between the regression coefficients of pre- and post-futures models under the null hypothesis that both model coefficients are statistically same. Chow test statistic follows F distribution with degrees of freedom (k, n1 + n2 – 2k) where k is the number of parameters and n1 and n2 are the number of observations in the pre- and post-futures regression models respectively. The null hypothesis of parameter stability (i.e. no structural change) cannot be rejected if the computed F value in an application does not 71
- 14. T. Mallikarjunappa and Afsal E. M. exceed the critical F value with d.f. (k, n1 + n2 – 2k) obtained from the F table at the chosen level of significance. The computed F value (3, 1750) is 4.1110, which exceed table value of 3.78 at 1% significant level, and therefore we reject the hypothesis of parameter stability. This suggests that the regression coefficients are statistically different before and after futures listing. GARCH estimated volatility of CNX IT for before and after futures listing is depicted in Figures 2 and 3, respectively. From the above discussion and the comparison of figures it is evident that the nature of the volatility has changed after the introduction of futures. Table 4 GARCH Estimates for CNX IT Index Before and After Futures Introduction Before After Coefficient t value Coefficient t value α Intercept –0.0002 –0.1975 –0.0272* –10.2123 β Nifty Jun. Return 1.1153* 28.8121 2.7010* 23.8818 γ Lagged S&P 500 0.2136* 4.1136 –1.0826* –4.1600 α0 ARCH(0) 0.0001* 5.3974 0.0023* 9.2636 α1 GARCH(1) 0.7111* 13.4575 0.0001 0.0000 β1 ARCH(1) 0.1463* 4.2780 1.0000* 8.8459 Note: * 0 100 200 300 400 500 600 700 800 900 1000 -0.2 0 0.2 Innovations Innovation 0 100 200 300 400 500 600 700 800 900 1000 0 0.05 0.1 Conditional Standard Deviations StandardDeviation 0 100 200 300 400 500 600 700 800 900 1000 -0.5 0 0.5 Returns Return Figure 2. GARCH plots of CNX IT index (pre-futures) 72
- 15. Futures Trading and Market Volatility in Indian Market 0 100 200 300 400 500 600 700 800 900 -4 -2 0 2 Innovations Innovation 0 100 200 300 400 500 600 700 800 900 0 2 4 Conditional Standard Deviations StandardDeviation 0 100 200 300 400 500 600 700 800 900 -5 0 5 Returns Return Figure 3. GARCH plots of CNX IT index (post-futures) CONCLUSION With the objective of analyzing the impact of introduction of derivatives on the spot market volatility in India, we examined the volatility behavior of S&P CNX IT index using GARCH model. The result shows that the introduction of derivatives has increased the spot market volatility. The present work suggests that the introduction of futures trading leads to destabilizing effect by increasing the volatility of underlying market. Further, separate estimates for pre- and post- derivatives reveal that sensitivity of the index return to domestic and global return remains same even after the introduction of derivatives contracts. However, the price sensitivity to old news is absolutely absent during the post- futures period. The appearance of large ARCH coefficient in the post-derivatives model points to the fact that the returns predominantly depends on the latest innovations and volatility clustering occurs at a faster pace. We observe relatively lower persistence of shocks and long memory process in the prederivatives period, but recent innovations assume significance after the introduction of futures and therefore, we conclude that listing of derivatives has helped price discovery process. Besides, it is an indication of market achieving more efficiency with the introduction of futures. The result of Chow test for parameter stability clearly indicates structural change in the coefficients of pre- and post- 73
- 16. T. Mallikarjunappa and Afsal E. M. futures periods suggesting a change in the nature of volatility during the post- futures period. The results by and large suggest that the derivatives perform the risk- mitigation and price discovery process. Though, the index volatility has increased after the futures introduction, derivatives is expected to bring about a risk-return tradeoff for the stocks traded in the F&O segment through the hedging and speculative avenues available in the derivatives market. It is noteworthy that many eligible stocks in the index (as per the criteria defined by Securities and Exchange Board of India) are still kept out of F&O segment and bringing all of them in the ambit of derivatives would help reduce market volatility. It is to be emphasized that even after a large number of stocks were brought into the F&O segment, the trading is concentrated on a few stocks. The stock exchanges need to explore the possibility of increasing the liquidity in the segment by initiating measures to spread the trading to other stocks. This is needed to ensure that a few stocks do not become the market movers. If the trading is spread among a larger number of stocks, the volatility is likely to come down as all the stocks may not move at the same pace at all times. REFERENCES Antoniou, A., & Holmes, P. (1995). Futures trading, information and spot price volatility: Evidence for the FTSE – 100 stock index futures contract using GARCH. Journal of Banking and Finance, 19, 117–129. Basal, V. K. et al. (1989). An empirical reexamination of the impact of CBOE option initiation on the volatility and trading volume of the underlying equities: 1973– 1986. The Financial Review, 24, 19–29. Becketti, S., & Sellon, Jr. G. H. (1989). Has financial market volatility increased? Economic Review, Federal Reserve Bank of Kansas, June 17–30. Bessembinder, H., & Seguin, P. J. (1992). Futures trading activity and stock price volatility. Journal of Finance, 47, 2015–2034. Bollen, N. P. B. (1998). A note on the impact of options on stock return volatility. Journal of Banking and Finance, 5(22), 1181–1191. Bollerslev, T. (1986). Generalized autoregressive conditional heteroscedasticity. Journal of Econometrics, 31, 307–327. Calado, J. P. T. et al. (2005). An empirical analysis of the effects of options and futures listing on the underlying stock return volatility: The Portuguese case. Applied Financial Economics, 15, 907–913. Chamberlain, T. W. et al. (1993). The impact of options listing on stock behavior and market liquidity: Some Canadian evidence. Journal of Business Finance and Accounting, 20, 687–98. Conrad, J. (1989). The price effect of options introduction. Journal of Finance, XLIV, 487–498. 74
- 17. Futures Trading and Market Volatility in Indian Market Damodaran, A., & Subrahmanyam, M. G. (1992). The effects of derivative securities on the markets for the underlying assets in the United States: A survey. Financial Markets, Institutions and Instruments, 1(5), 1–22. Danthine, J. (1978). Information, futures prices, and stabilizing speculation. Journal of Economic Theory, 17, 79–98. Engle, R. F. (1982). Autoregressive conditional heteroscedasticity with estimates of the variance of the United Kingdom inflation. Econometrica, 50, 987–1007. Engle, R. F., & Ng, V. (1993). Measuring and testing the impact of news on volatility. Journal of Finance, 48, 1749–1778. Fedenia, M., & Grammatikos, T. (1992). Options trading and the bid-ask spread of the underlying stocks. Journal of Business, 65, 335–351. Freund, S. et al. (1994). A regression analysis of the effects of option introduction on stock variances. Journal of Derivatives, V1, 25–38. Gregory, K., & Michael, T. (1996). Temporal relationships and dynamic interactions between spot and futures stock markets. The Journal of Futures Markets, 16(1), 55–69. Gulen, H., & Mayhew, S. (2000). Stock index futures trading and volatility in international equity markets (Working paper). University of Georgia. Harris, L. (1989). S&P 500 cash stock price volatilities. Journal of Finance, 44, 1155– 1175. Hodges, S. (1992). Do derivative instruments increase market volatility? In Stewart Hodges (Ed.). Recent advances in theory and practice. VII (chapter 12). Manchester: Manchester University Press. http://finance.yahoo.com/q/hp?s=per cent 5EGSPC/. http://www.nseindia.com/. http://www.nseindia.com/content/us/fact2006_sec6.pdf/. Jegadeesh, N., & Subramanyam, A. (1993). Liquidity effects of the introduction of the S&P 500 index futures contracts on the underlying stocks. Journal of Business, 66, 171–187. Kabir, R. (1999). The price and volatility effects of stock options introductions: A reexamination (Working paper). Tilburg University. Kamara, A. et al. (1992). The effects of futures trading on the stability of the S&P 500 returns. Journal of Futures Markets, 12, 645–658. Lamoureux, C. G., & Panickath, S. K. (1994). Variations in stock returns: Asymmetries and other patterns (Working paper). Purdue University. Ma, C. K., & Rao, R. P. (1988). Information asymmetry and options trading. The Financial Review, 23, 39–51. Mayhew, S., & Mihov, V. (2000). Another look at option listing effects (Working paper). Purdue University. Nath, G. C. (2003). Behaviour of stock market volatility after derivatives (NSE working paper). Retrieved April 23, 2005, from http://www.nseindia.com/content/ research/Paper60.pdf/. Nathan Associates. (1974). Review of initial trading experience at the Chicago Board Options Exchange (Working paper). CBOE, Chicago. Pagan, A., & Schwert, G. W. (1990). Alternative models for conditional stock volatility. Journal of Econometrics, 45, 267–290. 75
- 18. T. Mallikarjunappa and Afsal E. M. Pilar, C., & Rafael, S. (2002). Does derivatives trading destabilize the underlying asset? Evidence from the Spanish stock market. Applied Economics Letters, 9, 107–110. Raju, M. T., & Karande, K. (2003). Price discovery and volatility of NSE futures market. SEBI Bulletin, 1(3), 5–15. Ross, S. A. (1976). Options and efficiency. Quarterly Journal of Economics, 90, 75–89. . (1989). Information and volatility: The no-arbitrage martingale approach to timing and resolution irrelevancy. Journal of Finance, 44, 1–17. Shenbagaraman, P. (2003). Do futures and options trading increase stock market volatility? (NSE working paper). Retrieved ……….. from http://www.nseindia.com/content/research/ Paper60.pdf/. Skinner, D. J. (1989). Options markets and stock return volatility. Journal of Financial Economics, 23, 61–78. Sutcliffe, C. (1997). Stock index futures: Theories and international evidence, 2nd ed. International Thomson Business Press. Thenmozhi, M. (2002). Futures trading, information and spot price volatility of NSE-50 index futures contract (NSE working paper). Retrieved …………… from http://www.nseindia.com/content/ research/Paper59.pdf/. Trennepohl, G. L., & Dukes, W. P. (1979). CBOE options and stock volatility. Review of Business and Economic Research, 14, 49–60. 76