

Recomendados
Más contenido relacionado
La actualidad más candente
La actualidad más candente (13)
Similar a Presentation to investors
Similar a Presentation to investors (20)
Más de Victoria Rock
Más de Victoria Rock (20)
Último
Último (20)
Presentation to investors
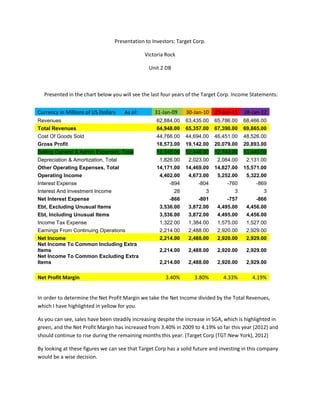
- 1. Presentation to Investors: Target Corp. Victoria Rock Unit 2 DB Presented in the chart below you will see the last four years of the Target Corp. Income Statements: Currency in Millions of US Dollars As of: 31-Jan-09 30-Jan-10 29-Jan-11 28-Jan-12 Revenues 62,884.00 63,435.00 65,786.00 68,466.00 Total Revenues 64,948.00 65,357.00 67,390.00 69,865.00 Cost Of Goods Sold 44,766.00 44,694.00 46,451.00 48,526.00 Gross Profit 18,573.00 19,142.00 20,079.00 20,893.00 Selling General & Admin Expenses, Total 12,345.00 12,446.00 12,743.00 13,440.00 Depreciation & Amortization, Total 1,826.00 2,023.00 2,084.00 2,131.00 Other Operating Expenses, Total 14,171.00 14,469.00 14,827.00 15,571.00 Operating Income 4,402.00 4,673.00 5,252.00 5,322.00 Interest Expense -894 -804 -760 -869 Interest And Investment Income 28 3 3 3 Net Interest Expense -866 -801 -757 -866 Ebt, Excluding Unusual Items 3,536.00 3,872.00 4,495.00 4,456.00 Ebt, Including Unusual Items 3,536.00 3,872.00 4,495.00 4,456.00 Income Tax Expense 1,322.00 1,384.00 1,575.00 1,527.00 Earnings From Continuing Operations 2,214.00 2,488.00 2,920.00 2,929.00 Net Income 2,214.00 2,488.00 2,920.00 2,929.00 Net Income To Common Including Extra Items 2,214.00 2,488.00 2,920.00 2,929.00 Net Income To Common Excluding Extra Items 2,214.00 2,488.00 2,920.00 2,929.00 Net Profit Margin 3.40% 3.80% 4.33% 4.19% In order to determine the Net Profit Margin we take the Net Income divided by the Total Revenues, which I have highlighted in yellow for you. As you can see, sales have been steadily increasing despite the increase in SGA, which is highlighted in green, and the Net Profit Margin has increased from 3.40% in 2009 to 4.19% so far this year (2012) and should continue to rise during the remaining months this year. (Target Corp (TGT:New York), 2012) By looking at these figures we can see that Target Corp has a solid future and investing in this company would be a wise decision.
- 2. Reference Target Corp (TGT:New York). (2012). Retrieved from Investing: Bloomberg Businessweek: http://investing.businessweek.com/research/stocks/financials/financials.asp?ticker=TGT:US