SlideShare una empresa de Scribd logo
1 de 54
CHAPTER -1
                                INTRODUCTION
1.1 INDUSTRY PROFILE
Telecommunication is the assisted transmission of signals over a distance for the purpose
of communication. Major factors responsible for the growth of telecommunications
industry are use of modern technology and market competition. One of the products of
modern technologies is optical fibers, which are being used as a medium of data
transmission instead of using coaxial or twisted pair cables. Optical fibers can carry a
high volume of data and are easier to maintain and install. Use of communication
satellites   makes    this   telecommunications     industry    a   booming      industry.
Telecommunications industry is going to be a digitized one. Use of ISDN (Inter Services
Digital Network) makes this telecommunication industry a total digitalized system and
eventually enhanced the speed and quality of digital communication
The telecom industry is one of the fastest growing industries in India. India has nearly
200 million telephone lines making it the third largest network in the world after China
and USA. With a growth rate of 45%, Indian telecom industry has the highest growth
rate in the world. Starting from telegraphic and telephonic systems in the 19th century,
the field of telephonic communication has now expanded to make use of advanced
technologies like GSM, CDMA, and WLL to the great 3G Technology in mobile
phones. Day by day, both the public players and the private players are putting in their
resources and efforts to improve the telecommunication technology so as to give the
maximum to their customers.
- Much of the growth in Asia Pacific Wireless Telecommunication Market is spurred by
   the growth in demand in countries like India and China.
- India‘s mobile phone subscriber base is growing at a rate of 82.2%.
- China is the biggest market in Asia Pacific with a subscriber base of 48% of the total
   subscribers in Asia Pacific. Compared to that India’s share in Asia Pacific Mobile
   Phone market is 6.4%.
        Though the telecom sector in India has experienced a faster rate of growth, still it
suffers from the problem of complex tax structure. Presently the sector suffers from the
problem of 12% service tax, 6-10% license fee, 2-6 % spectrum charges, 1.5% asset
                                             1
deficit charges, and 2% education cess.
A single tax system should be introduced for making the tax system investor friendly.


HISTORY
India is the fourth largest telecom market in Asia after China, Japan and South Korea.
The Indian telecom network is the eighth largest in the world and the second largest
among emerging economies.

 The industry has witnessed an explosive growth in recent years. Teledensity has more
than doubled from 2.3 per cent in 1999 to 4.8 per cent in 2002. However, the world
average is almost 7.5 times and the Asian average 4.5 times the Indian average. The
Indian telecom market size of over US $ 8 billion is expected to increase three fold by
2012.

 The expansion of the telecom industry in India has been fuelled by a massive growth in
mobile phone users, which has reached a level of 10 million users in December 2002, an
increase of nearly 100 per cent in 2002. This exponential growth of mobile telephony can
be attributed to the introduction of digital cellular technology and decrease in tariffs due
to competitive pressures.

 For the first time in India, the growth of cellular subscriber base has exceeded the
fixed line subscriber base. However, cellular penetration is still 1 per cent as compared
to world average of around 16 per cent. Cellular subscriber base is projected to grow at
a CAGR (Compounded Annual Growth Rate) of 48 per cent to exceed 45 million in
2007 and at 30 per cent to 88 million in 2012.
 History of Indian Telecommunications started in 1851 when the first operational land
lines were laid by the government near Calcutta (seat of British power). Telephone
services were introduced in India in 1881. In 1883 telephone services were merged with
the postal system. Indian
 Radio Telegraph Company (IRT) was formed in 1923. After independence in 1947,
 all the foreign telecommunication companies were nationalized to form the Posts,
 Telephone and Telegraph (PTT), a monopoly run by the government's Ministry of


                                             2
Communications. Telecom sector was considered as a strategic service and the
 government considered it best to bring under state's Control.
         The first wind of reforms in telecommunications sector began to flow in 1980s
 when      the   private   sector   was   allowed      in    telecommunications   equipment
 manufacturing. In 1985, Department of Telecommunications (DOT) was established.
 It was an exclusive provider of domestic and long-distance service that would be its
 own regulator (separate from the postal system). In 1986, two wholly government-
 owned companies were created: the Videsh Sanchar Nigam Limited (VSNL) for
 international telecommunications and Mahanagar Telephone Nigam Limited (MTNL)
 for services in metropolitan areas.
  In 1990s, telecommunications sector benefited from the general opening up of the
economy. Also, examples of telecom revolution in many other countries, which resulted
in better quality of service and lower tariffs, led Indian policy makers to initiate a
change process finally resulting in opening up of telecom services sector for the private
sector. In 1997, Telecom Regulatory Authority of India (TRAI) was created. TRAI was
formed to act as a regulator to facilitate the growth of the telecom sector. New National
Telecom Policy was adopted in 1999 and cellular services were also launched in the
same year.
 Telecommunication sector in India can be divided into two segments: Fixed Service
Provider (FSPs), and Cellular Services. Fixed line services consist of basic services,
national or domestic long distance and international long distance services. The state
operators (BSNL and MTNL), account for almost 90 per cent of revenues from basic
services. Private sector services are presently available in selective urban areas, and
collectively account for less than 5 per cent of subscriptions. However, private services
focus on the business/corporate sector, and offer reliable, high- end services, such as
leased     lines,    ISDN,     closed     user       group     and    videoconferencing.
Cellular services can be further divided into two categories: Global System for Mobile
Communications (GSM) and Code Division Multiple Access (CDMA). The GSM
sector is dominated by Airtel, Vodafone-Hutch, and Idea Cellular, while the CDMA
sector is dominated by Reliance and Tata Indicom.


                                                 3
MAJOR SERVICE PROVIDERS IN INDIA.
Two different technologies are deployed by the mobile operators in India namely GSM
and CDMA.The GSM service providers are Bharthi, BSNL, Hutch, IDEA, Aircel,
Reliance, Spice, MTNL and BPL, whereas the CDMA service providers are TATA, and
Reliance.


Market Share of the Telecom Company in India


GROWTH AND DEVELOPMENT OF THE INDUSTRY
Telecommunications is a mature industry that has been globally available for some time.
Growth of subscribers, traffic, and most importantly revenues, is by no means automatic.
Entry costs for new users and tariffs must be continuously reduced to increase subscriber
numbers and minutes of use. Infrastructure solutions that deliver lower cost coverage and
more efficient capacity are critical to drive up service volumes and revenues.
Competition is often already intense amongst the established player.
                                            4
Additionally, there is a steady stream of new operators and service providers who
build up their service capabilities with the latest technology, hoping to create a major
competitive advantage. Business Growth, Cost Efficiency and Evolution are therefore
regarded as key drivers which can be addressed with wireless technology. The
penetration of wireless services in developing regions and the ability to achieve
reasonable speeds for wireless data has resulted in continued wireless services
penetration and revenue growth, often at the expense of wireline services.
       The overall telecommunication services market is expected to grow profoundly in
the coming years lead by wireless and high speed Internet services. Opening up of
international and domestic long distance telephony services are the major growth drivers
for cellular industry


PRESENT STATUS OF THE INDUSTRY:
       Both fixed line and mobile segments serve the basic needs of local calls, long
distance calls and the international calls, with the provision of broadband services in the
fixed line segment and GPRS in the mobile arena. Mobile phone providers have also
come up with GPRS-enabled multimedia messaging, Internet surfing, and mobile-
commerce. The much-awaited 3G mobile technology is soon going to enter the Indian
telecom market. The GSM, CDMA, WLL service providers are all upgrading
themselves to provide3G mobile services.
       The value added services provided by the mobile service operators contribute
more than 10% of the total revenue. Bharti Airtel has the largest customer base with
31% market share, followed by Hutch and BSNL with each holding 22% market share.
The 2007 budget has brought further relief to the customers with the reduction in the
tariffs, both local and long distance, and with slashing down the roaming rentals.
 This is likely to lead to even more people going for cellular services and more and
more use of the value added services. However, landline telephony is likely to remain
popular, too, in the foreseeable future. MTNL, the largest landline service provider, has
recently taken some bold initiatives to retain its market share and, if possible, expand it.
The reduction in tariffs for airtime, national long distance, international long distance,
and handset prices has driven demand.

                                              5
FUTURE OF THE INDUSTRY:
India initially started with GSM technology for mobile communication. Being a
technology neutral country, India later allowed for CDMA technology also. Now 2.75G
EDGE technologies has been implemented and used. BSNL has got license for bringing
3G into operation. Trials are being conducted for 3G implementation in the four
metropolitan cities of India. Commercial 3G will be started by March 2007.

       With the dwindling revenues of the operators from the data and voice there is a
need to look at newer applications to fuel growth of the telcos. TV on Mobile has
emerged as a solid and potent answer to this consumer yearning. South Korea, China,
South Africa, Australia and Europe have seen this need and have acted upon the same by
implementing TV on Mobile. India is around the corner for implementation of similar
technology for the benefit of consumers.


1.2 COMPANY PROFILE
ORIGIN OF THE ORGANIZATION:
The Late Dhirubhai Ambani dreamt of a digital India — an India where the common man
would have access to affordable means of information and communication. Dhirubhai,
who single-handedly built India’s largest private sector company virtually from scratch,
had stated as early as 1999: “Make the tools of information and communication available
to people at an affordable cost. They will overcome the handicaps of illiteracy and lack of
mobility.”

Reliance Communications has a reliable, high-capacity, integrated (both wireless and
wireline) and convergent (voice, data and video) digital network. It is capable of
delivering a range of services spanning the entire infocomm (information and
communication) value chain, including infrastructure and services — for enterprises as
well as individuals, applications, and consulting.

Today, Reliance Communications is revolutionising the way India communicates and
networks, truly bringing about a new way of life.

                                             6
INDIA’S LEADING TELECOM COMPANY

Reliance Communications is the flagship company of the Anil Dhirubhai Ambani Group
(ADAG) of companies. Listed on the National Stock Exchange and the Bombay Stock
Exchange, it is India’s leading integrated telecommunication company with over 60
million customers.
 The business encompasses a complete range of telecom services covering mobile and
fixed line telephony. It includes broadband, national and international long distance
services and data services along with an exhaustive range of value-added services and
applications. Our constant endeavor is to achieve customer delight by enhancing the
productivity of the enterprises and individuals.
RCOM is India’s largest integrated and fully converged communications service provider
in the private sector, and has been rated among “Asia’s Top 5 Most Valuable Telecom
Companies”.
RCOM has a retail customer base of over 48 million as on 30th April, 2008 including
over 1.5 million individual overseas retail customers. The corporate clientele includes
2,100 Indian and multinational corporations, and over 800 global, regional and domestic
carriers.
RCOM has established a pan-India, next generation, integrated (wireless and wireline),
convergent (voice, data and video) digital network that is capable of supporting best-of-
class services spanning the entire communications value chain, covering over 20,000
towns and 450,000 villages, and growing.
RCOM owns and operates the world’s largest next generation IP enabled connectivity
infrastructure, comprising over 175,000 kilometers of fiber optic cable systems in India,
USA, Europe, Middle East and the Asia Pacific region


VISION:
“We will leverage our strengths to execute complex global—scale projects to facilitate
leading-edge information and communication services affordable to all individual
consumer and business in India.


                                             7
We will offer unparalleled value to create customer delighted and enhance business
productivity.
We will also generate value of our capabilities beyond Indian borders and enable millions
of Indians knowledge workers to deliver their services globally.”


VALUES
    •   We will put customer first at all times, and built long term relationship with them.

    •   We shall believe interpretation and keep every commitment that we make.

    •   We will operate with honesty and integrity interpretation all our dealings.

    •   We treat every individual with dignity and respect.

    •   We will approach every endeavor with zeal & an attitude towards excellence.
MISSION
    •   To attain global best practices and become a world-class communication service
        provider – guided by its purpose to move towards greater degree of sophistication
        and maturity.
    •   To work with vigour, dedication and innovation to achieve excellence in service,
        quality, reliability, safety and customer care as the ultimate goal.
    •   To earn the trust and confidence of all stakeholders, exceeding their expectations
        and make the Company a respected household name.
    •   To consistently achieve high growth with the highest levels of productivity.
    •   To be a technology driven, efficient and financially sound organisation.
    •   To contribute towards community development and nation building.
    •   To be a responsible corporate citizen nurturing human values and concern for
        society, the environment and above all, the people.
    •   To encourage ideas, talent and value systems.
    •   To uphold the guiding principles of trust, integrity and transparency in all aspects
        of interactions and dealings.
.

                                              8
OBJECTIVES:

       •   Strengthens and Enhances Existing Business Roles
       •   Drives greater empowerment, business focus, operational efficiencies and
           customer value.
       •   Takes another significant steps towards institutionalization and building a
           conglomerate of the future


AREAS OF OPERATIONS
   •   Reliance communications

   •   Reliance energy

   •   Reliance mutual funds

   •   Reliance life insurance

   •   Reliance general insurance

   •   Reliance port folio management


COMPETITORS:

Major competitors in today’s market are which gave a proper competition to the Reliance
company in the communication sector are as follows:

   •   IDEA
   •   AIRTEL
   •   TATA INDICOM
   •   VODAFONE
   •   BSNL


1.3 PRODUCT PROFILE
                                          9
Reliance Globalcom has an established reputation as a leading carrier's carrier. and are
specialists in providing tailored connectivity solutions for the largest consumers of
international communications capacity. We achieve this via a suite of flexible and high-
performance managed bandwidth (SDH / SONET), Ethernet, IP and co-location services,
which are available across four continents.


PRODUCTS
   •   GSM Services
                   Prepaid
                   Postpaid
   •   Home Phones
                   Fixed line
                   Fixed Wireless
   •   Internet & Broadband
                   Internet up to 8 mbps
                   Wi-Fi
   •   Wireless Internet
                   Data Card
                   USB Modem
   •   Reliance PCO

   •   Reliance IPTV


Reliance FLAG Suite of Services

Reliance Globalcom provides a suite of Wholesale services under the "Reliance FLAG"
brand. Reliance FLAG is the worlds largest private undersea cable system spanning
65,000 kms seamlessly integrated with Reliance Communications 1, 10,000 kms of
domestic optic fiber provides a robust Global Service Delivery Platform connecting 37
key business markets in India, the Middle East, Asia, Europe, and the U.S. through an
overlay low-latency, global MPLS-based IP network. The Services provided under
Reliance FLAG are Global Ethernet, managed Bandwidth, Capacity Services, IP Transit,
IPLC and VPN Service.


                                   CHAPTER -2
                                              10
RESEARCH DESIGN

2.1 THEOREITICAL BACKGROUND OF THE STUDY
Marketing is defined by American marketing association “Marketing is the performance
of business activities that direct the flow of goods and services from product to
customers”
Marketing management is a business discipline which is focused on the practical
application of marketing techniques and the management of a firm's marketing resources
and activities.
Functions of marketing management:
    •   Determination of marketing goals

    •   Formulating marketing, plans, procedures, polices etc

    •   Designing marketing strategies and marketing mix

    •   Planning marketing programs

Sales: A sale is the pinnacle activity involved in selling products or services in return for
money or other compensation. It is an act of completion of a commercial activity
Sales management: sales management is attainment of sales force goals in a effective &
efficient manner through planning, staffing, training, leading & controlling organizational
resources.
Functions: The functions of sales management include planning, organizing and
controlling of activities related to recruitment, selection, supervising, motivating and
evaluating the performance of sales force. An important part of the function is to balance
sales activities of the sales team that create short term results, together with building the
business for the longer term future.


Retailing: Retailing is the sale of goods and services to the ultimate consumers for
personal family or household use. Thus retailing involves more than selling tangible
products. Retailer is a person who links the producers and the ultimate consumers.
Functions of retailing:
                                             11
1. An assortment of merchandise appropriate to a particular market

   2. Breaking of bulk so that small quantities can be sold

   3. Holding of stock for instance availability at relatively stable prices

   4. Causing the goods to move through the distribution system i.e. from manufactures
      to retailer to consumer

   5. Credit and hire purchase facility

   6. Product guarantee, after sale service and dealing with customer complaints

Marketing channels - Marketing channels can be perceived as sets of interdependent
organizations involved in the process of making product/services to the potential
consumers
Functions of marketing channel:
   1. Satisfy demand by supplying goods and services at right place, quantity, quality
      and price

   2. Stimulate demand through promotional activities of the units (eg. Retailers,
      manufactures representatives, sales officers, wholesales)

   3. An organized network that creates value for end users by generation form,
      possession ,time and place utilities

   4. Identifying customer requirements


Marketing flow in channels:


                                             12
Physical               Physical                        Physical
          distribution           distribution                    distribution
          Possession             Possession                      Possession
          ownership              ownership                       ownership
          Promotion              Promotion                       Promotion
Producers Negotiation Wholesaler Negotiation Retailer            Negotiation Consumers
          Financing              Financing                       Financing
          Risking                Risking                         Risking
          Ordering               Ordering                        Ordering
          Payment                Payment                         Payment


2. 2 TITLE OF THE STUDY
“A study on channel effectiveness in service delivery of Royal Tech Distributor for
Reliance Communications in Bangalore city”
2. 3.STATEMENT OF THE PROBLEM
A problem well defined is half solved sometimes if we are able to define a problem we
require an explanatory research to gather data about the real nature of the problem and
tom suggest possible solution or new ideas. In case the clarity is there about the problem,
descriptive or casual research is conducted to determine the cause and effect relationship.
The study is conducted to determine to determine the effectiveness of Royal Tech
Distributors in service delivery for Reliance Communications in Bangalore city.
2. 4.OBJECTIVES OF THE STUDY
   •   To study channel effectiveness in service delivery of Royal Tech Distributor for
       Reliance Communications.

   •   To understand the distribution channel of reliance communication.

   •   To determine the satisfaction level of the retailers.

   •   To know the promotional activities provided by the distributors.

   •   To understand the role of DSR (Direct sales representatives) in service delivery.

   •   To provide company with suitable suggestions to increase the service delivery.

Data source

                                             13
 Primary data

    Secondary data

Primary data: this is first hand information collected from
   •   Existing retailers

   •   Future potential retailers

The above said data was collected through different modes like
   •   Observation method

   •   Survey method

   •   Interview method.

Secondary data: is data collected from sources which contain data which have been
collected and complied for another purpose. The secondary source of data consists of
Companies database and companies journals
Published records and reports
Related websites of various organizations


Research instruments:

Since the present study was accomplished in a limited time, no sophisticated tools or
statistical techniques could be used. However simple techniques like percentages, visual
presentations like bar charts pie charts, line graphs were used


Questionnaire:

A Communication method which is selected as the instrument for collecting the data as
the respondents are directly interviewed by the researcher.


2.5 SCOPE OF THE STUDY

                                            14
In the modern Telecommunication business world, to survive and to make costumer
delight and satisfy is the most important factor which needs to be considered. Increasing
the costumer base is a key factor. The study is the step towards ascertaining the service
provided by reliance communication and other service providers. The mobile phone
market is very competitive.

       The study was conducted in Reliance Communication to determine the channel
effectiveness service delivery of Royal Tech Distributor and in order to acquire a larger
customer base satisfying customer with their needs is the most important criteria. These
functions are done through the retailers so it is foremost important to satisfy the retailers
first to identify their needs and to fulfill them and to provide proper promotional tools for
retailers to promote the product.


2.6 RESEARCH METHODOLOGY AND DATA COLLECTION

The word research is derived from the Latin word meaning to know. It is a systematic
and a replicable process, which identifies and defines problems, within specified
boundaries. It employs well-designed method to collect the data and analyses the results.
It disseminates the findings to contribute to generalize able knowledge. The
characteristics of research presented below will be examined in greater details later are:

   •   Systematic problem solving which identifies variables and tests relationships
       between them,
   •   Collecting, organizing and evaluating data.
   •   Logical, so procedures can be duplicated or understood by others
   •   Empirical, so decisions are based on data collected
   •   Reductive, so it investigates a small sample which can be generalized to a larger
       population
   •   Replicable, so others may test the findings by repeating it.
   •   Discovering new facts or verify and test old facts.


                                             15
SAMPLE SELECTION

   •   Sample size
   •   Sampling plan and unit
   •   Sample design


Sample size

This refers to number of items selected from the universe to constitute a sample. In other
words the number of respondents from which data is collected. The sample size of this
study is 50 to determine the effectiveness of distribution and to evaluate the service
provided to retailers


Sampling units

One of the units into which an aggregate is divided for purpose of sampling. The
sampling unit survey was done in Bangalore city in areas like Shivajinagar,
Vasanthnagar, Cox town, Frazer town etc.


Sample design

Simple random sampling was chosen to collect relevant information.

Simple random sampling:

Simple random sampling refers to that sampling technique in which each and every unit
of the population has an equal opportunity of being selected in the sample


2.7 LIMITATIONS OF THE STUDY:
                                           16
•   The respondent may be biased.
•   Due to language problem it is possible that the respondents were not be able to
    understand the questionnaire and can cause misleading results.
•   The research was confined to Bangalore city only.
•   The time available was insufficient to carry on an exhaustive study but the research
    has done every effort to make this study an exhaustive one.


                                    CHAPTER-3

                                           17
DATA ANALYSIS AND INTERPRETATION


TABLE NO: 1

Table showing age of the respondents:


        PARTICULARS                 NO OF RESPONDENTS            (%)PERCENTAGE
             18-20                              7                         14

             20-25                              15                        30

             25-35                              18                        36

            Above 35                            10                        20

              Total                             50                       100


ANALYSIS:

From the above table it can be observed that, 30% are between age group 20-25, 36% are
between age group 25-35, 20% are between age group above 35 and 14% are between
age between group 18-20.


                                         18
GRAPH NO: 1


INFERENCE:

From the above graph we can interpret that a majority of respondents who belong to
middle and young age group are doing retailing business in India. This shows a huge
potential for the young and middle age group people to carry out retailing business.


TABLE NO: 2


                                           19
Table showing the occupation of respondents


    PARTICULARS               NO OF RESPONDENTS               (%)PERCENTAGE
       Business                       26                            52

      Self employed                       11                            22

       Professional                       9                             18

          Others                          4                             8

           Total                          50                            50


ANALYSIS:

From the above table it can be observed that, 52% of people are in business occupation,
22% are self employed, 18% are professionals and 8% are doing other occupations.


GRAPH NO: 2


                                          20
INFERENCE:

From the above analysis, it is clear that business people, self employed are doing retailing
business and professional people are less because of the research area and other people
carrying out retailing occupation are government employee, house wife’s etc.


TABLE NO: 3


                                            21
Gender of the respondents


     PARTICULARS              NO OF RESPONDENTS           (%)PERCENTAGE

           Male                            41                      82


          Female                           09                      18


           Total                           50                      100


ANALYSIS:

From the above table it can be observed that 82% are male and 18% are female among
the respondents who are doing retailing business.


GRAPH NO: 3


                                           22
INFERENCE:

From the above graph it is clear that majority of male are doing retailing business.
And female doing the retailing business are very few.


TABLE NO: 4


                                            23
Retailers experience with Reliance Communication


       PARTICULARS                      NO OF                  (%)PERCENTAGE
                                     RESPONDENTS

            0-1 yrs                           20                        40
            1-2 yrs                           18                        36
            2-4 yrs                           07                        14
            > 4 yrs                           03                         6
             Total                            50                        50


ANALYSIS:

From the above table it can be observed that 40% of retailers       are doing reliance
communication business from 0-1 years.36% are doing business from 1-2 year,14% are
doing business from 2-4 years and 6% are doing business from more than 4 years.


GRAPH NO: 4


                                         24
INFERENCE:

From the above analysis we can infer that from past one year majority of respondents are
retailers for reliance communication. The reason for being retailers of reliance
communication is due to launce of reliance GSM.


TABLE NO: 5


                                          25
Retailer response towards Reliance Communication


     PARTICULARS                NO OF RESPONDENTS                   (%)PERCENTAGE

         Excellent                           9                               18
           Good                              25                              50
          Average                            10                              20
      Below Average                          06                              12
          TOTAL                              50                             100


ANALYSIS:

From the above table it can be observed that, 50% of retailer’s have a good response
towards reliance communication. 20% say its average, 18% say it’s excellent, and 12%
say it’s below average.


GRAPH NO: 5

                                        26
INFERENCE:

From the analyzed data it is clear that retailers have a good response towards reliance
communication for the service provided by them.


TABLE NO: 6


Retailer’s opinion for Service value offered by the distributors


                                          27
PARTICULARS                   NO OF RESPONDENTS                  (%)PERCENTAGE

           Excellent                              7                              14
             Good                                28                              56
            Average                              06                              12
        Below Average                            09                              18
            TOTAL                                50                              100


ANALYSIS:


From the above table it can be observed that, 56% of retailer’s opinion about service
value offered by distributor is good, 14% say its excellent 12% say its average, and 18%
told it was below average.


GRAPH NO: 6


                                          28
INFERENCE:

From the analysis it is clear that service offered by royal tech distributor was good. And
this indicates that retailers have a good opinion towards the distributor for the service
provided by them.


TABLE NO: 7


Product availability of Reliance Communication to retailers by the
distributor

                                           29
PARTICULARS                NO OF RESPONDENTS             (%)PERCENTAGE

          Excellent                             15                      30
            Good                                19                      38
           Average                              11                      22
       Below Average                            05                      10
           TOTAL                                50                     100


ANALYSIS:

From the above table it can be observed that, 38% say product availability of reliance
communication by royal tech distributor was good, 30 say it’s excellent, 22% say its
average, and 10% say it’s below average.


GRAPH NO: 7


                                           30
INFERENCE:

From the above analysis it is clear that products of reliance communication were supplied
to retailers by the distributor in time and when the stock was over and there was no delay
in filling of stocks.


TABLE NO: 8

                                           31
Customer complaints handled by the distributors


     PARTICULARS               NO OF RESPONDENTS            (%)PERCENTAGE

            Yes                          31                          62

            No                           19                          38

         TOTAL                           50                          100


ANALYSIS:

From the above table it can be observed that, 54% of respondents agree that customer
complaints are handled by the distributor. And 46% do not agree about the customer
complaints handled by the distributor.


GRAPH NO: 8

                                         32
INFERENCE:

From the above survey it is clear that majority of retailers say that customer’s complaints
are handled and solved by the distributor. This indicates that service provided by
distributor in order to resolve the customer issues is good.


TABLE NO: 9

                                             33
Customer’s complaints handled by the retailers


       PARTICULARS                NO OF RESPONDENTS                (%)PERCENTAGE


             Yes                             33                             66

             No                              17                             34

            TOTAL                            50                            100


ANALYSIS:

From the above table it can be observed that, 66% of retailer says that they handle
customer complaints directly and 34% say they do not handle customer complaints
directly.


GRAPH NO: 9

                                        34
INFERENCE:

From the above analyses it shows that retailers resolve the customer complaints directly.
And in order to resolve the customer complaints at a much faster rate retailer must be
provided with proper training and necessary skills to handle customer issues.


TABLE NO: 10

                                           35
Opinion of retailers about the duration taken to assess customer
complaints


                                    Hours        Days               Week            Total
            TIME TAKEN

PARTICULARS                   NOR     %Age       NOR    %Age   NOR    %Age     NOR    %Age

a. Handsets
                               09       38        13     26    18      36      50      100

b. Sim activations
                               14       28        28     56     4      8       50      100

c. Recharges
                               44       88        6      12     -          -   50      100


NOTE: NOR =No of respondents


ANALYSIS:

From the above table it can be observed that,
38% retailers say it takes hours together to repair or resolve complaints w.r.t to handsets
and 26% say it take days to rectify the issue.
14% say it takes hours for sim activations and 56% say it takes days for sim activation.
88% say it takes hours to recharge and 12% say it takes days for recharges to be done.


GRAPH NO: 10


                                             36
Graph showing Opinion of retailers about the duration taken to assess
customer complaints


INFERENCE:

From the above analyses it can be observed that more time was taken to
rectify issues like handset repairs, days together for sim activations while
recharges took less time


TABLE NO: 11


                                    37
Promotional activities provided by distributor to sell the product


        PARTICULARS                       NO OF                  (%)PERCENTAGE
                                       RESPONDENTS
         Advertisements                     10                             20
            Brochures                           20                         40
        Posters/Displays                        12                         24
             Others                             08                         16
             TOTAL                              50                        100


ANALYSIS:

From the above table it can be observed that, 40% of respondents find brochures were
provided by distributor to sell the product, 24% say posters and displays were provided ,
20% say advertisement were provided and 16% say other promotional support were
provided to sell the products.


GRAPH NO: 11


                                           38
INFERENCE:

From the above analyses it is clear that broachers, posters/displays are the most effective
promotion activities provided by the distributors. And other promotional activities like
stickers, catalogues are provided by distributor to sell the products which were not much
effective.


TABLE NO: 12


Opinion about the service provided by Royal Tech Distributor.

                                            39
OPINIONS                                                 Need to
                        Excellent          Good      Average                         Total
                                                                  improve
                       NOR   %Age    NOR     %Age   NOR   %Age   NOR   %Age    NOR     %Age
PARTICULARS
a. Speed of
Service                 12     24     21      42    10     20     7      14     50      100

b. Product
knowledge               9      18     18      36    13     26     10     20     50      100

c. Willingness to
help                    4      8      16      32    24     48     6      12     50      100

d. After sales
                        14     28     26      52     6     12     4      8      50      100
service

NOTE: NOR =No of respondents


ANALYSIS:

From the above table it can be observed that:
42% respondents say that speed service provided was good, 14% say it needs to improve.
36% respondents agree product knowledge of distributor is good and 20% agree it needs
to be improved.
48% of respondents say that willingness to help of distributor was average and 8% say its
excellent.
52% of respondents say after sales service of distributor is good and 8% say it needs to be
improved .


GRAPH NO: 12

                                             40
Graph showing opinion of retailers about the service provided by Royal
Tech Distributor.


INFERENCE:

From the above survey it is clear that speed of service provided is good and product
knowledge provided by distributor is good but as we can see the support provided by
distributor needs improvement and after sales service is excellent. Hence we can
conclude that service provided by Royal Tech Distributor is good.


TABLE NO: 13


                                          41
Table showing the retailer satisfaction with the profit margin provided
by the distributors


   PARTICULARS             NO OF RESPONDENTS                  (%)PERCENTAGE


           Yes                         34                              68

           No                          16                              32

        TOTAL                          50                              100


ANALYSIS:

From the above table it can be observed that, 68% are satisfied with the profit margin
provided by the distributor and 32% are not satisfied with the profit margin provided by
the distributor.


GRAPH NO: 13


                                            42
INFERENCE:

From the survey it is clear that profit margin given to retailers on easy recharges, sim
activations, handset selling are provided within the time period and retailers are satisfied
with the profit margin provided.


TABLE NO: 14


                                             43
Table showing Comparison of Royal Tech distributors with other
distributors


     RATINGS                                                       Need to
                        Excellent         Good      Average                         Total
                                                                  improve
                       NOR   %Age    NOR    %Age   NOR   %Age   NOR   %Age     NOR    %Age
PARTICULARS
a. Advertisement
                       07     14     14      28    16     32     13     26     50      100
b. Promotion
                       08     16     18      36    14     28     10     20     50      100
c. Credit
                       11     22     14      28    13     26     12     24     50      100

d. Claims              02     04     12      24    25     50     11     22     50      100
e. Offers/Gifts        07     14     16      32    19     38     8      16     50      100

NOTE: NOR =No of respondents


ANALYSIS:

From the above table it can be observed that, 32% say advertisements provided by
distributor were average when compared to other distributors and 14% say it was
excellent.
36% say promotions provided by distributor were good and 16% say it was excellent.
28% say credits provided by distributor were good and 22% say it was excellent.
50% say claims were settled at a average rate and 04 % say it was excellent.
38% say offers/gifts provided were average and 14% say it was excellent.


                                            44
GRAPH NO: 14


Graph showing the comparison of Royal Tech Distributor from other
distributors.


INFERENCE:

 From the survey we can conclude that advertisements provided by distributor were
average when compared to other distributor and promotion were good .credit provided by
distributor were average when compared to other distributor and claims were settled at a
slower rate. Offers/gifts provided to retailers’ were average when compared to other
distributors.


                                          45
TABLE NO: 15


Table showing retailers opinion about frequency of direct sales
representatives (DSR) visits to retail shops


      PARTICULARS                  NO OF RESPONDENTS               (%)PERCENTAGE

             YES                                31                         62

             NO                                 19                         38

            Total                               50                        100


ANALYSIS:

From the above table it can be observed that, 62% agree that DSR visits their shops
regularly and 38% say DSR does not visits their shops regularly.


GRAPH NO: 15
                                           46
INFERENCE:

From the above graph it is clear that DSR visits to retail outlets frequently.


TABLE NO: 16
                                             47
Table showing DSR Visit to retailers per week:


    PARTICULARS               NO OF RESPONDENTS                (%)PERCENTAGE
         0-1 times                         7                            14
         1-2 times                        12                            24
         2-3 times                         9                            18
         3-4 times                         6                            12
         4-5 times                        14                            28
         5-7 times                         2                             4
         TOTAL                            50                           100


ANALYSIS:

From the above table it can be observed that, 14% of shops are visited by DSR 0-1 times
in a week, 24% of shops are visited 1-2 times in a week, 18% of shops are visited 2-3
times in week, 12% of shops are visited 3-4 times in week 28% of shops are visited 4-5
times in week and 4% of shops are visited 5-7 times in week.


                                          48
GRAPH NO: 16


INFERENCE:

From the above graph it is clear that frequency of DSR visits to a shop in a week is 4-5
times. This indicates only few shops are visited on a regular basis.


TABLE NO: 17
                                            49
Table showing Experience of retailer when interacted with Direct Sales
Executive (DSR).


       RATINGS                                                        Need to
                          Excellent          Good       Average                       Total
                                                                     improve
                        NOR   %Age     NOR     %Age    NOR   %Age   NOR   %Age   NOR    %Age
PARTICULARS
a.
Courteous/polite         14     28      16        32   11     22     9     18    50      100

b. Listening skills
                          8     16      14        28   12     24    16     32    50      100
c. Product
knowledge                10     20      13        26   18     36     9     18    50      100

d. Willingness to
                          6     12      14        28   20     40    10     20    50      100
help
e. Speed of service      11     22      18        36    9     18    12     24    50      100

NOTE: NOR =No of respondents


ANALYSIS:

From the above table it can be observed that, 32% say DSR were polite and courteous
with retailers and 18% say they should improve.
32% say listings skills of DSR needs to be improved and 16% say it’s excellent
36% say DSR have average level of information about product and 18% say it should be
improved.
40% say DSR willingness to help to retailers is average and 12% say it’s excellent
36% say DSR speed of service was good and 18% say its average.


                                             50
GRAPH NO: 17


Graph showing retailers experience when interacted with Direct Sales
Representatives (DSR)


INFERENCE:

From the above graph it is clear that DSR are courteous and polite with retailers.
Listing skills of DSR is poor and need to be improved, product knowledge is average.
The willingness of DSR to sort out retailer’s problem is average. And speed of service
provided by DSR to retailers is good.


                                        CHAPTER -4

                                            51
SUMMARY OF FINDINGS


•   From the analyzed data it is clear that 36% of respondents who were doing
    retailing business were people of young and middle age group. This shows that
    there is a huge potential for this category of people to carry out retailing business
    and no of retail shops were increased by 40% in the past one year due to the
    launch of reliance GSM service
•   Majority of male are doing retailing business and female doing the retailing
    business are very few.
•   It was observed from analyzed data that product were available to retailers
    through distributors on time. Customer complaints were handled by both retailers
    and distributors
•   50% of retailers had a good response towards the response provided by reliance
    communication
•   68% of retailers were satisfied with the profit margin provided to them
•   From the above analyses it was observed that more time was taken to rectify
    issues like handset repairs, days together for sim activations while recharges took
    less time
•   When royal tech distributor was compared to other distributor 32% of respondents
    said that advertisements were not effective and 50 % said that claims were not
    settled soon
•   40% retailers had a good opinion that promotional support provided to them was
    not effective.
•   Retailers had a good opinion towards DSR for the service provided.62% of
    retailers had a opinion that DSR visited their shops frequently. It was observed
    from the analyses that DSR were courteous and polite with retailers but listening
    skills and product knowledge was average.


                                CHAPTER -5

                                         52
SUGGESTIONS AND CONCLUSION

SUGGESTIONS:

       From the analysis it is clear that the distributors need to maintain stock of CDMA
handsets, CDMA and GSM currencies and recharge coupons as there is a shortage of
supply in some retail outlets and another frequent complaints which is seen among the
retailers is about the settlement of claims, measures must be taken to resolve it soon. As
there were many retailers who are were into CDMA business and now have also taken up
new Reliance GSM, confusion is created for the recharge technique of CDMA and GSM,
to overcome this they should be provided with retailers help desk number.


       DSR (Distributor Sales Representative) forms a bridge between distributors and
the retailers, therefore it is very essential for Royal Tech to train the DSR’s so that they
will be able resolve the retailer’s problems and thereby need not approach channel
manager or distributor manager. The channel Manager should have regular visits to all
categories of retailers and randomly check the performance of the DSR’s.


       To increase the sales of GSM, company should provide electronics displays in
selected retail shops so as to attract the customers and advertisements about these retail
outlets in newspapers so that they can overcome the standard promotion way of only
posters and banners.


       Reliance GSM need to motivate the retailers by giving them incentives, trophies
of achievements to retailers for achieving the target and boosting the sales. This forms a
way of motivation for the retailer to concentrate on further increase of sales.
The company needs to train the retailers about the product and its offers so that they will
be in a position to handle the customer complaints directly and need not approach the
distributor frequently.


                                             53
CONCLUSIONS:

        Success of an organization largely depends mainly on its marketing abilities. For
this, a marketer should know the needs, requirements and preferences of target market.
The marketer should make a detailed study of the expectations of the retailers and then
take necessary steps to fulfill the needs of the retailer. As it is the retailers who interacts
with the end customers it is necessary to identify the requirements of retailer and to fulfill
those needs to do this work the channel effectiveness should be determined in the role of
service delivery. The main motive for conducting this survey was to identify the channel
effectiveness in service delivery of distributor for reliance communication.


        The report was an endeavour to determine how effective are the distributor was in
delivery of service for the retailers. The study was successful in understanding the
distribution channel of reliance communication and how the products reach to ultimate
consumer .The flow of products through different intermediaries in the channel and role
played by them in delivery of products to consumers.


        The analysis helped to identify the satisfaction level of retailers for the service
provided by the distributors and impact of this on ultimate customers. And to identify
different promotional support provided by the company and to differentiate the
distributors according to their performances. It was useful to understand the role of
representatives in service delivery to retailers.


        The study is confined only to East of Bangalore and the retailers of Royal Tech
and from the survey it was clear that overall performance of Royal Tech is good and the
retailers were satisfied.


                                              54

Más contenido relacionado

La actualidad más candente

Telecom ppt 1st part
Telecom ppt 1st partTelecom ppt 1st part
Telecom ppt 1st partWEBD2012
 
Telecom industry analysis
Telecom industry analysisTelecom industry analysis
Telecom industry analysisHeemanish Midde
 
Telecom sector in india
Telecom sector in indiaTelecom sector in india
Telecom sector in indiaAkash Rangari
 
Telecommunication in India
Telecommunication in IndiaTelecommunication in India
Telecommunication in IndiaAkshat Goel
 
Telecom Sector of India
Telecom Sector of IndiaTelecom Sector of India
Telecom Sector of IndiaShubham Bathe
 
Indian telecom industry
Indian telecom industryIndian telecom industry
Indian telecom industrySaurabh Tiwari
 
Telecom Sector Study
Telecom Sector StudyTelecom Sector Study
Telecom Sector Studymails2yamini
 
Rural telecommunication in India
Rural telecommunication in IndiaRural telecommunication in India
Rural telecommunication in IndiaPradeep Yadav
 
PESTLE ANALYSIS ON TELECOM
PESTLE ANALYSIS ON TELECOMPESTLE ANALYSIS ON TELECOM
PESTLE ANALYSIS ON TELECOMBidhan Pradhan
 
Environmental Analysis of Telecom Company
Environmental Analysis of Telecom CompanyEnvironmental Analysis of Telecom Company
Environmental Analysis of Telecom CompanyShubham Khedekar
 
The Price War of Telecommunication Giants in India
The Price War of Telecommunication Giants in IndiaThe Price War of Telecommunication Giants in India
The Price War of Telecommunication Giants in IndiaSubham Chauhan
 
Telecom industry updated
Telecom industry updatedTelecom industry updated
Telecom industry updatedSagar Das
 

La actualidad más candente (20)

Major players in telecom industry
Major players in telecom industryMajor players in telecom industry
Major players in telecom industry
 
Telecom ppt 1st part
Telecom ppt 1st partTelecom ppt 1st part
Telecom ppt 1st part
 
Telecom ppt
Telecom pptTelecom ppt
Telecom ppt
 
Telecom industry analysis
Telecom industry analysisTelecom industry analysis
Telecom industry analysis
 
Presentation on telecom industry in india
Presentation on  telecom industry in india Presentation on  telecom industry in india
Presentation on telecom industry in india
 
Telecom sector in india
Telecom sector in indiaTelecom sector in india
Telecom sector in india
 
Telecommunication in India
Telecommunication in IndiaTelecommunication in India
Telecommunication in India
 
Telecommunications Sector Report - January 2019
Telecommunications Sector Report - January 2019Telecommunications Sector Report - January 2019
Telecommunications Sector Report - January 2019
 
Telecom Sector of India
Telecom Sector of IndiaTelecom Sector of India
Telecom Sector of India
 
Indian telecom industry
Indian telecom industryIndian telecom industry
Indian telecom industry
 
Telecom Industry
Telecom IndustryTelecom Industry
Telecom Industry
 
Telecom Sector Study
Telecom Sector StudyTelecom Sector Study
Telecom Sector Study
 
Telecom Industry in India
Telecom Industry in IndiaTelecom Industry in India
Telecom Industry in India
 
Rural telecommunication in India
Rural telecommunication in IndiaRural telecommunication in India
Rural telecommunication in India
 
PESTLE ANALYSIS ON TELECOM
PESTLE ANALYSIS ON TELECOMPESTLE ANALYSIS ON TELECOM
PESTLE ANALYSIS ON TELECOM
 
Telecom sector
Telecom sectorTelecom sector
Telecom sector
 
Telecom Sector
Telecom SectorTelecom Sector
Telecom Sector
 
Environmental Analysis of Telecom Company
Environmental Analysis of Telecom CompanyEnvironmental Analysis of Telecom Company
Environmental Analysis of Telecom Company
 
The Price War of Telecommunication Giants in India
The Price War of Telecommunication Giants in IndiaThe Price War of Telecommunication Giants in India
The Price War of Telecommunication Giants in India
 
Telecom industry updated
Telecom industry updatedTelecom industry updated
Telecom industry updated
 

Similar a Telecom Industry Growth in India

Cellular industry
Cellular industryCellular industry
Cellular industry915738
 
Copy of reliasnce jio 3
Copy of reliasnce jio 3Copy of reliasnce jio 3
Copy of reliasnce jio 3Nirali Nayi
 
The study on customer’s choices and preferences in terms of awareness and sat...
The study on customer’s choices and preferences in terms of awareness and sat...The study on customer’s choices and preferences in terms of awareness and sat...
The study on customer’s choices and preferences in terms of awareness and sat...Projects Kart
 
Impact of reliance jio on telecom sector
Impact of reliance jio on telecom sectorImpact of reliance jio on telecom sector
Impact of reliance jio on telecom sectorAdil Hussain
 
Indian Telecom Industry & role of HR in it, With emphasis on Airtel
Indian Telecom Industry & role of HR in it, With emphasis on AirtelIndian Telecom Industry & role of HR in it, With emphasis on Airtel
Indian Telecom Industry & role of HR in it, With emphasis on Airtelmini244
 
STUDY OF CUSTOMER PREFERENCE TOWARDS AIRTEL
STUDY OF CUSTOMER PREFERENCE TOWARDS AIRTELSTUDY OF CUSTOMER PREFERENCE TOWARDS AIRTEL
STUDY OF CUSTOMER PREFERENCE TOWARDS AIRTELAshish Gupta
 
Customer satisfaction among b2 b customers of relience communication in tamil...
Customer satisfaction among b2 b customers of relience communication in tamil...Customer satisfaction among b2 b customers of relience communication in tamil...
Customer satisfaction among b2 b customers of relience communication in tamil...Mohan Suyamburaj
 
Exploring Rural Telecom Opportunity
Exploring Rural Telecom OpportunityExploring Rural Telecom Opportunity
Exploring Rural Telecom Opportunityguest650d42c
 
A project report on Jio
A project report on JioA project report on Jio
A project report on JioBhavik Parmar
 
Peter Bouchard on Telecomm
Peter Bouchard on TelecommPeter Bouchard on Telecomm
Peter Bouchard on TelecommPeter Bouchard
 
Peter Bouchard Maine - Telecommunication
Peter Bouchard Maine - TelecommunicationPeter Bouchard Maine - Telecommunication
Peter Bouchard Maine - TelecommunicationPeter Bouchard Maine
 
Comparative study of telecom sector
Comparative study of telecom sectorComparative study of telecom sector
Comparative study of telecom sectorNirankar Royal
 
Report on telecom sector
Report on telecom sectorReport on telecom sector
Report on telecom sectorsumanmalviya
 
Report on telecom sector
Report on telecom sectorReport on telecom sector
Report on telecom sectorsumanmalviya
 
Telecom industry in INDIA
Telecom industry in INDIATelecom industry in INDIA
Telecom industry in INDIAMihir Patel
 
Effect of Reliance Jio Promotion activites on Customers.pdf
Effect of Reliance Jio Promotion activites on Customers.pdfEffect of Reliance Jio Promotion activites on Customers.pdf
Effect of Reliance Jio Promotion activites on Customers.pdfNitesh Kumar Mishra
 

Similar a Telecom Industry Growth in India (20)

Cellular industry
Cellular industryCellular industry
Cellular industry
 
Copy of reliasnce jio 3
Copy of reliasnce jio 3Copy of reliasnce jio 3
Copy of reliasnce jio 3
 
The study on customer’s choices and preferences in terms of awareness and sat...
The study on customer’s choices and preferences in terms of awareness and sat...The study on customer’s choices and preferences in terms of awareness and sat...
The study on customer’s choices and preferences in terms of awareness and sat...
 
Telecom industry
Telecom industryTelecom industry
Telecom industry
 
Reliasnce jio 3
Reliasnce jio 3Reliasnce jio 3
Reliasnce jio 3
 
Impact of reliance jio on telecom sector
Impact of reliance jio on telecom sectorImpact of reliance jio on telecom sector
Impact of reliance jio on telecom sector
 
Introduction
IntroductionIntroduction
Introduction
 
Indian Telecom Industry & role of HR in it, With emphasis on Airtel
Indian Telecom Industry & role of HR in it, With emphasis on AirtelIndian Telecom Industry & role of HR in it, With emphasis on Airtel
Indian Telecom Industry & role of HR in it, With emphasis on Airtel
 
STUDY OF CUSTOMER PREFERENCE TOWARDS AIRTEL
STUDY OF CUSTOMER PREFERENCE TOWARDS AIRTELSTUDY OF CUSTOMER PREFERENCE TOWARDS AIRTEL
STUDY OF CUSTOMER PREFERENCE TOWARDS AIRTEL
 
Customer satisfaction among b2 b customers of relience communication in tamil...
Customer satisfaction among b2 b customers of relience communication in tamil...Customer satisfaction among b2 b customers of relience communication in tamil...
Customer satisfaction among b2 b customers of relience communication in tamil...
 
Exploring Rural Telecom Opportunity
Exploring Rural Telecom OpportunityExploring Rural Telecom Opportunity
Exploring Rural Telecom Opportunity
 
A project report on Jio
A project report on JioA project report on Jio
A project report on Jio
 
Peter Bouchard on Telecomm
Peter Bouchard on TelecommPeter Bouchard on Telecomm
Peter Bouchard on Telecomm
 
Peter Bouchard Maine - Telecommunication
Peter Bouchard Maine - TelecommunicationPeter Bouchard Maine - Telecommunication
Peter Bouchard Maine - Telecommunication
 
Comparative study of telecom sector
Comparative study of telecom sectorComparative study of telecom sector
Comparative study of telecom sector
 
Report on telecom sector
Report on telecom sectorReport on telecom sector
Report on telecom sector
 
Report on telecom sector
Report on telecom sectorReport on telecom sector
Report on telecom sector
 
Telecom industry in INDIA
Telecom industry in INDIATelecom industry in INDIA
Telecom industry in INDIA
 
Effect of Reliance Jio Promotion activites on Customers.pdf
Effect of Reliance Jio Promotion activites on Customers.pdfEffect of Reliance Jio Promotion activites on Customers.pdf
Effect of Reliance Jio Promotion activites on Customers.pdf
 
Airtel
AirtelAirtel
Airtel
 

Último

Event mailer assignment progress report .pdf
Event mailer assignment progress report .pdfEvent mailer assignment progress report .pdf
Event mailer assignment progress report .pdftbatkhuu1
 
Call Girls Navi Mumbai Just Call 9907093804 Top Class Call Girl Service Avail...
Call Girls Navi Mumbai Just Call 9907093804 Top Class Call Girl Service Avail...Call Girls Navi Mumbai Just Call 9907093804 Top Class Call Girl Service Avail...
Call Girls Navi Mumbai Just Call 9907093804 Top Class Call Girl Service Avail...Dipal Arora
 
Tech Startup Growth Hacking 101 - Basics on Growth Marketing
Tech Startup Growth Hacking 101  - Basics on Growth MarketingTech Startup Growth Hacking 101  - Basics on Growth Marketing
Tech Startup Growth Hacking 101 - Basics on Growth MarketingShawn Pang
 
Boost the utilization of your HCL environment by reevaluating use cases and f...
Boost the utilization of your HCL environment by reevaluating use cases and f...Boost the utilization of your HCL environment by reevaluating use cases and f...
Boost the utilization of your HCL environment by reevaluating use cases and f...Roland Driesen
 
Best VIP Call Girls Noida Sector 40 Call Me: 8448380779
Best VIP Call Girls Noida Sector 40 Call Me: 8448380779Best VIP Call Girls Noida Sector 40 Call Me: 8448380779
Best VIP Call Girls Noida Sector 40 Call Me: 8448380779Delhi Call girls
 
Regression analysis: Simple Linear Regression Multiple Linear Regression
Regression analysis:  Simple Linear Regression Multiple Linear RegressionRegression analysis:  Simple Linear Regression Multiple Linear Regression
Regression analysis: Simple Linear Regression Multiple Linear RegressionRavindra Nath Shukla
 
Grateful 7 speech thanking everyone that has helped.pdf
Grateful 7 speech thanking everyone that has helped.pdfGrateful 7 speech thanking everyone that has helped.pdf
Grateful 7 speech thanking everyone that has helped.pdfPaul Menig
 
MONA 98765-12871 CALL GIRLS IN LUDHIANA LUDHIANA CALL GIRL
MONA 98765-12871 CALL GIRLS IN LUDHIANA LUDHIANA CALL GIRLMONA 98765-12871 CALL GIRLS IN LUDHIANA LUDHIANA CALL GIRL
MONA 98765-12871 CALL GIRLS IN LUDHIANA LUDHIANA CALL GIRLSeo
 
Cash Payment 9602870969 Escort Service in Udaipur Call Girls
Cash Payment 9602870969 Escort Service in Udaipur Call GirlsCash Payment 9602870969 Escort Service in Udaipur Call Girls
Cash Payment 9602870969 Escort Service in Udaipur Call GirlsApsara Of India
 
Creating Low-Code Loan Applications using the Trisotech Mortgage Feature Set
Creating Low-Code Loan Applications using the Trisotech Mortgage Feature SetCreating Low-Code Loan Applications using the Trisotech Mortgage Feature Set
Creating Low-Code Loan Applications using the Trisotech Mortgage Feature SetDenis Gagné
 
Call Girls In Panjim North Goa 9971646499 Genuine Service
Call Girls In Panjim North Goa 9971646499 Genuine ServiceCall Girls In Panjim North Goa 9971646499 Genuine Service
Call Girls In Panjim North Goa 9971646499 Genuine Serviceritikaroy0888
 
Best Basmati Rice Manufacturers in India
Best Basmati Rice Manufacturers in IndiaBest Basmati Rice Manufacturers in India
Best Basmati Rice Manufacturers in IndiaShree Krishna Exports
 
Enhancing and Restoring Safety & Quality Cultures - Dave Litwiller - May 2024...
Enhancing and Restoring Safety & Quality Cultures - Dave Litwiller - May 2024...Enhancing and Restoring Safety & Quality Cultures - Dave Litwiller - May 2024...
Enhancing and Restoring Safety & Quality Cultures - Dave Litwiller - May 2024...Dave Litwiller
 
Call Girls Pune Just Call 9907093804 Top Class Call Girl Service Available
Call Girls Pune Just Call 9907093804 Top Class Call Girl Service AvailableCall Girls Pune Just Call 9907093804 Top Class Call Girl Service Available
Call Girls Pune Just Call 9907093804 Top Class Call Girl Service AvailableDipal Arora
 
7.pdf This presentation captures many uses and the significance of the number...
7.pdf This presentation captures many uses and the significance of the number...7.pdf This presentation captures many uses and the significance of the number...
7.pdf This presentation captures many uses and the significance of the number...Paul Menig
 
Mondelez State of Snacking and Future Trends 2023
Mondelez State of Snacking and Future Trends 2023Mondelez State of Snacking and Future Trends 2023
Mondelez State of Snacking and Future Trends 2023Neil Kimberley
 
Call Girls in Gomti Nagar - 7388211116 - With room Service
Call Girls in Gomti Nagar - 7388211116  - With room ServiceCall Girls in Gomti Nagar - 7388211116  - With room Service
Call Girls in Gomti Nagar - 7388211116 - With room Servicediscovermytutordmt
 
Pharma Works Profile of Karan Communications
Pharma Works Profile of Karan CommunicationsPharma Works Profile of Karan Communications
Pharma Works Profile of Karan Communicationskarancommunications
 
The Coffee Bean & Tea Leaf(CBTL), Business strategy case study
The Coffee Bean & Tea Leaf(CBTL), Business strategy case studyThe Coffee Bean & Tea Leaf(CBTL), Business strategy case study
The Coffee Bean & Tea Leaf(CBTL), Business strategy case studyEthan lee
 

Último (20)

Event mailer assignment progress report .pdf
Event mailer assignment progress report .pdfEvent mailer assignment progress report .pdf
Event mailer assignment progress report .pdf
 
VVVIP Call Girls In Greater Kailash ➡️ Delhi ➡️ 9999965857 🚀 No Advance 24HRS...
VVVIP Call Girls In Greater Kailash ➡️ Delhi ➡️ 9999965857 🚀 No Advance 24HRS...VVVIP Call Girls In Greater Kailash ➡️ Delhi ➡️ 9999965857 🚀 No Advance 24HRS...
VVVIP Call Girls In Greater Kailash ➡️ Delhi ➡️ 9999965857 🚀 No Advance 24HRS...
 
Call Girls Navi Mumbai Just Call 9907093804 Top Class Call Girl Service Avail...
Call Girls Navi Mumbai Just Call 9907093804 Top Class Call Girl Service Avail...Call Girls Navi Mumbai Just Call 9907093804 Top Class Call Girl Service Avail...
Call Girls Navi Mumbai Just Call 9907093804 Top Class Call Girl Service Avail...
 
Tech Startup Growth Hacking 101 - Basics on Growth Marketing
Tech Startup Growth Hacking 101  - Basics on Growth MarketingTech Startup Growth Hacking 101  - Basics on Growth Marketing
Tech Startup Growth Hacking 101 - Basics on Growth Marketing
 
Boost the utilization of your HCL environment by reevaluating use cases and f...
Boost the utilization of your HCL environment by reevaluating use cases and f...Boost the utilization of your HCL environment by reevaluating use cases and f...
Boost the utilization of your HCL environment by reevaluating use cases and f...
 
Best VIP Call Girls Noida Sector 40 Call Me: 8448380779
Best VIP Call Girls Noida Sector 40 Call Me: 8448380779Best VIP Call Girls Noida Sector 40 Call Me: 8448380779
Best VIP Call Girls Noida Sector 40 Call Me: 8448380779
 
Regression analysis: Simple Linear Regression Multiple Linear Regression
Regression analysis:  Simple Linear Regression Multiple Linear RegressionRegression analysis:  Simple Linear Regression Multiple Linear Regression
Regression analysis: Simple Linear Regression Multiple Linear Regression
 
Grateful 7 speech thanking everyone that has helped.pdf
Grateful 7 speech thanking everyone that has helped.pdfGrateful 7 speech thanking everyone that has helped.pdf
Grateful 7 speech thanking everyone that has helped.pdf
 
MONA 98765-12871 CALL GIRLS IN LUDHIANA LUDHIANA CALL GIRL
MONA 98765-12871 CALL GIRLS IN LUDHIANA LUDHIANA CALL GIRLMONA 98765-12871 CALL GIRLS IN LUDHIANA LUDHIANA CALL GIRL
MONA 98765-12871 CALL GIRLS IN LUDHIANA LUDHIANA CALL GIRL
 
Cash Payment 9602870969 Escort Service in Udaipur Call Girls
Cash Payment 9602870969 Escort Service in Udaipur Call GirlsCash Payment 9602870969 Escort Service in Udaipur Call Girls
Cash Payment 9602870969 Escort Service in Udaipur Call Girls
 
Creating Low-Code Loan Applications using the Trisotech Mortgage Feature Set
Creating Low-Code Loan Applications using the Trisotech Mortgage Feature SetCreating Low-Code Loan Applications using the Trisotech Mortgage Feature Set
Creating Low-Code Loan Applications using the Trisotech Mortgage Feature Set
 
Call Girls In Panjim North Goa 9971646499 Genuine Service
Call Girls In Panjim North Goa 9971646499 Genuine ServiceCall Girls In Panjim North Goa 9971646499 Genuine Service
Call Girls In Panjim North Goa 9971646499 Genuine Service
 
Best Basmati Rice Manufacturers in India
Best Basmati Rice Manufacturers in IndiaBest Basmati Rice Manufacturers in India
Best Basmati Rice Manufacturers in India
 
Enhancing and Restoring Safety & Quality Cultures - Dave Litwiller - May 2024...
Enhancing and Restoring Safety & Quality Cultures - Dave Litwiller - May 2024...Enhancing and Restoring Safety & Quality Cultures - Dave Litwiller - May 2024...
Enhancing and Restoring Safety & Quality Cultures - Dave Litwiller - May 2024...
 
Call Girls Pune Just Call 9907093804 Top Class Call Girl Service Available
Call Girls Pune Just Call 9907093804 Top Class Call Girl Service AvailableCall Girls Pune Just Call 9907093804 Top Class Call Girl Service Available
Call Girls Pune Just Call 9907093804 Top Class Call Girl Service Available
 
7.pdf This presentation captures many uses and the significance of the number...
7.pdf This presentation captures many uses and the significance of the number...7.pdf This presentation captures many uses and the significance of the number...
7.pdf This presentation captures many uses and the significance of the number...
 
Mondelez State of Snacking and Future Trends 2023
Mondelez State of Snacking and Future Trends 2023Mondelez State of Snacking and Future Trends 2023
Mondelez State of Snacking and Future Trends 2023
 
Call Girls in Gomti Nagar - 7388211116 - With room Service
Call Girls in Gomti Nagar - 7388211116  - With room ServiceCall Girls in Gomti Nagar - 7388211116  - With room Service
Call Girls in Gomti Nagar - 7388211116 - With room Service
 
Pharma Works Profile of Karan Communications
Pharma Works Profile of Karan CommunicationsPharma Works Profile of Karan Communications
Pharma Works Profile of Karan Communications
 
The Coffee Bean & Tea Leaf(CBTL), Business strategy case study
The Coffee Bean & Tea Leaf(CBTL), Business strategy case studyThe Coffee Bean & Tea Leaf(CBTL), Business strategy case study
The Coffee Bean & Tea Leaf(CBTL), Business strategy case study
 

Telecom Industry Growth in India

  • 1. CHAPTER -1 INTRODUCTION 1.1 INDUSTRY PROFILE Telecommunication is the assisted transmission of signals over a distance for the purpose of communication. Major factors responsible for the growth of telecommunications industry are use of modern technology and market competition. One of the products of modern technologies is optical fibers, which are being used as a medium of data transmission instead of using coaxial or twisted pair cables. Optical fibers can carry a high volume of data and are easier to maintain and install. Use of communication satellites makes this telecommunications industry a booming industry. Telecommunications industry is going to be a digitized one. Use of ISDN (Inter Services Digital Network) makes this telecommunication industry a total digitalized system and eventually enhanced the speed and quality of digital communication The telecom industry is one of the fastest growing industries in India. India has nearly 200 million telephone lines making it the third largest network in the world after China and USA. With a growth rate of 45%, Indian telecom industry has the highest growth rate in the world. Starting from telegraphic and telephonic systems in the 19th century, the field of telephonic communication has now expanded to make use of advanced technologies like GSM, CDMA, and WLL to the great 3G Technology in mobile phones. Day by day, both the public players and the private players are putting in their resources and efforts to improve the telecommunication technology so as to give the maximum to their customers. - Much of the growth in Asia Pacific Wireless Telecommunication Market is spurred by the growth in demand in countries like India and China. - India‘s mobile phone subscriber base is growing at a rate of 82.2%. - China is the biggest market in Asia Pacific with a subscriber base of 48% of the total subscribers in Asia Pacific. Compared to that India’s share in Asia Pacific Mobile Phone market is 6.4%. Though the telecom sector in India has experienced a faster rate of growth, still it suffers from the problem of complex tax structure. Presently the sector suffers from the problem of 12% service tax, 6-10% license fee, 2-6 % spectrum charges, 1.5% asset 1
  • 2. deficit charges, and 2% education cess. A single tax system should be introduced for making the tax system investor friendly. HISTORY India is the fourth largest telecom market in Asia after China, Japan and South Korea. The Indian telecom network is the eighth largest in the world and the second largest among emerging economies. The industry has witnessed an explosive growth in recent years. Teledensity has more than doubled from 2.3 per cent in 1999 to 4.8 per cent in 2002. However, the world average is almost 7.5 times and the Asian average 4.5 times the Indian average. The Indian telecom market size of over US $ 8 billion is expected to increase three fold by 2012. The expansion of the telecom industry in India has been fuelled by a massive growth in mobile phone users, which has reached a level of 10 million users in December 2002, an increase of nearly 100 per cent in 2002. This exponential growth of mobile telephony can be attributed to the introduction of digital cellular technology and decrease in tariffs due to competitive pressures. For the first time in India, the growth of cellular subscriber base has exceeded the fixed line subscriber base. However, cellular penetration is still 1 per cent as compared to world average of around 16 per cent. Cellular subscriber base is projected to grow at a CAGR (Compounded Annual Growth Rate) of 48 per cent to exceed 45 million in 2007 and at 30 per cent to 88 million in 2012. History of Indian Telecommunications started in 1851 when the first operational land lines were laid by the government near Calcutta (seat of British power). Telephone services were introduced in India in 1881. In 1883 telephone services were merged with the postal system. Indian Radio Telegraph Company (IRT) was formed in 1923. After independence in 1947, all the foreign telecommunication companies were nationalized to form the Posts, Telephone and Telegraph (PTT), a monopoly run by the government's Ministry of 2
  • 3. Communications. Telecom sector was considered as a strategic service and the government considered it best to bring under state's Control. The first wind of reforms in telecommunications sector began to flow in 1980s when the private sector was allowed in telecommunications equipment manufacturing. In 1985, Department of Telecommunications (DOT) was established. It was an exclusive provider of domestic and long-distance service that would be its own regulator (separate from the postal system). In 1986, two wholly government- owned companies were created: the Videsh Sanchar Nigam Limited (VSNL) for international telecommunications and Mahanagar Telephone Nigam Limited (MTNL) for services in metropolitan areas. In 1990s, telecommunications sector benefited from the general opening up of the economy. Also, examples of telecom revolution in many other countries, which resulted in better quality of service and lower tariffs, led Indian policy makers to initiate a change process finally resulting in opening up of telecom services sector for the private sector. In 1997, Telecom Regulatory Authority of India (TRAI) was created. TRAI was formed to act as a regulator to facilitate the growth of the telecom sector. New National Telecom Policy was adopted in 1999 and cellular services were also launched in the same year. Telecommunication sector in India can be divided into two segments: Fixed Service Provider (FSPs), and Cellular Services. Fixed line services consist of basic services, national or domestic long distance and international long distance services. The state operators (BSNL and MTNL), account for almost 90 per cent of revenues from basic services. Private sector services are presently available in selective urban areas, and collectively account for less than 5 per cent of subscriptions. However, private services focus on the business/corporate sector, and offer reliable, high- end services, such as leased lines, ISDN, closed user group and videoconferencing. Cellular services can be further divided into two categories: Global System for Mobile Communications (GSM) and Code Division Multiple Access (CDMA). The GSM sector is dominated by Airtel, Vodafone-Hutch, and Idea Cellular, while the CDMA sector is dominated by Reliance and Tata Indicom. 3
  • 4. MAJOR SERVICE PROVIDERS IN INDIA. Two different technologies are deployed by the mobile operators in India namely GSM and CDMA.The GSM service providers are Bharthi, BSNL, Hutch, IDEA, Aircel, Reliance, Spice, MTNL and BPL, whereas the CDMA service providers are TATA, and Reliance. Market Share of the Telecom Company in India GROWTH AND DEVELOPMENT OF THE INDUSTRY Telecommunications is a mature industry that has been globally available for some time. Growth of subscribers, traffic, and most importantly revenues, is by no means automatic. Entry costs for new users and tariffs must be continuously reduced to increase subscriber numbers and minutes of use. Infrastructure solutions that deliver lower cost coverage and more efficient capacity are critical to drive up service volumes and revenues. Competition is often already intense amongst the established player. 4
  • 5. Additionally, there is a steady stream of new operators and service providers who build up their service capabilities with the latest technology, hoping to create a major competitive advantage. Business Growth, Cost Efficiency and Evolution are therefore regarded as key drivers which can be addressed with wireless technology. The penetration of wireless services in developing regions and the ability to achieve reasonable speeds for wireless data has resulted in continued wireless services penetration and revenue growth, often at the expense of wireline services. The overall telecommunication services market is expected to grow profoundly in the coming years lead by wireless and high speed Internet services. Opening up of international and domestic long distance telephony services are the major growth drivers for cellular industry PRESENT STATUS OF THE INDUSTRY: Both fixed line and mobile segments serve the basic needs of local calls, long distance calls and the international calls, with the provision of broadband services in the fixed line segment and GPRS in the mobile arena. Mobile phone providers have also come up with GPRS-enabled multimedia messaging, Internet surfing, and mobile- commerce. The much-awaited 3G mobile technology is soon going to enter the Indian telecom market. The GSM, CDMA, WLL service providers are all upgrading themselves to provide3G mobile services. The value added services provided by the mobile service operators contribute more than 10% of the total revenue. Bharti Airtel has the largest customer base with 31% market share, followed by Hutch and BSNL with each holding 22% market share. The 2007 budget has brought further relief to the customers with the reduction in the tariffs, both local and long distance, and with slashing down the roaming rentals. This is likely to lead to even more people going for cellular services and more and more use of the value added services. However, landline telephony is likely to remain popular, too, in the foreseeable future. MTNL, the largest landline service provider, has recently taken some bold initiatives to retain its market share and, if possible, expand it. The reduction in tariffs for airtime, national long distance, international long distance, and handset prices has driven demand. 5
  • 6. FUTURE OF THE INDUSTRY: India initially started with GSM technology for mobile communication. Being a technology neutral country, India later allowed for CDMA technology also. Now 2.75G EDGE technologies has been implemented and used. BSNL has got license for bringing 3G into operation. Trials are being conducted for 3G implementation in the four metropolitan cities of India. Commercial 3G will be started by March 2007. With the dwindling revenues of the operators from the data and voice there is a need to look at newer applications to fuel growth of the telcos. TV on Mobile has emerged as a solid and potent answer to this consumer yearning. South Korea, China, South Africa, Australia and Europe have seen this need and have acted upon the same by implementing TV on Mobile. India is around the corner for implementation of similar technology for the benefit of consumers. 1.2 COMPANY PROFILE ORIGIN OF THE ORGANIZATION: The Late Dhirubhai Ambani dreamt of a digital India — an India where the common man would have access to affordable means of information and communication. Dhirubhai, who single-handedly built India’s largest private sector company virtually from scratch, had stated as early as 1999: “Make the tools of information and communication available to people at an affordable cost. They will overcome the handicaps of illiteracy and lack of mobility.” Reliance Communications has a reliable, high-capacity, integrated (both wireless and wireline) and convergent (voice, data and video) digital network. It is capable of delivering a range of services spanning the entire infocomm (information and communication) value chain, including infrastructure and services — for enterprises as well as individuals, applications, and consulting. Today, Reliance Communications is revolutionising the way India communicates and networks, truly bringing about a new way of life. 6
  • 7. INDIA’S LEADING TELECOM COMPANY Reliance Communications is the flagship company of the Anil Dhirubhai Ambani Group (ADAG) of companies. Listed on the National Stock Exchange and the Bombay Stock Exchange, it is India’s leading integrated telecommunication company with over 60 million customers. The business encompasses a complete range of telecom services covering mobile and fixed line telephony. It includes broadband, national and international long distance services and data services along with an exhaustive range of value-added services and applications. Our constant endeavor is to achieve customer delight by enhancing the productivity of the enterprises and individuals. RCOM is India’s largest integrated and fully converged communications service provider in the private sector, and has been rated among “Asia’s Top 5 Most Valuable Telecom Companies”. RCOM has a retail customer base of over 48 million as on 30th April, 2008 including over 1.5 million individual overseas retail customers. The corporate clientele includes 2,100 Indian and multinational corporations, and over 800 global, regional and domestic carriers. RCOM has established a pan-India, next generation, integrated (wireless and wireline), convergent (voice, data and video) digital network that is capable of supporting best-of- class services spanning the entire communications value chain, covering over 20,000 towns and 450,000 villages, and growing. RCOM owns and operates the world’s largest next generation IP enabled connectivity infrastructure, comprising over 175,000 kilometers of fiber optic cable systems in India, USA, Europe, Middle East and the Asia Pacific region VISION: “We will leverage our strengths to execute complex global—scale projects to facilitate leading-edge information and communication services affordable to all individual consumer and business in India. 7
  • 8. We will offer unparalleled value to create customer delighted and enhance business productivity. We will also generate value of our capabilities beyond Indian borders and enable millions of Indians knowledge workers to deliver their services globally.” VALUES • We will put customer first at all times, and built long term relationship with them. • We shall believe interpretation and keep every commitment that we make. • We will operate with honesty and integrity interpretation all our dealings. • We treat every individual with dignity and respect. • We will approach every endeavor with zeal & an attitude towards excellence. MISSION • To attain global best practices and become a world-class communication service provider – guided by its purpose to move towards greater degree of sophistication and maturity. • To work with vigour, dedication and innovation to achieve excellence in service, quality, reliability, safety and customer care as the ultimate goal. • To earn the trust and confidence of all stakeholders, exceeding their expectations and make the Company a respected household name. • To consistently achieve high growth with the highest levels of productivity. • To be a technology driven, efficient and financially sound organisation. • To contribute towards community development and nation building. • To be a responsible corporate citizen nurturing human values and concern for society, the environment and above all, the people. • To encourage ideas, talent and value systems. • To uphold the guiding principles of trust, integrity and transparency in all aspects of interactions and dealings. . 8
  • 9. OBJECTIVES: • Strengthens and Enhances Existing Business Roles • Drives greater empowerment, business focus, operational efficiencies and customer value. • Takes another significant steps towards institutionalization and building a conglomerate of the future AREAS OF OPERATIONS • Reliance communications • Reliance energy • Reliance mutual funds • Reliance life insurance • Reliance general insurance • Reliance port folio management COMPETITORS: Major competitors in today’s market are which gave a proper competition to the Reliance company in the communication sector are as follows: • IDEA • AIRTEL • TATA INDICOM • VODAFONE • BSNL 1.3 PRODUCT PROFILE 9
  • 10. Reliance Globalcom has an established reputation as a leading carrier's carrier. and are specialists in providing tailored connectivity solutions for the largest consumers of international communications capacity. We achieve this via a suite of flexible and high- performance managed bandwidth (SDH / SONET), Ethernet, IP and co-location services, which are available across four continents. PRODUCTS • GSM Services  Prepaid  Postpaid • Home Phones  Fixed line  Fixed Wireless • Internet & Broadband  Internet up to 8 mbps  Wi-Fi • Wireless Internet  Data Card  USB Modem • Reliance PCO • Reliance IPTV Reliance FLAG Suite of Services Reliance Globalcom provides a suite of Wholesale services under the "Reliance FLAG" brand. Reliance FLAG is the worlds largest private undersea cable system spanning 65,000 kms seamlessly integrated with Reliance Communications 1, 10,000 kms of domestic optic fiber provides a robust Global Service Delivery Platform connecting 37 key business markets in India, the Middle East, Asia, Europe, and the U.S. through an overlay low-latency, global MPLS-based IP network. The Services provided under Reliance FLAG are Global Ethernet, managed Bandwidth, Capacity Services, IP Transit, IPLC and VPN Service. CHAPTER -2 10
  • 11. RESEARCH DESIGN 2.1 THEOREITICAL BACKGROUND OF THE STUDY Marketing is defined by American marketing association “Marketing is the performance of business activities that direct the flow of goods and services from product to customers” Marketing management is a business discipline which is focused on the practical application of marketing techniques and the management of a firm's marketing resources and activities. Functions of marketing management: • Determination of marketing goals • Formulating marketing, plans, procedures, polices etc • Designing marketing strategies and marketing mix • Planning marketing programs Sales: A sale is the pinnacle activity involved in selling products or services in return for money or other compensation. It is an act of completion of a commercial activity Sales management: sales management is attainment of sales force goals in a effective & efficient manner through planning, staffing, training, leading & controlling organizational resources. Functions: The functions of sales management include planning, organizing and controlling of activities related to recruitment, selection, supervising, motivating and evaluating the performance of sales force. An important part of the function is to balance sales activities of the sales team that create short term results, together with building the business for the longer term future. Retailing: Retailing is the sale of goods and services to the ultimate consumers for personal family or household use. Thus retailing involves more than selling tangible products. Retailer is a person who links the producers and the ultimate consumers. Functions of retailing: 11
  • 12. 1. An assortment of merchandise appropriate to a particular market 2. Breaking of bulk so that small quantities can be sold 3. Holding of stock for instance availability at relatively stable prices 4. Causing the goods to move through the distribution system i.e. from manufactures to retailer to consumer 5. Credit and hire purchase facility 6. Product guarantee, after sale service and dealing with customer complaints Marketing channels - Marketing channels can be perceived as sets of interdependent organizations involved in the process of making product/services to the potential consumers Functions of marketing channel: 1. Satisfy demand by supplying goods and services at right place, quantity, quality and price 2. Stimulate demand through promotional activities of the units (eg. Retailers, manufactures representatives, sales officers, wholesales) 3. An organized network that creates value for end users by generation form, possession ,time and place utilities 4. Identifying customer requirements Marketing flow in channels: 12
  • 13. Physical Physical Physical distribution distribution distribution Possession Possession Possession ownership ownership ownership Promotion Promotion Promotion Producers Negotiation Wholesaler Negotiation Retailer Negotiation Consumers Financing Financing Financing Risking Risking Risking Ordering Ordering Ordering Payment Payment Payment 2. 2 TITLE OF THE STUDY “A study on channel effectiveness in service delivery of Royal Tech Distributor for Reliance Communications in Bangalore city” 2. 3.STATEMENT OF THE PROBLEM A problem well defined is half solved sometimes if we are able to define a problem we require an explanatory research to gather data about the real nature of the problem and tom suggest possible solution or new ideas. In case the clarity is there about the problem, descriptive or casual research is conducted to determine the cause and effect relationship. The study is conducted to determine to determine the effectiveness of Royal Tech Distributors in service delivery for Reliance Communications in Bangalore city. 2. 4.OBJECTIVES OF THE STUDY • To study channel effectiveness in service delivery of Royal Tech Distributor for Reliance Communications. • To understand the distribution channel of reliance communication. • To determine the satisfaction level of the retailers. • To know the promotional activities provided by the distributors. • To understand the role of DSR (Direct sales representatives) in service delivery. • To provide company with suitable suggestions to increase the service delivery. Data source 13
  • 14.  Primary data  Secondary data Primary data: this is first hand information collected from • Existing retailers • Future potential retailers The above said data was collected through different modes like • Observation method • Survey method • Interview method. Secondary data: is data collected from sources which contain data which have been collected and complied for another purpose. The secondary source of data consists of Companies database and companies journals Published records and reports Related websites of various organizations Research instruments: Since the present study was accomplished in a limited time, no sophisticated tools or statistical techniques could be used. However simple techniques like percentages, visual presentations like bar charts pie charts, line graphs were used Questionnaire: A Communication method which is selected as the instrument for collecting the data as the respondents are directly interviewed by the researcher. 2.5 SCOPE OF THE STUDY 14
  • 15. In the modern Telecommunication business world, to survive and to make costumer delight and satisfy is the most important factor which needs to be considered. Increasing the costumer base is a key factor. The study is the step towards ascertaining the service provided by reliance communication and other service providers. The mobile phone market is very competitive. The study was conducted in Reliance Communication to determine the channel effectiveness service delivery of Royal Tech Distributor and in order to acquire a larger customer base satisfying customer with their needs is the most important criteria. These functions are done through the retailers so it is foremost important to satisfy the retailers first to identify their needs and to fulfill them and to provide proper promotional tools for retailers to promote the product. 2.6 RESEARCH METHODOLOGY AND DATA COLLECTION The word research is derived from the Latin word meaning to know. It is a systematic and a replicable process, which identifies and defines problems, within specified boundaries. It employs well-designed method to collect the data and analyses the results. It disseminates the findings to contribute to generalize able knowledge. The characteristics of research presented below will be examined in greater details later are: • Systematic problem solving which identifies variables and tests relationships between them, • Collecting, organizing and evaluating data. • Logical, so procedures can be duplicated or understood by others • Empirical, so decisions are based on data collected • Reductive, so it investigates a small sample which can be generalized to a larger population • Replicable, so others may test the findings by repeating it. • Discovering new facts or verify and test old facts. 15
  • 16. SAMPLE SELECTION • Sample size • Sampling plan and unit • Sample design Sample size This refers to number of items selected from the universe to constitute a sample. In other words the number of respondents from which data is collected. The sample size of this study is 50 to determine the effectiveness of distribution and to evaluate the service provided to retailers Sampling units One of the units into which an aggregate is divided for purpose of sampling. The sampling unit survey was done in Bangalore city in areas like Shivajinagar, Vasanthnagar, Cox town, Frazer town etc. Sample design Simple random sampling was chosen to collect relevant information. Simple random sampling: Simple random sampling refers to that sampling technique in which each and every unit of the population has an equal opportunity of being selected in the sample 2.7 LIMITATIONS OF THE STUDY: 16
  • 17. The respondent may be biased. • Due to language problem it is possible that the respondents were not be able to understand the questionnaire and can cause misleading results. • The research was confined to Bangalore city only. • The time available was insufficient to carry on an exhaustive study but the research has done every effort to make this study an exhaustive one. CHAPTER-3 17
  • 18. DATA ANALYSIS AND INTERPRETATION TABLE NO: 1 Table showing age of the respondents: PARTICULARS NO OF RESPONDENTS (%)PERCENTAGE 18-20 7 14 20-25 15 30 25-35 18 36 Above 35 10 20 Total 50 100 ANALYSIS: From the above table it can be observed that, 30% are between age group 20-25, 36% are between age group 25-35, 20% are between age group above 35 and 14% are between age between group 18-20. 18
  • 19. GRAPH NO: 1 INFERENCE: From the above graph we can interpret that a majority of respondents who belong to middle and young age group are doing retailing business in India. This shows a huge potential for the young and middle age group people to carry out retailing business. TABLE NO: 2 19
  • 20. Table showing the occupation of respondents PARTICULARS NO OF RESPONDENTS (%)PERCENTAGE Business 26 52 Self employed 11 22 Professional 9 18 Others 4 8 Total 50 50 ANALYSIS: From the above table it can be observed that, 52% of people are in business occupation, 22% are self employed, 18% are professionals and 8% are doing other occupations. GRAPH NO: 2 20
  • 21. INFERENCE: From the above analysis, it is clear that business people, self employed are doing retailing business and professional people are less because of the research area and other people carrying out retailing occupation are government employee, house wife’s etc. TABLE NO: 3 21
  • 22. Gender of the respondents PARTICULARS NO OF RESPONDENTS (%)PERCENTAGE Male 41 82 Female 09 18 Total 50 100 ANALYSIS: From the above table it can be observed that 82% are male and 18% are female among the respondents who are doing retailing business. GRAPH NO: 3 22
  • 23. INFERENCE: From the above graph it is clear that majority of male are doing retailing business. And female doing the retailing business are very few. TABLE NO: 4 23
  • 24. Retailers experience with Reliance Communication PARTICULARS NO OF (%)PERCENTAGE RESPONDENTS 0-1 yrs 20 40 1-2 yrs 18 36 2-4 yrs 07 14 > 4 yrs 03 6 Total 50 50 ANALYSIS: From the above table it can be observed that 40% of retailers are doing reliance communication business from 0-1 years.36% are doing business from 1-2 year,14% are doing business from 2-4 years and 6% are doing business from more than 4 years. GRAPH NO: 4 24
  • 25. INFERENCE: From the above analysis we can infer that from past one year majority of respondents are retailers for reliance communication. The reason for being retailers of reliance communication is due to launce of reliance GSM. TABLE NO: 5 25
  • 26. Retailer response towards Reliance Communication PARTICULARS NO OF RESPONDENTS (%)PERCENTAGE Excellent 9 18 Good 25 50 Average 10 20 Below Average 06 12 TOTAL 50 100 ANALYSIS: From the above table it can be observed that, 50% of retailer’s have a good response towards reliance communication. 20% say its average, 18% say it’s excellent, and 12% say it’s below average. GRAPH NO: 5 26
  • 27. INFERENCE: From the analyzed data it is clear that retailers have a good response towards reliance communication for the service provided by them. TABLE NO: 6 Retailer’s opinion for Service value offered by the distributors 27
  • 28. PARTICULARS NO OF RESPONDENTS (%)PERCENTAGE Excellent 7 14 Good 28 56 Average 06 12 Below Average 09 18 TOTAL 50 100 ANALYSIS: From the above table it can be observed that, 56% of retailer’s opinion about service value offered by distributor is good, 14% say its excellent 12% say its average, and 18% told it was below average. GRAPH NO: 6 28
  • 29. INFERENCE: From the analysis it is clear that service offered by royal tech distributor was good. And this indicates that retailers have a good opinion towards the distributor for the service provided by them. TABLE NO: 7 Product availability of Reliance Communication to retailers by the distributor 29
  • 30. PARTICULARS NO OF RESPONDENTS (%)PERCENTAGE Excellent 15 30 Good 19 38 Average 11 22 Below Average 05 10 TOTAL 50 100 ANALYSIS: From the above table it can be observed that, 38% say product availability of reliance communication by royal tech distributor was good, 30 say it’s excellent, 22% say its average, and 10% say it’s below average. GRAPH NO: 7 30
  • 31. INFERENCE: From the above analysis it is clear that products of reliance communication were supplied to retailers by the distributor in time and when the stock was over and there was no delay in filling of stocks. TABLE NO: 8 31
  • 32. Customer complaints handled by the distributors PARTICULARS NO OF RESPONDENTS (%)PERCENTAGE Yes 31 62 No 19 38 TOTAL 50 100 ANALYSIS: From the above table it can be observed that, 54% of respondents agree that customer complaints are handled by the distributor. And 46% do not agree about the customer complaints handled by the distributor. GRAPH NO: 8 32
  • 33. INFERENCE: From the above survey it is clear that majority of retailers say that customer’s complaints are handled and solved by the distributor. This indicates that service provided by distributor in order to resolve the customer issues is good. TABLE NO: 9 33
  • 34. Customer’s complaints handled by the retailers PARTICULARS NO OF RESPONDENTS (%)PERCENTAGE Yes 33 66 No 17 34 TOTAL 50 100 ANALYSIS: From the above table it can be observed that, 66% of retailer says that they handle customer complaints directly and 34% say they do not handle customer complaints directly. GRAPH NO: 9 34
  • 35. INFERENCE: From the above analyses it shows that retailers resolve the customer complaints directly. And in order to resolve the customer complaints at a much faster rate retailer must be provided with proper training and necessary skills to handle customer issues. TABLE NO: 10 35
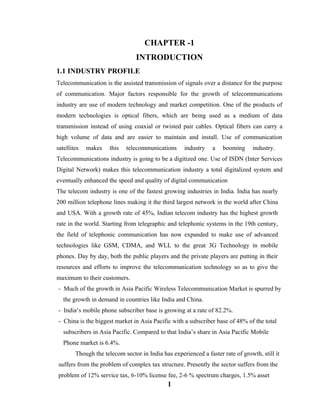
  • 36. Opinion of retailers about the duration taken to assess customer complaints Hours Days Week Total TIME TAKEN PARTICULARS NOR %Age NOR %Age NOR %Age NOR %Age a. Handsets 09 38 13 26 18 36 50 100 b. Sim activations 14 28 28 56 4 8 50 100 c. Recharges 44 88 6 12 - - 50 100 NOTE: NOR =No of respondents ANALYSIS: From the above table it can be observed that, 38% retailers say it takes hours together to repair or resolve complaints w.r.t to handsets and 26% say it take days to rectify the issue. 14% say it takes hours for sim activations and 56% say it takes days for sim activation. 88% say it takes hours to recharge and 12% say it takes days for recharges to be done. GRAPH NO: 10 36
  • 37. Graph showing Opinion of retailers about the duration taken to assess customer complaints INFERENCE: From the above analyses it can be observed that more time was taken to rectify issues like handset repairs, days together for sim activations while recharges took less time TABLE NO: 11 37
  • 38. Promotional activities provided by distributor to sell the product PARTICULARS NO OF (%)PERCENTAGE RESPONDENTS Advertisements 10 20 Brochures 20 40 Posters/Displays 12 24 Others 08 16 TOTAL 50 100 ANALYSIS: From the above table it can be observed that, 40% of respondents find brochures were provided by distributor to sell the product, 24% say posters and displays were provided , 20% say advertisement were provided and 16% say other promotional support were provided to sell the products. GRAPH NO: 11 38
  • 39. INFERENCE: From the above analyses it is clear that broachers, posters/displays are the most effective promotion activities provided by the distributors. And other promotional activities like stickers, catalogues are provided by distributor to sell the products which were not much effective. TABLE NO: 12 Opinion about the service provided by Royal Tech Distributor. 39
  • 40. OPINIONS Need to Excellent Good Average Total improve NOR %Age NOR %Age NOR %Age NOR %Age NOR %Age PARTICULARS a. Speed of Service 12 24 21 42 10 20 7 14 50 100 b. Product knowledge 9 18 18 36 13 26 10 20 50 100 c. Willingness to help 4 8 16 32 24 48 6 12 50 100 d. After sales 14 28 26 52 6 12 4 8 50 100 service NOTE: NOR =No of respondents ANALYSIS: From the above table it can be observed that: 42% respondents say that speed service provided was good, 14% say it needs to improve. 36% respondents agree product knowledge of distributor is good and 20% agree it needs to be improved. 48% of respondents say that willingness to help of distributor was average and 8% say its excellent. 52% of respondents say after sales service of distributor is good and 8% say it needs to be improved . GRAPH NO: 12 40
  • 41. Graph showing opinion of retailers about the service provided by Royal Tech Distributor. INFERENCE: From the above survey it is clear that speed of service provided is good and product knowledge provided by distributor is good but as we can see the support provided by distributor needs improvement and after sales service is excellent. Hence we can conclude that service provided by Royal Tech Distributor is good. TABLE NO: 13 41
  • 42. Table showing the retailer satisfaction with the profit margin provided by the distributors PARTICULARS NO OF RESPONDENTS (%)PERCENTAGE Yes 34 68 No 16 32 TOTAL 50 100 ANALYSIS: From the above table it can be observed that, 68% are satisfied with the profit margin provided by the distributor and 32% are not satisfied with the profit margin provided by the distributor. GRAPH NO: 13 42
  • 43. INFERENCE: From the survey it is clear that profit margin given to retailers on easy recharges, sim activations, handset selling are provided within the time period and retailers are satisfied with the profit margin provided. TABLE NO: 14 43
  • 44. Table showing Comparison of Royal Tech distributors with other distributors RATINGS Need to Excellent Good Average Total improve NOR %Age NOR %Age NOR %Age NOR %Age NOR %Age PARTICULARS a. Advertisement 07 14 14 28 16 32 13 26 50 100 b. Promotion 08 16 18 36 14 28 10 20 50 100 c. Credit 11 22 14 28 13 26 12 24 50 100 d. Claims 02 04 12 24 25 50 11 22 50 100 e. Offers/Gifts 07 14 16 32 19 38 8 16 50 100 NOTE: NOR =No of respondents ANALYSIS: From the above table it can be observed that, 32% say advertisements provided by distributor were average when compared to other distributors and 14% say it was excellent. 36% say promotions provided by distributor were good and 16% say it was excellent. 28% say credits provided by distributor were good and 22% say it was excellent. 50% say claims were settled at a average rate and 04 % say it was excellent. 38% say offers/gifts provided were average and 14% say it was excellent. 44
  • 45. GRAPH NO: 14 Graph showing the comparison of Royal Tech Distributor from other distributors. INFERENCE: From the survey we can conclude that advertisements provided by distributor were average when compared to other distributor and promotion were good .credit provided by distributor were average when compared to other distributor and claims were settled at a slower rate. Offers/gifts provided to retailers’ were average when compared to other distributors. 45
  • 46. TABLE NO: 15 Table showing retailers opinion about frequency of direct sales representatives (DSR) visits to retail shops PARTICULARS NO OF RESPONDENTS (%)PERCENTAGE YES 31 62 NO 19 38 Total 50 100 ANALYSIS: From the above table it can be observed that, 62% agree that DSR visits their shops regularly and 38% say DSR does not visits their shops regularly. GRAPH NO: 15 46
  • 47. INFERENCE: From the above graph it is clear that DSR visits to retail outlets frequently. TABLE NO: 16 47
  • 48. Table showing DSR Visit to retailers per week: PARTICULARS NO OF RESPONDENTS (%)PERCENTAGE 0-1 times 7 14 1-2 times 12 24 2-3 times 9 18 3-4 times 6 12 4-5 times 14 28 5-7 times 2 4 TOTAL 50 100 ANALYSIS: From the above table it can be observed that, 14% of shops are visited by DSR 0-1 times in a week, 24% of shops are visited 1-2 times in a week, 18% of shops are visited 2-3 times in week, 12% of shops are visited 3-4 times in week 28% of shops are visited 4-5 times in week and 4% of shops are visited 5-7 times in week. 48
  • 49. GRAPH NO: 16 INFERENCE: From the above graph it is clear that frequency of DSR visits to a shop in a week is 4-5 times. This indicates only few shops are visited on a regular basis. TABLE NO: 17 49
  • 50. Table showing Experience of retailer when interacted with Direct Sales Executive (DSR). RATINGS Need to Excellent Good Average Total improve NOR %Age NOR %Age NOR %Age NOR %Age NOR %Age PARTICULARS a. Courteous/polite 14 28 16 32 11 22 9 18 50 100 b. Listening skills 8 16 14 28 12 24 16 32 50 100 c. Product knowledge 10 20 13 26 18 36 9 18 50 100 d. Willingness to 6 12 14 28 20 40 10 20 50 100 help e. Speed of service 11 22 18 36 9 18 12 24 50 100 NOTE: NOR =No of respondents ANALYSIS: From the above table it can be observed that, 32% say DSR were polite and courteous with retailers and 18% say they should improve. 32% say listings skills of DSR needs to be improved and 16% say it’s excellent 36% say DSR have average level of information about product and 18% say it should be improved. 40% say DSR willingness to help to retailers is average and 12% say it’s excellent 36% say DSR speed of service was good and 18% say its average. 50
  • 51. GRAPH NO: 17 Graph showing retailers experience when interacted with Direct Sales Representatives (DSR) INFERENCE: From the above graph it is clear that DSR are courteous and polite with retailers. Listing skills of DSR is poor and need to be improved, product knowledge is average. The willingness of DSR to sort out retailer’s problem is average. And speed of service provided by DSR to retailers is good. CHAPTER -4 51
  • 52. SUMMARY OF FINDINGS • From the analyzed data it is clear that 36% of respondents who were doing retailing business were people of young and middle age group. This shows that there is a huge potential for this category of people to carry out retailing business and no of retail shops were increased by 40% in the past one year due to the launch of reliance GSM service • Majority of male are doing retailing business and female doing the retailing business are very few. • It was observed from analyzed data that product were available to retailers through distributors on time. Customer complaints were handled by both retailers and distributors • 50% of retailers had a good response towards the response provided by reliance communication • 68% of retailers were satisfied with the profit margin provided to them • From the above analyses it was observed that more time was taken to rectify issues like handset repairs, days together for sim activations while recharges took less time • When royal tech distributor was compared to other distributor 32% of respondents said that advertisements were not effective and 50 % said that claims were not settled soon • 40% retailers had a good opinion that promotional support provided to them was not effective. • Retailers had a good opinion towards DSR for the service provided.62% of retailers had a opinion that DSR visited their shops frequently. It was observed from the analyses that DSR were courteous and polite with retailers but listening skills and product knowledge was average. CHAPTER -5 52
  • 53. SUGGESTIONS AND CONCLUSION SUGGESTIONS: From the analysis it is clear that the distributors need to maintain stock of CDMA handsets, CDMA and GSM currencies and recharge coupons as there is a shortage of supply in some retail outlets and another frequent complaints which is seen among the retailers is about the settlement of claims, measures must be taken to resolve it soon. As there were many retailers who are were into CDMA business and now have also taken up new Reliance GSM, confusion is created for the recharge technique of CDMA and GSM, to overcome this they should be provided with retailers help desk number. DSR (Distributor Sales Representative) forms a bridge between distributors and the retailers, therefore it is very essential for Royal Tech to train the DSR’s so that they will be able resolve the retailer’s problems and thereby need not approach channel manager or distributor manager. The channel Manager should have regular visits to all categories of retailers and randomly check the performance of the DSR’s. To increase the sales of GSM, company should provide electronics displays in selected retail shops so as to attract the customers and advertisements about these retail outlets in newspapers so that they can overcome the standard promotion way of only posters and banners. Reliance GSM need to motivate the retailers by giving them incentives, trophies of achievements to retailers for achieving the target and boosting the sales. This forms a way of motivation for the retailer to concentrate on further increase of sales. The company needs to train the retailers about the product and its offers so that they will be in a position to handle the customer complaints directly and need not approach the distributor frequently. 53
  • 54. CONCLUSIONS: Success of an organization largely depends mainly on its marketing abilities. For this, a marketer should know the needs, requirements and preferences of target market. The marketer should make a detailed study of the expectations of the retailers and then take necessary steps to fulfill the needs of the retailer. As it is the retailers who interacts with the end customers it is necessary to identify the requirements of retailer and to fulfill those needs to do this work the channel effectiveness should be determined in the role of service delivery. The main motive for conducting this survey was to identify the channel effectiveness in service delivery of distributor for reliance communication. The report was an endeavour to determine how effective are the distributor was in delivery of service for the retailers. The study was successful in understanding the distribution channel of reliance communication and how the products reach to ultimate consumer .The flow of products through different intermediaries in the channel and role played by them in delivery of products to consumers. The analysis helped to identify the satisfaction level of retailers for the service provided by the distributors and impact of this on ultimate customers. And to identify different promotional support provided by the company and to differentiate the distributors according to their performances. It was useful to understand the role of representatives in service delivery to retailers. The study is confined only to East of Bangalore and the retailers of Royal Tech and from the survey it was clear that overall performance of Royal Tech is good and the retailers were satisfied. 54