[Infographic] Obama Energy Agenda: Gas Prices
•
7 recomendaciones•2,940 vistas

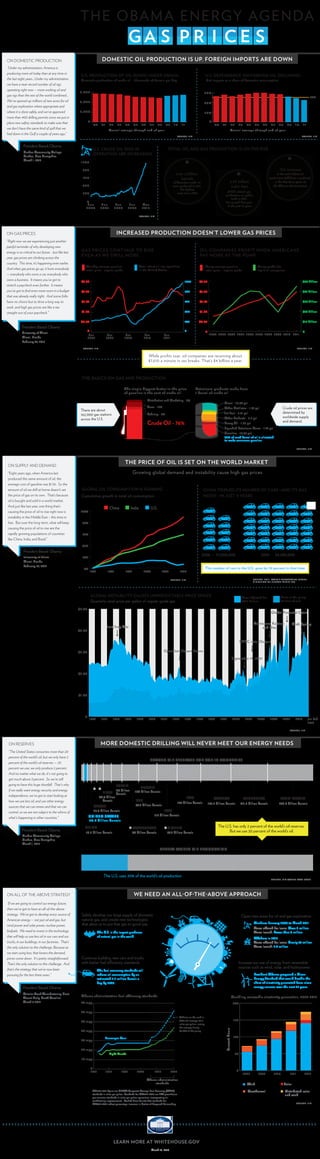
The Obama administration has pursued an "all-of-the-above" energy strategy to increase domestic energy production from various sources and reduce U.S. dependence on foreign oil. Domestic oil production has increased under Obama, though gas prices are impacted more by global supply and demand. The U.S. needs to develop alternative energy sources because domestic drilling alone cannot meet energy needs given that the U.S. has only 2% of global oil reserves but uses 20% of the world's oil.
Recomendados

Recomendados
Más contenido relacionado
Destacado
Destacado (9)
Más de Obama White House
Más de Obama White House (20)
Último
Último (20)
[Infographic] Obama Energy Agenda: Gas Prices
- 1. T H E O B A M A E N E R GY AG E N DA ON DOMESTIC PRODUCTION DOMESTIC OIL PRODUCTION IS UP. FOREIGN IMPORTS ARE DOWN “Under my administration, America is producing more oil today than at any time in U.S. PRODUCTION OF OIL RISING UNDER OBAMA U.S. DEPENDENCE ON FOREIGN OIL DECLINING the last eight years…Under my administration, Domestic production of crude oil - thousands of barrels per day Net imports as a share of domestic consumption we have a near-record number of oil rigs operating right now -- more working oil and 6,000 60% gas rigs than the rest of the world combined… 50% We've opened up millions of new acres for oil 4,000 40% and gas exploration where appropriate and where it is done safely, and we've approved 2,000 20% more than 400 drilling permits since we put in place new safety standards to make sure that 0 0 ’0 0 ’0 1 ’0 2 ’0 3 ’0 4 ’0 5 ’0 6 ’0 7 ’0 8 ’0 9 ’1 0 ’1 1 ’0 0 ’0 1 ’0 2 ’0 3 ’0 4 ’0 5 ’0 6 ’0 7 ’0 8 ’0 9 ’1 0 ’1 1 we don’t have the same kind of spill that we Annual average through end of year Annual average through end of year had down in the Gulf a couple of years ago.” SOURCE: EIA SOURCE: EIA President Barack Obama U.S. CRUDE OIL RIGS IN TOTAL OIL AND GAS PRODUCTION IS ON THE RISE Nashua Community College OPERATION ARE INCREASING Nashua, New Hampshire March 1, 2012 1200 960 13% increase over 2 billion in the total federal oil 720 barrels production (offshore + onshore) of American crude oil 2.97 trillion in the first three years of 480 were produced in 2011, cubic feet the Obama administration the highest 240 level since 2003 of U.S. natural gas production on public lands in 2011, 0 the second best year Jan Jan Jan Ja n De c in the past 10 years 2000 2003 2006 2009 2012 SOURCE: EIA ON GAS PRICES INCREASED PRODUCTION DOESN’T LOWER GAS PRICES “Right now we are experiencing just another painful reminder of why developing new energy is so critical to our future. Just like last GAS PRICES CONTINUE TO RISE OIL COMPANIES PROFIT WHEN AMERICANS EVEN AS WE DRILL MORE PAY MORE AT THE PUMP year, gas prices are climbing across the country. This time, it’s happening even earlier. Monthly average gasoline Total rotary oil rigs operating Yearly average gasoline Yearly profits for And when gas prices go up, it hurts everybody retail price - regular grade in the United States retail price - regular grade top 3 oil companies — everybody who owns a car, everybody who owns a business. It means you’ve got to $4.50 1200 $4.50 $90 billion stretch a paycheck even further. It means you’ve got to find even more room in a budget $3.60 960 $3.60 $72 billion that was already really tight. And some folks have no choice but to drive a long way to $2.70 720 $2.70 $54 billion work, and high gas prices are like a tax straight out of your paycheck.” $1.80 480 $1.80 $36 billion $0.90 240 $0.90 $18 billion President Barack Obama 0 0 0 0 University of Miami 2002 2003 2004 2005 2006 2007 2008 2009 2010 2011 Jan Jan Jan Jan Jan Miami, Florida 2007 2008 2009 2010 2011 February 23, 2012 SOURCE: EIA SOURCE: EIA While profits soar, oil companies are receiving about $7,610 a minute in tax breaks. That’s $4 billion a year. THE BASICS ON GAS AND PRODUCTION The single biggest factor in the price Petroleum products made from of gasoline is the cost of crude oil. 1 barrel of crude oil Distribution and Marketing - 6% Diesel - 10.04 gal Taxes - 12% Other Distillates - 1.24 gal Crude oil prices are There are about Jet Fuel - 3.91 gal determined by 162,000 gas stations Refining - 6% Other Products - 6.8 gal worldwide supply across the U.S. Crude Oil - 76% Heavy Oil - 1.68 gal and demand. Liquefied Petroleum Gases - 1.72 gal Gasoline - 19.36 gal 46% of each barrel of oil is allocated to make consumer gasoline SOURCE: EIA THE PRICE OF OIL IS SET ON THE WORLD MARKET ON SUPPLY AND DEMAND “Eight years ago, when America last Growing global demand and instability cause high gas prices produced this same amount of oil, the average cost of gasoline was $1.56. So the amount of oil we drill at home doesn’t set GLOBAL OIL CONSUMPTION IS SOARING CHINA TRIPLED ITS NUMBER OF CARS—AND ITS GAS the price of gas on its own. That’s because Cumulative growth in total oil consumption NEEDS—IN JUST 4 YEARS oil is bought and sold in a world market. And just like last year, one thing that’s China India U.S. causing the price of oil to rise right now is 120% instability in the Middle East – this time in Iran. But over the long-term, what will keep 96% causing the price of oil to rise are the rapidly growing populations of countries 72% like China, India, and Brazil.” 48% President Barack Obama University of Miami 2006 - 11,000,000 2010 - 34,430,000 24% Miami, Florida February, 23, 2012 0% The number of cars in the U.S. grew by 10 percent in that time 1995 1998 2001 2004 2007 2010 SOURCE: EIA S O U R C E : 2 0 1 1 , W A R D ' S A U TO M O T I V E G R O U P, A D I V I S I O N O F P E N TO N M E D I A I N C . GLOBAL INSTABILITY CAUSES UNPREDICTABLE PRICE SPIKES Price adjusted for Price at the pump Quarterly retail price per gallon of regular grade gas 2012 dollars at time of sale $5.00 Global Financial Crisis Hurricanes Katrina Arab Spring Iran/Iraq War and Rita $4.00 OPEC cuts Output $3.00 Operation Desert Storm September 11, 2001 $2.00 $1.00 0 1976 1978 1980 1982 1984 1986 1988 1990 1992 1994 1996 1998 2000 2002 2004 2006 2008 2010 jan-feb 2012 SOURCE: EIA ON RESERVES MORE DOMESTIC DRILLING WILL NEVER MEET OUR ENERGY NEEDS “The United States consumes more than 20 percent of the world’s oil, but we only have 2 PROVED OIL RESERVES FOR TOP 14 COUNTRIES percent of the world’s oil reserves — 20 percent we use; we only produce 2 percent. And no matter what we do, it's not going to get much above 3 percent. So we're still going to have this huge shortfall. That's why RUSSIA KUWAIT if we really want energy security and energy 60 billion 1 2 LIBYA barrels 104 billion barrels independence, we've got to start looking at 46.4 billion IRAN CANADA VENEZUELA SAUDI ARABIA how we use less oil, and use other energy barrels UAE 137 billion barrels 175.2 billion barrels 211.2 billion barrels 262.6 billion barrels sources that we can renew and that we can QATAR 97.8 billion barrels control, so we are not subject to the whims of 25.4 billion barrels IRAQ UNITED STATES 115 billion barrels what's happening in other countries.” 20.7 billion barrels CHINA 1 KAZAKHSTAN 2 NIGERIA The U.S. has only 2 percent of the world’s oil reserves. President Barack Obama But we use 20 percent of the world’s oil. 14.8 billion barrels 30 billion barrels 37.2 billion barrels Nashua Community College Nashua, New Hampshire March 1, 2012 YEARLY WORLD OIL PRODUCTION The U.S. uses 20% of the world’s oil production S O U R C E : C I A W O R L D FA C T B O O K ON ALL OF THE ABOVE STRATEGY WE NEED AN ALL-OF-THE-ABOVE APPROACH “If we are going to control our energy future, then we’ve got to have an all-of-the-above strategy. We’ve got to develop every source of Safely develop our large supply of domestic Open new areas for oil and gas exploration American energy -- not just oil and gas, but natural gas, and create new technologies that allow us to put that gas to good use. Onshore: January 2009 to March 2011 wind power and solar power, nuclear power, Acres offered for lease: Over 6 million biofuels. We need to invest in the technology The U.S. is the largest producer Acres leased: Fewer than 4 million that will help us use less oil in our cars and our of natural gas in the world Offshore in 2012 trucks, in our buildings, in our factories. That’s Acres offered for lease: Nearly 37 million E F the only solution to the challenge. Because as Acres leased: 2.4 million we start using less, that lowers the demand, prices come down. It's pretty straightforward. Continue building new cars and trucks That’s the only solution to this challenge. And with better fuel efficiency standards Increase our use of energy from renewable that’s the strategy that we’ve now been sources such as wind, solar, and hydropower. The fuel economy standards will pursuing for the last three years.” reduce oil consumption by an President Obama proposed a Clean estimated 2.2 million barrels a Energy Standard that would double the day by 2025. share of electricity generated from clean President Barack Obama energy sources over the next 25 years. Daimler Truck Manufacturing Plant Mount Holly, North Carolina Obama administration fuel efficiency standards Doubling renewable electricity generation, 2008-2012 March 7, 2012 70 mpg 200 60 mpg X Vehicles on the road in 50 mpg 2025 will average 54.5 150 miles per gallon, saving the average family 40 mpg Terawatt Hours $8,000 at the pump Passenger Cars 100 30 mpg 20 mpg Light Trucks 50 10 mpg 0 1975 1985 1995 2005 2015 2025 0 2008 2009 2010 2011 2012 Obama administration standards Wind Solar MY1978-2011 figure are NHTSA Corporate Average Fuel Economy (CAFE) Geothermal Distributed solar standards in miles per gallon. Standards for MY2012-2025 are EPA greenhouse and wind gas emission standards in miles per gallon equivalent, incorporating air conditioning improvements. Dashed Lines denote that standards for MY2017-2025 reflect percentage increases in Notice of Proposed Rulemaking. SOURCE: EIA LEARN MORE AT WHITEHOUSE.GOV March 12, 2012