Manhattan Fourth Quarter 2009 Real Estate Market Report Report
•
0 recomendaciones•278 vistas

Prudential Douglas Elliman Manhattan Fourth Quarter 2009 Real Estate Market Report

Recomendados
Recomendados
Más contenido relacionado
Último
Último (20)
Destacado
Destacado (20)
Manhattan Fourth Quarter 2009 Real Estate Market Report Report
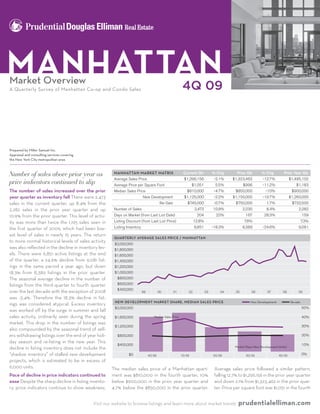
- 1. Manhattan Market Overview 4Q 09 A Quarterly Survey of Manhattan Co-op and Condo Sales Prepared by Miller Samuel Inc. Appraisal and consulting services covering the New York City metropolitan area Number of sales above prior year as Manhattan Market Matrix Current Qtr % Chg Prior Qtr % Chg Prior Year Qtr Average Sales Price $1,296,156 -2.1% $1,323,462 -12.7% $1,485,102 price indicators continued to slip Average Price per Square Foot $1,051 5.5% $996 -11.2% $1,183 The number of sales increased over the prior Median Sales Price $810,000 -4.7% $850,000 -10% $900,000 year quarter as inventory fell There were 2,473 New Development $1,125,000 -2.2% $1,150,000 -10.7% $1,260,000 sales in the current quarter, up 8.4% from the Re-Sale $745,000 -0.7% $750,000 1.7% $732,500 2,282 sales in the prior year quarter and up Number of Sales 2,473 10.9% 2,230 8.4% 2,282 10.9% from the prior quarter. This level of activ- Days on Market (from Last List Date) 204 22% 167 28.3% 159 ity was more than twice the 1,195 sales seen in Listing Discount (from Last List Price) 12.8% 7.6% 7.3% the first quarter of 2009, which had been low- Listing Inventory 6,851 -18.3% 8,389 -24.6% 9,081 est level of sales in nearly 15 years. The return QUARTERLY�AVERAGE�SALES�PRICE�/�MANHATTAN to more normal historical levels of sales activity QUARTERLY�AVERAGE�SALES�PRICE�/�MANHATTAN $2,000,000 was also reflected in the decline in inventory lev- $2,000,000 $1,800,000 $1,800,000 els. There were 6,851 active listings at the end $1,600,000 $1,600,000 of the quarter, a 24.6% decline from 9,081 list- $1,400,000 $1,400,000 ings in the same period a year ago, but down $1,200,000 $1,200,000 18.3% from 8,389 listings in the prior quarter. $1,000,000 $1,000,000 The seasonal average decline in the number of $800,000 $800,000 listings from the third quarter to fourth quarter $600,000 $600,000 $400,000 over the last decade with the exception of 2008 $400,000 99 00 01 02 03 04 05 06 07 08 09 99 00 01 02 03 04 05 06 07 08 09 was -3.4%. Therefore the 18.3% decline in list- NEW�DEVELOPMENT�MARKET�SHARE��MEDIAN�SALES�PRICE New Developement Re-sale NEW�DEVELOPMENT�MARKET�SHARE��MEDIAN�SALES�PRICE New Developement Re-sale ings was considered atypical. Excess inventory $2,000,000 50% $2,000,000 50% was worked off by the surge in summer and fall $1,600,000 Median Sales Price 40% sales activity, ordinarily seen during the spring $1,600,000 Median Sales Price 40% market. This drop in the number of listings was $1,200,000 30% $1,200,000 30% also compounded by the seasonal trend of sell- $800,000 20% ers withdrawing listings over the end of year holi- $800,000 20% day season and re-listing in the new year. This $400,000 Market Share New Development (Units) 10% $400,000 10% decline in listing inventory does not include the Market Share New Development (Units) $0 0% “shadow inventory” of stalled new development $0 4Q 08 4Q 08 1Q 09 1Q 09 2Q 09 2Q 09 3Q 09 3Q 09 4Q 09 4Q 09 0% projects, which is estimated to be in excess of AVERAGE�PRICE�PER�SQ�FT�/�CO�OP Downtown East Side West Side Uptown 6,000 units. AVERAGE�PRICE�PER�SQ�FT�/�CO�OP The median sales price of a Manhattan apart- Downtown East Side West Side Average sales price followed a similar pattern, Uptown $1,400 $1,400 Pace of decline in price indicators continued to ment was $810,000 in the fourth quarter, 10% $1,200 falling 12.7% to $1,296,156 in the prior year quarter ease Despite the sharp decline in listing invento- $1,200 below $900,000 in the prior year quarter and and down 2.1% from $1,323,462 in the prior quar- $1,000 ry, price indicators continue to show weakness. 4.7% below the $850,000 in the prior quarter. $1,000 ter. Price per square foot was $1,051 in the fourth $800 $800 Visit our $600 website $600 to browse listings and learn more about market trends prudentialelliman.com $400 $400
- 2. 4Q 09 MANhAttAN MArket overvIew Prudential douglas elliMan real estate Co-oP market quarter, down 11.2% from the prior year quarter and 8.4% declines in the studio and 1-bedroom result of $1,183 but up 5.5% from the prior quar- markets respectively and double digit declines ter result of $996. Entry-level apartments, name- in the 2, 3 and 4-bedroom markets. ly studio and 1-bedroom units, garnered a 58% Price indicators mixed as number Number of sales jumped as inventory declined market share in the fourth quarter compared of sales jumped There were 1,264 co-op sales in the fourth 53% in the prior year quarter. This market seg- Price indicators fell from prior year quarter, quarter, surging 28.3% from 985 sales in the QUARTERLY�AVERAGE�SALES�PRICE�/�MANHATTAN ment also saw the lowest year over year decline but “sideways” from prior quarter The median prior year quarter and 27% above 995 sales in $2,000,000 in quarterly median sales prices as compared to QUARTERLY�AVERAGE�SALES�PRICE�/�MANHATTAN sales price of a Manhattan co-op was $630,000, the prior quarter. This level of sales is more than $1,800,000 the remainder of the market. $2,000,000 down 6.7% from the prior year quarter result of three times the 414 sales of the first quarter of $1,600,000 $1,800,000 Despite increase in activity, properties took $675,000 and unchanged from the prior quarter. 2009, considered the low point in activity after $1,400,000 $1,600,000 longer to sell The average days on market was The pace of decline in the year over year change the market tipping point in the fall of 2008. $1,200,000 $1,400,000 204 days in the fourth quarter, up 28.3% from in$1,000,000 sales price has eased for the third The number of sales is now consistent with the median $1,200,000 the prior year quarter average of 159 days and $800,000 consecutive quarter from the first quarter peak 10-year quarterly average of 1,270 sales. The $1,000,000 jumped 22% from 167 days in the prior quarter. $600,000 of -21.9%. The average sales price was $975,049 robust level of sales in the fourth quarter relative $800,000 $400,000 Since this metric is based on closed sales, it in- in the first quarter, down 19.6% from 02 prior to the first05 of 06 $600,000 99 00 01 the 03 04 half 2009 served to diminish the 07 08 09 cludes properties that entered the market in the $400,000 year quarter average sales price of $1,213,382 and level of inventoryNew Developement 08There 09 NEW�DEVELOPMENT�MARKET�SHARE��MEDIAN�SALES�PRICE 99 00 01 02 03 04 05 06on the 07 market. Re-sale were first half of 2009 that languished until the num- down 3.1% from $1,005,744 in the prior quarter. 3,069 co-op apartments on the market at50% $2,000,000 NEW�DEVELOPMENT�MARKET�SHARE��MEDIAN�SALES�PRICE New Developement Re-sale the ber of sales surged in the third quarter. The jump This is the first time this price indicator has fallen end of the fourth quarter, 19.4% below the 3,808 $2,000,000 50% $1,600,000 Median Sales Price 40% in marketing time from the third quarter was con- below $1,000,000 since the third quarter of listings in the same period a year ago and down Median Sales Price sistent with the sharp decline in listings over the $1,600,000 2005. Price per square foot was $921, down 13% 20.1% from the prior quarter total of 3,840 $1,200,000 40% 30% same period and increased sales activity causing from $1,059 in the prior year quarter, but up 6.4% listings. The combination of lower inventory30% $1,200,000 and $800,000 20% older inventory to be absorbed. Listing discount from $866 in the prior quarter. A decline in year the higher number of sales caused the monthly $800,000 20% increased to 12.8% in the fourth quarter from over year quarterly median sales price occurred absorption rateSharefall to 7.3 months, the lowest $400,000 Market to New Development (Units) 10% 7.3% in the prior year quarter and from 7.6% in in all apartment size categories. There were 8.5% level in two years. Co-op sales represented 51.1% $400,000 10% $0 Market Share New Development (Units) 0% the prior quarter. 4Q 08 1Q 09 2Q 09 3Q 09 4Q 09 $0 4Q 08 1Q 09 2Q 09 3Q 09 4Q 09 0% The end of a decade. The beginning of a new AVERAGE�PRICE�PER�SQ�FT�/�CO�OP Downtown East Side West Side Uptown market. The second half of the 2009 Manhattan $1,400 AVERAGE�PRICE�PER�SQ�FT�/�CO�OP Downtown East Side West Side Uptown housing market reflected a new era, marked $1,400 $1,200 by the milestone Lehman Brothers Bankruptcy $1,200 $1,000 tipping point of September 15, 2008. Buyers, sellers and real estate professionals have slowly $1,000 $800 adopted to changes including stringent, if not $800 $600 irrational mortgage underwriting, elevated un- $600 $400 employment and layoffs, lower compensation, a $400 $200 4Q 08 1Q 09 2Q 09 3Q 09 4Q 09 sharp price correction, shadow inventory, first- time home buyers’ tax credit, rising foreclosures, $200 4Q 08 1Q 09 2Q 09 3Q 09 4Q 09 LISTING�DISCOUNT�VS��DAYS�ON�MARKET�/�CO�OP declining appraisal quality, expanding marketing 20% LISTING�DISCOUNT�VS��DAYS�ON�MARKET�/�CO�OP 200 times and a host of other challenges. While the 20% 200 16% 175 increased level of sales in the second half of Days On Market 2009 was encouraging, a true housing recovery 16% 12% Days On Market 175 150 will be marked by a meaningful decline in 12% 150 8% 125 unemployment and greater consumer access to credit. 8% 125 100 4% Listing Discount 4% Listing Discount 100 0% 4Q 08 1Q 09 2Q 09 3Q 09 4Q 09 75 0% 4Q 08 1Q 09 2Q 09 3Q 09 4Q 09 75 AVERAGE�PRICE�PER�SQ�FT�/�CONDO Downtown East Side West Side Uptown $2,500 AVERAGE�PRICE�PER�SQ�FT�/�CONDO Downtown East Side West Side Uptown $2,500 $2,000 CO-Op Market Matrix Current Qtr % Chg Prior Qtr % Chg Prior Year Qtr CO-Op apartMent Mix % of Total Median Price Average Sales Price $975,049 $2,000 -3.1% $1,005,744 -19.6% $1,213,382 $1,500 Studio 23% $350,000 Average Price per Square Foot $921 6.4% $866 -13% $1,059 $1,500 1 bedroom 42% $591,000 Median Sales Price $630,000 $1,000 0% $630,000 -6.7% $675,000 Number of Sales 1,264 27% $1,000 $500 995 28.3% 985 2 bedroom 22% $1,130,000 Days on Market (from Last List Date) 151 12.7% 134 -0.7% 152 $500 3 bedroom 11% $1,950,000 Listing Discount (from Last List Price) 18.3% $0 12.5% 4Q 08 1Q 09 4.5% 2Q 09 3Q 09 4Q 09 Listing Inventory 3,069 -20.1%$0 3,840 4Q 08 -19.4% 1Q 09 3,808 2Q 09 4+ bedroom 3Q 09 2% $4,425,000 4Q 09 LISTING�DISCOUNT�VS��DAYS�ON�MARKET�/�CONDO 20% LISTING�DISCOUNT�VS��DAYS�ON�MARKET�/�CONDO 275 20% 275 prudentialelliman.com 16% Visit our website to browse listings and learn more about market trends Days On Market 250 16% Days On Market 250 12% 225
- 3. 99 00 01 02 03 04 05 06 07 08 09 $400,000 NEW�DEVELOPMENT�MARKET�SHARE��MEDIAN�SALES�PRICE 99 00 01 02 03 04 05 06 07 New Developement 08 09 Re-sale $2,000,000 Re-sale 50% Prudential douglas elliMan real estate MANhAttAN MArket overvIew NEW�DEVELOPMENT�MARKET�SHARE��MEDIAN�SALES�PRICE New Developement 4Q 09 $2,000,000 Median Sales Price 50% $1,600,000 40% $1,600,000 Median Sales Price 40% CoNDo market $1,200,000 30% of all apartment sales in the fourth quarter, up sales, re-sale unit sales increased 53.6% over $1,200,000 30% from 43.2% in the same period last year. This $800,000 20% the same period last year and new-development is a significant change from the same period a $800,000 20% unit sales fell 44.4% over the same period. The decade ago when the market share of co-op Price indicators mixed and listing $400,000 10% Market Share New Development (Units) declining trend in new development closings $400,000 $0 4Q 08 inventory dropped sales was 68.5%. Co-op inventory 1Q 09 44.8% of 2Q 09 was Market Share New Development (Units) 3Q 09 4Q 09 10% 0% reflect the constraints applied by lenders for all apartment listings 08 $0 4Q excluding shadow inventory. 1Q 09 Listing inventory09 2Q 09 3Q fell sharply 4Q 09 number of as 0% consumer mortgages in new projects. AVERAGE�PRICE�PER�SQ�FT�/�CO�OP Of total co-op inventory, 97.3% were considered Downtown slipped Side East West Side Uptown sales Condos represented 55.2% of Price indicators from prior year quarter re-sale listings and 2.7% were comprised of new Downtown $1,400 AVERAGE�PRICE�PER�SQ�FT�/�CO�OP all apartment Side East listings inWest Sidefourth Uptown the quarter, declined, change from prior quarter was development cond-ops—co-op apartments with consistent with each of the quarterly results $1,400 $1,200 mixed The median sales price of a Manhattan condo rules. $1,200 $1,000 of the past three years. There were 3,782 re- condo was $995,000 in the fourth quarter, down Days on market expanded as listing discount $1,000 $800 sales and new development condo units on the 11.2% from $1,120,075 in the prior year quarter jumped The average days on market was 151 market at the end of the fourth quarter, 28.3% and down 2% from $1,015,124 in the prior quarter. $800 $600 days, down nominally from 152 days in the prior below the 5,273 units in the same period last This is the lowest result for this price indicator in $600 $400 year quarter, but 17 days longer than 134 days year and 16.9% below the prior quarter total of approximately three years. Average sales price in $400 prior quarter. Listing discount continues the $200 4Q 08 1Q 09 4,549. Of the condos listed for sale, 09 2Q 09 3Q 09 4Q 47.4% or was $1,631,872 in the fourth quarter, down 3.5% to $200 expand, reaching 18.3% as compared to 4.5% 4Q 08 1Q 09 1,793 units were new development 4Q 09 and 2Q 09 3Q 09 listings from $1,691,459 in the same period last year, but LISTING�DISCOUNT�VS��DAYS�ON�MARKET�/�CO�OP in the prior year quarter and 12.5% in the prior 52.6% or 1,989 units were re-sale listings. 200 The up 3.3% from $1,579,438 in the prior quarter. 20% LISTING�DISCOUNT�VS��DAYS�ON�MARKET�/�CO�OP quarter. The combination of declining inventory new development market share does not include Price per square foot followed a similar pattern, 20% 200 and rising number of sales suggests that that 16% “shadow inventory” which is estimated to be more Days On Market 175 falling 7% to $1,187 from $1,277 per square foot remaining listings required larger discounts to 16% than 6,000 units. There were 1,209 condo sales 175 in the prior year quarter and rising 7.8% from 12% Days On Market 150 reach current market levels as buyers continue this quarter, down 6.8% from 1,297 units in the $1,101 in the prior quarter. Median sales price by 12% 150 to control the market. 8% same period last year and down 2.1% from 125 1,235 apartment size saw double digit declines in all 8% units in the prior quarter. When breaking down 125 categories as compared to the same period last 4% Listing Discount 100 market share by re-sale and new development year with the exception of the 1-bedroom market, 4% 100 0% Listing Discount 4Q 08 1Q 09 2Q 09 3Q 09 4Q 09 75 posting a 2.1% decline. All segments were either 0% 4Q 08 1Q 09 2Q 09 3Q 09 4Q 09 75 unchanged or higher than the median sales price AVERAGE�PRICE�PER�SQ�FT�/�CONDO Downtown East Side West Side Uptown of the prior quarter. $2,500 AVERAGE�PRICE�PER�SQ�FT�/�CONDO Downtown East Side West Side Uptown Days on market jumped while listing discount $2,500 $2,000 showed mixed results The days on market for $2,000 $1,500 condos was 259 days, more than three months longer than the 164 days in the prior year quarter $1,500 $1,000 and more than two months longer than the 194 $1,000 $500 days of the prior quarter. The sharp increase in $500 this metric is attributable to disparity between the $0 4Q 08 1Q 09 2Q 09 3Q 09 4Q 09 454 days on market for active new development $0 4Q 08 1Q 09 LISTING�DISCOUNT�VS��DAYS�ON�MARKET�/�CONDO 2Q 09 3Q 09 4Q 09 units and 167 days on market for re-sale units, 20% 275 consistent with the 151 days on market for co- LISTING�DISCOUNT�VS��DAYS�ON�MARKET�/�CONDO op apartments. The average listing discount was 20% 275 16% Days On Market 250 7.1% in the fourth quarter, down from 9.4% in the 16% 12% Days On Market 250 225 prior year quarter and up from 3.6% in the prior 225 quarter. 12% 8% 200 8% Listing Discount 200 175 4% 4% Listing Discount 175 0% 4Q 08 1Q 09 2Q 09 3Q 09 4Q 09 150 0% 4Q 08 1Q 09 2Q 09 3Q 09 4Q 09 150 AVERAGE�PRICE�PER�SQ�FT�/�LUXURY AVERAGE�PRICE�PER�SQ�FT�/�LOFT $3,500 AVERAGE�PRICE�PER�SQ�FT�/�LUXURY Current Qtr $1,700 AVERAGE�PRICE�PER�SQ�FT�/�LOFT Prior Year Qtr COndO Market Matrix % Chg Prior Qtr % Chg COndO apartMent Mix % of Total Median Price $3,000 $3,500 Average Sales Price $1,631,872 $1,500 $1,579,438 3.3%$1,700 -3.5% $1,691,459 Studio 12% $456,300 $3,000 $2,500 Average Price per Square Foot $1,187 $1,300 7.8% $1,500 $1,101 -7% $1,277 1 bedroom 38% $750,000 Median Sales Price $2,000 $2,500 $995,000 -2% $1,300 $1,015,124 $1,100 -11.2% $1,120,075 Number of Sales $1,500 $2,000 1,209 -2.1% $900 $1,100 1,235 -6.8% 1,297 2 bedroom 28% $1,375,000 Days on Market (from Last List Date) $1,000 259 33.5% 194 57.9% 164 $1,500 4Q 08 1Q 09 2Q 09 3Q 09 4Q 09 $700 $900 4Q 08 1Q 09 2Q 09 3Q 09 4Q 09 3 bedroom 19% $2,670,000 Listing Discount (from Last List Price) 7.1% 3.6% 9.4% $1,000 4Q 08 1Q 09 2Q 09 3Q 09 4Q 09 $700 4Q 08 4+ bedroom 3% $5,850,000 Listing Inventory 3,782 -16.9% 4,5491Q 09 -28.3% 09 2Q 3Q 09 4Q 09 5,273 Visit our website to browse listings and learn more about market trends prudentialelliman.com
- 4. Listing Discount 0% 4Q 08 1Q 09 30% 2Q 09 3Q 09 4Q 09 75 4Q 09 MANhAttAN MArket overvIew AVERAGE�PRICE�PER�SQ�FT�/�CONDO 20% Prudential douglas elliMan real estate Downtown East Side West Side Uptown $2,500 10% Luxury market Market Share New Development (Units) $2,000 and -12.5% in the fourth quarter, combined with inventory was comprised of 60% re-sales in the 2Q 09 3Q 09 4Q 09 0% a nominal decline in the quarter over quarter fourth quarter compared to 73% in the prior year $1,500 results suggests a near-term stabilization in quarter. Price indicators remained below Downtown East Side West Side Uptown prices. $1,000 Days on market expanded as listing discount prior year, but inventory declined Listing inventory declined sharply There were stabilized The days on market for a luxury sharply $500 1,384 listings of luxury apartments in the fourth property was 240 days, 71 days slower than the $0 169 days in the prior year quarter and 59 days Price indicators 08 4Q declined from1Q 09 quarter, down 20%09 prior quarter 2Q 09 3Q from the prior4Q 09 quarter year consistent with overall market Median sales total of 1,730 apartments and down 14.4% from LISTING�DISCOUNT�VS��DAYS�ON�MARKET�/�CONDO slower than the 181 days in the prior quarter. The price was $3,780,000 in the fourth quarter, 8.5% 1,616 apartments in the prior quarter. The decline 20% average luxury property took 36 days longer to 275 below the prior year quarter result of $4,132,516 in inventory reflects a combination of a higher sell than the overall market. In contrast, listing 16% and 3.2% below $3,905,000 in the prior quarter. overall level Daysactivity as compared to the first of On Market 250 discount was 4.3% in the current quarter, down 2Q 09 3Q 09 4Q 09 Average sales price was $4,863,673 in the current half of 2009 as well as the seasonal aspect of 12% 225 from 7.5% in the prior quarter and up nominally quarter, down 12.5% from the prior year quarter declining inventory in the final quarter of the from 4.1% in the prior year quarter. As a somewhat 8% average sales price of $5,559,502 and essentially year. There are several patterns in sales that are 200 200 historical anomaly, the listing discount for luxury unchanged from the $4,881,561 average sales emerging. Firstly, the number of luxury re-sale 4% Listing Discount 175 properties has been below overall market levels 175 price of Days On Market quarter. The year over year units increased 26% from the prior year quarter the prior for three of the past four quarters. 0% 150 change in average sales price09was -25.2% in 09 and the number of new development units fell 4Q 08 1Q 150 2Q 3Q 09 4Q 09 Note: This sub-category is the analysis of the top ten percent of all co-op and condo sales. The data is also contained within the co-op the second quarter, -15.7% in the third quarter 12.4% over the same period. Secondly, listing and condo markets presented. 125 AVERAGE�PRICE�PER�SQ�FT�/�LUXURY 100 Luxury Market Matrix AVERAGE�PRICE�PER�SQ�FT�/�LOFT Current Qtr % Chg Prior Qtr % Chg Prior Year Qtr $3,500 Average Sales Price $1,700 $4,863,673 -0.4% $4,881,561 -12.5% $5,559,502 2Q 09 3Q 09 4Q 09 75 $3,000 Average Price per Square Foot $1,500 $1,866 12.7% $1,655 -12.4% $2,131 Median Sales Price $3,780,000 -3.2% $3,905,000 -8.5% $4,132,516 $2,500 Downtown East Side West Side Uptown $1,300 Number of Sales 247 10.8% 223 8.3% 228 $2,000 $1,100 Days on Market (from Last List Date) 240 32.6% 181 42% 169 $1,500 $900 Listing Discount (from Last List Price) 4.3% 4.1% 7.5% $1,000 4Q 08 1Q 09 2Q 09 3Q 09 4Q 09 $700 4Q 08 Listing Inventory 1Q 09 2Q 09 3Q 09 1,384 4Q 09 -14.4% 1,616 -20% 1,730 LofT market $1,778,140 in the prior quarter. Price per square 623 unit total in the prior quarter. foot fell 16.7% to $1,056 from $1,268 in the prior Listing discount and days on market year quarter, but was up 2.8% from the prior expanded The average days on market for a loft Number of sales jumped as09listing 2Q 09 3Q 09 4Q quarter total of $1,027. apartment was 190 days in the fourth quarter, a discount expanded Number of sales jumped as inventory dropped month longer than the 160 days in the prior year 275 Pace of price declines eased Median sales price sharply There were 182 loft sales in the fourth quarter and 53 days longer than the 137 days on of a ManhattanOn Market Days loft apartment was $1,400,000 250 quarter, up 16.7% from 156 sales in the prior year market of the prior quarter. Listing discount also in the fourth quarter, down 31.7% from the prior quarter and up 46.8% from 124 units in the prior expanded, reaching 12.8% in the fourth quarter, 225 year quarter median sales price of $2,050,000 quarter. The number of sales was the highest nearly double the 6.5% listing discount of the and down 6.7% from $1,500,000 in the prior 200 total since the third quarter of 2008 and is prior year quarter and up from 7.7% from the quarter. Average sales price showed the same consistent with the 186 unit ten year quarterly prior quarter. 175 Note: This sub-category is the analysis of all co-op and condo loft pattern, reaching $1,746,274 in the fourth quarter, average. There were 486 listings in the current 2Q 09 150 sales available. The data is also contained within the co-op and down 26.1% 3Q 09 the prior year09 from 4Q quarter average quarter, down 30.4% from the 698 listing total in condo markets presented. sales price of $2,364,485 and down 1.8% from the prior year quarter and down 22% from the AVERAGE�PRICE�PER�SQ�FT�/�LOFT LOft Market Matrix Current Qtr % Chg Prior Qtr % Chg Prior Year Qtr $1,700 Average Sales Price $1,746,274 -1.8% $1,778,140 -26.1% $2,364,485 $1,500 Average Price per Square Foot $1,056 2.8% $1,027 -16.7% $1,268 Median Sales Price $1,400,000 -6.7% $1,500,000 -31.7% $2,050,000 $1,300 Number of Sales 182 46.8% 124 16.7% 156 $1,100 Days on Market (from Last List Date) 190 38.7% 137 18.8% 160 $900 Listing Discount (from Last List Price) 12.8% 7.7% 6.5% $700 4Q 08 1Q 09 2Q 09 3Q 09 4Q 09 Listing Inventory 486 -22% 623 -30.4% 698 ©2010 Prudential Douglas Elliman and Miller Samuel Inc. All worldwide rights reserved. easTsiDe 980 Madison Ave. 212.650.4800 • 575 Madison Ave. 212.891.7000 MiDTowN 425 East 58th St. 212.832.1666 • Prudential douglas elliMan Miller saMuel inc. 205 East 42nd St. 212.692.6111 • 485 Madison Ave. 212.350.8500 wesTsiDe 1995 Broadway 212.362.9600 • 2142 Broadway real estate real estate aPPraisers 212.769.2004 • 2169 Frederick Douglass Blvd. 212.865.1100 DowNTowN 90 Hudson St. 212.965.6000 • 26 West 17 St. 575 Madison Avenue 21 west 38th Street New York, NY 10022 New York, NY 10018 212.645.4040 • 137 Waverly Pl. 212.206.2800 • 51 East 10 St. 212.995.5357 • 690 Washington St. 212.352.5252 BrookLyN 156 212.891.7000 212.768.8100 Montague St. 718.780.8100 • 189 Court St. 718.522.2929 • 299 Bedford Ave. 718.486.4400 • 154 Seventh Ave. 718.840.2000 • prudentialelliman.com millersamuel.com 664 Fulton Street 718.780.8100 reNTaL 485 Madison Ave. 212.350.8500 reLoCaTioN 575 Madison Ave. 212.891.HOME For more information or electronic copies of this report please visit prudentialelliman.com/marketreports. Email report author Jonathan Miller ©2010. An Independently owned and operated member of the Prudential Real Estate Affiliates, Inc. is a service mark of Prudential Insurance Company of America Equal Housing Opportunity. All material presented herein is intended at jmiller@millersamuel.com with questions or comments. for information purposes only. While this information is believed to be correct, it is represented subject to errors, omissions, changes or withdrawal without notice. All property outlines and square footage in property listings are approximate.