1. SPWLA 39th Annual Logging Symposium, May 26-29, 1998
A CASE STUDY DEMONSTRATING HOW NMR LOGGING REDUCES
COMPLETION UNCERTAINTIES IN LOW POROSITY,
TIGHT GAS SAND RESERVOIRS
W. Scott Dodge, Exxon Exploration Company; Angel G. Guzman-Garcia, Exxon Production Research Company;
Dave A. Noble, Exxon Company U.S.A.; Jack LaVigne, Schlumberger Well Services; Ridvan Akkurt, NUMAR
ABSTRACT INTRODUCTION
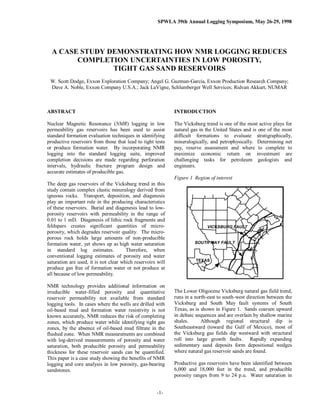
Nuclear Magnetic Resonance (NMR) logging in low The Vicksburg trend is one of the most active plays for
permeability gas reservoirs has been used to assist natural gas in the United States and is one of the most
standard formation evaluation techniques in identifying difficult formations to evaluate stratigraphically,
productive reservoirs from those that lead to tight tests mineralogically, and petrophysically. Determining net
or produce formation water. By incorporating NMR pay, reserve assessment and where to complete to
logging into the standard logging suite, improved maximize economic return on investment are
completion decisions are made regarding perforation challenging tasks for petroleum geologists and
intervals, hydraulic fracture program design and engineers.
accurate estimates of producible gas.
Figure 1 Region of interest
The deep gas reservoirs of the Vicksburg trend in this
study contain complex clastic mineralogy derived from
igneous rocks. Transport, deposition, and diagenesis
play an important role in the producing characteristics
of these reservoirs. Burial and diagenesis lead to low-
porosity reservoirs with permeability in the range of
0.01 to 1 mD. Diagenesis of lithic rock fragments and
feldspars creates significant quantities of micro- VICKSBURG FAULT
porosity, which degrades reservoir quality. The micro-
porous rock holds large amounts of non-producible
formation water, yet shows up as high water saturation SOUTH MAY FAULT
in standard log estimates. Therefore, when
conventional logging estimates of porosity and water
saturation are used, it is not clear which reservoirs will TEXAS
produce gas free of formation water or not produce at
all because of low permeability.
NMR technology provides additional information on
irreducible water-filled porosity and quantitative The Lower Oligocene Vicksburg natural gas field trend,
reservoir permeability not available from standard runs in a north-east to south-west direction between the
logging tools. In cases where the wells are drilled with Vicksburg and South May fault systems of South
oil-based mud and formation water resistivity is not Texas, as is shown in Figure 1. Sands coarsen upward
known accurately, NMR reduces the risk of completing in deltaic sequences and are overlain by shallow marine
zones, which produce water while identifying tight gas shales. Although regional structural dip is
zones, by the absence of oil-based mud filtrate in the Southeastward (toward the Gulf of Mexico), most of
flushed zone. When NMR measurements are combined the Vicksburg gas fields dip westward with structural
with log-derived measurements of porosity and water roll into large growth faults. Rapidly expanding
saturation, both producible porosity and permeability sedimentary sand deposits form depositional wedges
thickness for these reservoir sands can be quantified. where natural gas reservoir sands are found.
This paper is a case study showing the benefits of NMR
logging and core analysis in low porosity, gas-bearing Productive gas reservoirs have been identified between
sandstones. 6,000 and 18,000 feet in the trend, and producible
porosity ranges from 9 to 24 p.u. Water saturation in
-1-
2. SPWLA 39th Annual Logging Symposium, May 26-29, 1998
high-quality reservoirs may be as low as 30 s.u. but T2 AND PORE SIZE
recent development drilling in the trend is identifying The relaxation-time constant (T2) associated with the
pay with water saturation as high as 60 s.u. Energy exponential decay of the magnetization is an indicator
companies are currently pursuing lower quality of pore-size distribution.
Vicksburg reservoirs with permeability of 0.01 to 1.0
mD. Each NMR signal has initial amplitude that is
proportional to the total amount of hydrogen. The
Massive hydraulic fracture stimulation of one hundred NMR signal coming from hydrogen in a single small
thousand to four million pounds of proppant are used to pore results in a low amplitude response at a short T2.
enhance flow rates and increase the total recoverable The signal from hydrogen in a single large pore
gas reserves. The difficult mineralogy, high water provides a higher amplitude response at a long T2.
saturation, and low permeability make the economics
and mechanics of completion decisions complicated. Figure 2 NMR CPMG spin-echo response
This paper reviews quantitative petrographic core
analysis results prior to the NMR case study to show
the complexity of these reservoir sands.
Amplitude (mV)
APPLICATION OF NMR IN FORMATION
EVALUATION
NMR can provide information to the petrophysical-
logging suite formerly available only from core
measurements. Basic NMR measurements used in this 0 20 40 60 80 100
study are:
Time (msec)
Producible Porosity (Free Fluid Index)
Bulk Volume Irreducible Porosity (BVI) T2 DISTRIBUTION
Permeability The NMR signal amplitude provides a relative
Pore size distribution (T2 distribution) indication of the hydrogen content having a given
Fluid Identification (gas vs. producible water) relaxation time, T2. The T2 amplitude distribution for a
fully water-saturated sample is analogous to a pore-size
BACKGROUND distribution.
Nuclear Magnetic Resonance measures the fluid-filled
porosity of rocks by stimulating the hydrogen atoms Figure 3 shows an amplitude distribution where half of
associated with water and hydrocarbon in the pore the NMR signal is associated with small pores, or low
space. The hydrogen atoms are stimulated with a T2 values; and the remainder of the signal is attributed
strong magnetic field and a series of radio-frequency to hydrogen residing in larger pores, or large T2 values.
pulses. Removal of the radio-frequency stimulation
generates a measurable decay of hydrogen Figure 3 T2 distribution with calibrated cut-off
magnetization, known as a CPMG spin-echo train
(Carr, et. al., 1954; Meiboom, et. al., 1958), as 6
T 2 cutoff (40
Incremental Porosity (p.u.)
illustrated in Figure 2. The decay of the magnetization 5 msec)
provides information on the amount, type, and Swirr 49 s.u.
4
distribution of fluids filling the pore space. Porosity 16 p.u.
3 Perm 1.3 md
INTERPRETING THE NMR SIGNAL
2 Irreducible Producible
The maximum amplitude of the spin-echo train Porosity Porosity
1
represents the relaxation decay of the NMR signal. The 7.8 p.u. 8.2 p.u.
amplitude envelope of the NMR signal exhibits an 0
exponential decay that can be deconvolved to obtain the 0.1 1 10 100 1000
following information: T 2 (msec)
-2-
3. SPWLA 39th Annual Logging Symposium, May 26-29, 1998
POROSITY 9 seconds, resulting in logging speeds between 200 and
NMR measures fluid-filled porosity without the need to 300 ft/hr.
know anything about the rock matrix. The amplitude of
a proton NMR measurement is directly proportional to Despite logging in a high-pressure, high temperature
the amount of fluid in the material investigated, and environment (325 oF), the formation evaluation
corresponds to the total area under the curve Figure 3. objectives were easily met.
BOUND AND PRODUCIBLE FLUID PETROPHYSICS PROGRAM DESIGN (LOG
SATURATIONS AND CORE)
The producible-porosity or free-fluid index (FFI) is
A comprehensive petrophysics program was designed
determined by applying a cut-off to the T2 amplitude
so that the clastic gas reservoirs with complex
distribution. Free fluids are represented by that part of
mineralogy and low permeability could accurately be
the distribution to the right of the vertical cut-off line,
evaluated for producibility and identification of
as shown in Figure 3. The T2 cut-off was determined by
completion intervals. Wells drilled in the past
correlating the free-fluid volume with the volume of
encountered severe borehole washouts that degraded
fluid centrifuged from a sample. For this sandstone
log quality for most porosity measuring devices. The
sample, a T2 cut-off of 40 milliseconds was determined.
first well in the recent drilling program was drilled with
For carbonate samples the cut-off value is generally
synthetic oil-based mud (OBM) to improve borehole
higher, e.g., 92 milliseconds (Straley, et. al., 1991;
stability. This was very successful, resulting in little to
Chang, et. al., 1994).
no borehole enlargement through the primary
reservoirs.
The bound-fluid volume is the area under the T2
distribution to the left of the cut-off in Figure 3.
PETROPHYSICS LOGGING PROGRAM
PERMEABILITY The petrophysical wellbore logging program consisted
of the following tools with a description of the
NMR does not directly measure permeability; but NMR
measurement objectives of each in Table 1.
does measure petrophysical parameters that can be used
to predict permeability. Using these parameters,
Table 1 Petrophysical well logs
empirical permeability models have been developed;
these simple models are valid for single-phase porous LOGGING TOOL MEASUREMENT
systems with low clay content and without secondary Array Induction High resolution resistivity
porosity (Prammer, et. al., 1994). Litho-Density Bulk density
Accelerator Porosity Epithermal neutron
At the current time, such empirical permeability Sonde porosity, Capture X-sect
equations are not applicable to all formations. The Natural GR Spectroscopy Potassium, Thorium,
equations should be used semi-quantitatively and after Uranium
calibration with core. Array Sonic Compressional Slowness
Formation Micro- Structural, stratigraphic
scanning Imager and net sand thickness
NMR LOG JOB PLANNING
Formation Tester Pressures and samples
Rotary Sidewall Cores Petrophysical properties
Candidate screening and pre-job planning are two
NMR Producible porosity, BVI,
critical components identified by Exxon to obtain a
Permeability, Pore-size
successful NMR log (Akkurt, et. al., 1996; Morriss, et.
distribution, Fluid
al., 1996). Starting with a well-defined set of formation
identification
evaluation objectives, the process involves optimization
of the acquisition parameters and requires close
cooperation between the energy and service companies. ACQUISITION OF WHOLE CORE
To interpret reservoir quality and producibility from
The NMR log objectives for the South Texas wells wireline logs, 160 feet of whole core and 48 rotary
were the determination of bound-fluid, free-fluid and sidewall cores were cut in the first NMR logged well.
permeability. The most important acquisition A core analysis program was designed to quantify
parameter was the wait time (Tw). Logging in oil-based formation petrography, petrophysics and reservoir
mud at high temperatures required Tw varying from 3 to engineering rock properties.
-3-
4. SPWLA 39th Annual Logging Symposium, May 26-29, 1998
PETROGRAPHY AND NMR PETROPHYSICAL Figure 7. Grains labeled a, b, and c are felsic volcanic
RESULTS FROM CORE ANALYSIS rock fragments, grains d and e are clay-rich rock
fragments, and grain f is plagioclase feldspar. The
MINERALOGY, MORPHOLOGY AND MICRO- back-scattered electron SEM image of the same thin-
POROSITY OF RESERVOIR SANDS section is shown in Figure 8.
A petrographic study including thin-section
photomicrographs, point count analysis, scanning A gray scale image analysis technique is performed on
electron microscope images (SEM), grain-size analysis, each individual grain to measure the micro-porosity.
X-ray diffraction/X-ray fluorescence, MINQUANT and Once a database of micro-porosity by grain type is
SEM MICROQUANT were performed on end-cuts developed, the results can be used in a forward
from all core plugs that underwent NMR core analysis. petrophysical mineral model to measure total micro-
A significant number of detrital and diagenetic minerals porosity from well logs.
were identified that contained micro-porosity.
Corrected thin-section porosity compares well to core
An example of a good-quality reservoir rock is helium porosity by adding the product of the measured
described in detail in the following analyses. This micro-porosity for each grain type times the fractional
sample is from the Well C at a depth of xx208 ft, which amount of that grain present in a sample Figure 4.
is shown on the logs of Figures 13 and 14. The core
plug sample permeability was 1.3 mD and porosity was Figure 4 Thin-section correction for micro-porosity
16 p.u. A thin-section photomicrograph from this
PLUG POROSITY (p.u.) .
25
sample is shown in Figure 5. The sample is described
as arkosic sandstone containing 3 percent quartz, 31 20 1:1
percent feldspar, and 27 percent rock fragments with 15
the remainder as pore filling cement and clay. The
micro-porosity
thin-section shows good porosity with significant 10
quantities of yellow-stained feldspars and dark brown TS + MICQ POROSITY
5
volcanic rock fragments. A unique property of these TS POROSITY
sands is the high concentration of diagenetic feldspar 0
overgrowths, with 14 volume percent in this sample. 0 5 10 15 20 25
THIN-SECTION (TS) POROSITY (p.u.)
An SEM photomicrograph shown in Figure 6 illustrates
abundant diagenetic pore-filling chlorite as well as
feldspar overgrowths. MINQUANT (Chakrabarty, et. NUCLEAR MAGNETIC RESONANCE CALIBRATION
al., 1997), a quantitative bulk rock mineral analysis OF IRREDUCIBLE WATER AND PERMEABILITY
based on XRD/XRF measurements and a technique
One of the strengths of NMR in formation evaluation is
developed at Exxon Production Research Company,
the ability to simulate logging conditions in the
shows the mineral concentration in weight percent of
laboratory using NMR spectrometry on core. When
this same sample in Table 2. The contribution of both
making NMR measurements on core, it is important to
potassium feldspar and albite makes up 51 weight
design the experiments to have the same acquisition
percent of the rock while the total clay content is 9
parameters as the logging tool if the goal is core-to-log
percent.
calibration. Specifically magnetic field strength
(homogeneous or gradient), echo spacing, recovery
Table 2 MINQUANT Results (Wt%), Sample xx208 ft
time and the CPMG pulse sequence should be
Qtz Kfeld Albt Calc Chlor Illite Smec equivalent.
24 13 38 15 5 3 1
A laboratory T2 relaxation distribution for the sample
Although the visible porosity point counted in this from xx208 feet fully saturated with OBM filtrate and
sample is only 3 p.u. the measured core porosity is 16 formation water is shown in Figure 3. The bi-modal T2
p.u. This discrepancy between point-count porosity and distribution indicates that this sample with 9 percent
core-helium porosity suggests there is significant clay contains both large pores and small pores. The
micro-porosity in this sample. An accurate method, signal amplitude represents clay and capillary bound
which measures intra-granular micro-porosity, irreducible water less than 40 msec.
developed at Exxon Production Research Company, is
called SEM MICROQUANT. A thin-section
photomicrograph from the same sample is shown in
-4-
5. SPWLA 39th Annual Logging Symposium, May 26-29, 1998
Figure 5 Thin-section photomicrograph of a 1.3 Figure 6 SEM photo-micrograph shows pore-
mD arkosic sandstone. Quartz 3%, Feldspar filling 5% diagenetic chlorite and 13% feldspar
31%, Lithics 27%, Cements and Clay 26%. overgrowths.
Figure 7 Thin-section photomicrograph of a Figure 8 Backscatter SEM image used in SEM
highly micro-porous volcanic, clay-rich rock. MICROQUANT analysis.
-5-
6. SPWLA 39th Annual Logging Symposium, May 26-29, 1998
Air-brine drainage capillary pressure measured at 50 psi Figure 9 Well A produced significant water
yields an irreducible water saturation of 49 s.u. for this volume from two separate test intervals.
sample. NMR irreducible water saturation measured on
core plugs containing OBM filtrate and connate water
obtained a calibration to capillary pressure by using a 30HU
40 msec T2 cut-off (Shafer, et. al., 1998). Calibration of 370
Mcf/D
NMR T2 cut-off time to drainage capillary pressure 70
brings equivalence of NMR FFI to producible porosity. BWPD
Producible porosity is defined as the pore volume x950
available to hydrocarbon emplacement (Dodge, et. al.,
1996).
x000
30HL
NMR permeability has been calibrated to air
permeability at net confining pressure with a modified
Coates relationship, 750
Mcf/D
800
1.7
φ 2 FFI10 ms
BWPD
k NMR =
...................... (1)
24.8 BVI10 ms
x100
so that the split between FFI and BVI for the purposes 5
Caliper
15 1
90 in Resisitivity
100 0.25
Density Porosity
of permeability calibration are obtained with a 10ms T2 Gamma Ray 30 in Resisitivity Neutron Porosity
0 150 1 100 0.25
cut-off which is discussed by Shafer, 1998. 10 in Resisitivity
1 100
CASE STUDY EXAMPLES
water is fresh, it is difficult to discriminate water from
This section presents nine different reservoir examples gas based on resistivity.
from South Texas. Some examples contain known or
tested water sands, six of the examples were production The well was first completed over a 14-ft interval in the
tested and contain NMR logs. Test results from the 30HL reservoir. A 100,000-lb. proppant frac was
wells in this case study are shown in Table 3. pumped with 300 bbls of frac fluid. The well on test
produced 750 Mcf/d and 800 BWPD.
Table 3 Production Test Results
WELL SAND PERFS FRAC TEST
The 30HL sand was deemed to be uneconomic and was
(ft) (lb.) RATES isolated by a bridge plug. The 30HU reservoir sand
A 30HL xx041-xx058 100,000 750 Mcf/D was then completed over a 27-ft interval. A 50,000-lb.
800 BWPD proppant frac was pumped and the well was flow tested
A 30HU xx917-xx944 50,000 370 Mcf/D at a rate of 370 Mcf/D and 70 BWPD. To be economic,
70 BWPD these wells must produce upward of 2 MMcf/d with
C H390 xx818-xx946 240,000 4.8 MMcf/D
little to no associated formation water.
C H454 xx162-xx221 240,000 800 Mcf/D
D H390 xx914-xx083 300,000 6.2 MMcf/D
D H454 xx222-xx342 300,000 1.3 MMcf/D WELL B, H390 RESERVOIR, CORED GAS SAND
158 BWPD Well B is drilled in an up-dip structural position to
E H390 xx991-xx197 300,000 5.6 MMcf/D
known gas production and contains 92 ft of
conventional core as shown in Figure 10. Drilling took
WELL A, HIGH RATE WATER PRODUCTION place before NMR logging in this field. The H390
Well A, drilled and tested in a different reservoir than reservoir is a primary successful gas producer and will
the other examples, illustrates the difficulties in be shown in the next three well examples with NMR
identifying productive gas reservoirs from those logs.
containing mobile water. The conventional logs shown
in Figure 9 indicate the reservoir to be gas bearing The reservoir has been characterized previously by
because of the good resistivity response and mud log petrography, SEM, MINQUANT and SEM
shows in 10 to 15 p.u. sands. Because the formation MICROQUANT data and shown to be highly micro-
porous because of diagenetic processes occurring in this
-6-
7. SPWLA 39th Annual Logging Symposium, May 26-29, 1998
Figure 10 Well B H390 good quality reservoir Figure 11 Well B, H390 reservoir, primary
conventionally cored containing good gas shows. drainage air-brine centrifuge capillary pressure
water saturation correlates with permeability.
xx750
H390 100 200
4.6 md, 16.4 p.u.
xx800
1.0 md, 13.9 p.u.
Capillary Pressure (psig)
75 150
Height (ft)
xx850
50 100
25 50
xx900
Caliper 90 in Resisitivity Density Porosity
5 15 1 100 0.25 0 0
Gamma Ray 30 in Resisitivity Neutron Porosity
0 150 1 100 0.25
0 10 20 30 40 50 60 70 80 90 100
10 in Resisitivity
1 100 Water Saturation (s.u.)
reactive feldspar and lithic-bearing sandstone. within 50 feet of the gas-water-contact, water saturation
Significant amounts of clay, feldspar and carbonate is significantly high. This will be apparent in the
cement precipitate in pore throats and bodies, reducing following examples as measured by both conventional
porosity and permeability. The porosity shown in track
3 ranges from a high of 22 p.u. with 48 mD Figure 12 Well B, H250 wet reservoir log
permeability at xx826 ft in a very fine grained sand, to a response. Note invasion profile (WBM) and
low of 4 p.u. and 0.002 mD at xx817 ft in a very fine density/neutron shale separation.
grained calcareous sand.
xx300
Air-brine centrifuge primary drainage capillary pressure H250
measurements on two samples from the H390 reservoir
are shown in Table 4 and Figure 11. These samples
represent the better quality Vicksburg reservoirs. It is xx350
shown from core analysis (Shafer, et. al., 1998) that
permeability and irreducible water saturation are
highly correlated, which is a pre-requisite of formation
petrophysical properties for NMR permeability logging xx400
to be successful.
Table 4 Well B, H390 reservoir core analysis
DEPTH PERM POROSITY Swirr
xx450
(ft) (mD) (p.u.) (s.u.)
xx790.4 4.6 16.4 29
xx788.5 1.0 13.9 38
Gas column heights can be as great as 200 feet; Caliper
xx500
90 in Resisitivity Density Porosity
however, these low permeability reservoirs are almost 5
Gamma Ray
15 1
30 in Resisitivity
100 0.25
Neutron Porosity
entirely in the gas-water transition zone as defined by 0 150 1 100 0.25
10 in Resisitivity
capillary pressure. For wells penetrating the reservoir 1 100
-7-
8. SPWLA 39th Annual Logging Symposium, May 26-29, 1998
Figure 13 Well C H250 reservoir updip of Well Figure 14 NMR log across conventional core
B. Less density/neutron shale response caused interval. Good NMR permeability and porosity
gas effect. calibration shown.
H250 H250
xx200 xx200
xx250 xx250
xx300 xx300
xx350 xx350
Caliper 90 in Resisitivity Density Porosity Core Perm NMR Swirr Total Porosity T2 Cutoff
5 15 1 100 0.25 0 0.001 10 1 0 0.25 0 0.3 3000
Gamma Ray 30 in Resisitivity Neutron Porosity NMR Perm Swt NMR Porosity T2 Distribution
0 150 1 100 0.25 0 0.001 10 1 0 0.25 0
10 in Resisitivity
Free Water NMR Bound Fluid
1 100
NMR Free Fluid
resistivity-based water saturation and NMR irreducible gas was recovered at xx266 ft. Comparison of the
water saturation. density/neutron separation between the two wells in
Figures 12 and 13 reveals a gas effect in Well C,
WELL B, H250 WATER RESERVOIR although due to the complex mineralogy, no gas
The last example of wells drilled before NMR logs is crossover occurs.
shown for Well B in Figure 12. The H250 reservoir
sand was drilled with poor mud-log shows and no trip WATER SATURATION
gas. A fresh WBM with viperlube oil additive was The NMR log in Figure 14 shows an interval of 160 ft
used and the contrast between fresh mud filtrate and in the H250 reservoir of conventional core porosity and
saline formation water can be seen by the large invasion permeability measurements compared to NMR. Track
profile on the resistivity log. Also, observe the 1 shows the result of NMR-calibrated permeability to
apparent separation of the density/neutron porosity core permeability at reservoir stress. Track 2 contains
measurements in what appears to be high quality sand. the conventional resistivity-derived total water
The next example shows the log responses for this saturation (Swt) using a dual-water saturation model.
reservoir when it is bearing gas. Additionally, NMR irreducible water saturation (Swirr) is
derived from the following relationship,
WELL C, H250 GAS-BEARING RESERVOIR
This example is the first well to have an NMR log run BVI
Swirr = ........................... ...........................(2)
in the development of the Vicksburg gas reservoirs. φ
Well C contained an extensive formation-evaluation
program which entailed extensive core, core analysis, where NMR measured BVI and φ are taken on a total
and synthetic OBM drilling fluid to improve log pore volume basis using total porosity data acquisition
measurements and the first integrated NMR core and and processing (Prammer, et. al., 1996; Freedman, et.
log program. The conventional logs for the H250 al., 1997). This is essential when making the
reservoir in Well C are shown in Figure 13. comparison of Swt to Swirr. The very basic application of
NMR for determination of mobile formation water is
Reservoir H250 is known to be gas bearing despite the premise that when the following condition applies,
formation resistivity as low as 1.5 ohmm. The H250
reservoir has not been production tested to date; S wt > S wirr ........................... ...........................(3)
however, a formation test sample containing 18.2 cf of
-8-
9. SPWLA 39th Annual Logging Symposium, May 26-29, 1998
Figure 15 Well C H390 primary producing gas Figure 16 Good flow rate from 150 ft gross
reservoir. 24,000 lb. frac proppant. interval. Note high amount of NMR bound fluid.
xx800 xx800
H390 H390
4.8
MMcf/D
xx850 xx850
xx900 xx900
xx950 xx950
Caliper 90 in Resisitivity Density Porosity Core Perm NMR Swirr Total Porosity T2 Cutoff
5 15 1 100 0.25 0 0.001 10 1 0 0.25 0 0.3 3000
Gamma Ray 30 in Resisitivity Neutron Porosity NMR Perm Swt NMR Porosity T2 Distribution
0 150 1 100 0.25 0 0.001 10 1 0 0.25 0
10 in Resisitivity
Free Water NMR Bound Fluid
1 100
NMR Free Fluid
the water saturation in the reservoir is above irreducible example. Throughout the reservoir formation
conditions and that the relative permeability to water is resistivity is observed as low as 2 ohmm and increases
greater than zero. When these two independently to 8 ohmm in better quality sands. Above xx850 ft, the
derived water saturation are equivalent, the water is at density/neutron porosity measures as high as 20 p.u.,
irreducible conditions and is immobile. In the H250 but the formation resistivity is only 2 to 4 ohmm.
reservoir, the NMR Swirr is equivalent to Swt derived
from resistivity measurements; hence, the water in the The NMR log, with completion data, is shown in Figure
reservoir is immobile, except for the high permeability 16. Laboratory-measured core permeability and
sand at xx275 ft, which will be avoided in the porosity obtained from rotary sidewall core plug
completion. compares well with NMR log measurements. In thin-
bedded sands below xx900 ft, the agreement is poor.
POROSITY Throughout the reservoir, both NMR and resistivity-
A comparison of core porosity to total porosity derived derived water saturation agree, leading to the
from conventional logs is shown in track 3. interpretation that the reservoir does not contain
Additionally, NMR porosity is shown partitioned into moveable water. The significant fraction of NMR
two components: bound fluid and free fluid. Both log bound fluid in the pore space in track 3 is supported by
total porosity and NMR porosity compare well to core core petrographic measurements that these sands
porosity in the H250 reservoir. The free fluid portion is contain significant quantities of micro-porosity.
equivalent to producible porosity from calibrating the
core NMR measurements to capillary pressure. The well was perforated over three short intervals to
promote a more effective hydraulic fracture consisting
The NMR derived T2 distribution is shown in track 4. of a 240,000-lb. proppant frac job. The well flowed gas
Sands containing macro-porosity filled with OBM at a rate of 4.8 MMcf/d with no formation water during
filtrate are seen by large amplitudes to the right of the the production test.
T2 cut-off between xx250 and xx280 ft.
WELL C, H454 TIGHT-GAS RESERVOIR
WELL C, H390 GAS-BEARING RESERVOIR The H454 gas reservoir in Well C is shown in Figure
Figure 15 shows the first NMR log in the H390 gas 17, is characterized by resistivity in the 3 to 4 ohmm
reservoir discussed previously in the Well B, H390, range and porosity between 10 and 15 p.u. One of the
-9-
10. SPWLA 39th Annual Logging Symposium, May 26-29, 1998
Figure 17 Well C H454 reservoir containing Figure 18 Low gas flow rates measured from two
good porosity. Pumped 240,000 lb. frac proppant intervals containing low perm and high Swirr.
xx150 xx150
H454 H454
900
Mcf/D
xx200 xx200
800
Mcf/D
xx250 xx250
Caliper 90 in Resisitivity Density Porosity Core Perm NMR Swirr Total Porosity T2 Cutoff
5 15 1 100 0.25 0 0.001 10 1 0 0.25 0 0.3 3000
Gamma Ray 30 in Resisitivity Neutron Porosity NMR Perm Swt NMR Porosity T2 Distribution
0 150 1 100 0.25 0 0.001 10 1 0 0.25 0
10 in Resisitivity
Free Water NMR Bound Fluid
1 100
NMR Free Fluid
problems encountered in some wells is completing low- interval above xx970 ft has a high GR response caused
permeability gas sands that flow at uneconomic rates. by the higher feldspar content in these sands.
The NMR log in Figure 18 compares well to rotary NMR porosity measures too high when affected by hole
side-wall core porosity and permeability above xx200 enlargement, which is observed over the interval from
ft, while the NMR log permeability is underestimated xx960 to xx980 ft in Figure 20. The caliper in Figure
relative to the core permeability below this depth. Core 19 shows a washout over this interval. The NMR T2
and NMR permeability measurements are in the 0.02 to distribution in track 4 exhibits the trait of high
0.07 mD range. In track 2, Swt based on resistivity is amplitude at early time caused by this enlarged hole
lower than NMR Swirr. This is an artifact of either the size. Hence, high NMR porosity and T2 amplitude at
NMR Swirr or the resistivity-based Swt is determined early time are reliable indicators of invalid NMR
incorrectly and cannot occur as indicated by Equation measurements.
3. If NMR Swirr is not in error, then NMR can assist in
calibrating electrical resistivity saturation parameters. Over the H390 reservoir interval from xx900 to xx960
This is a similar process to calibrating log-based water ft good permeability and low water saturation are seen
saturation to capillary pressure water saturation. in tracks 1 and 2. Increased NMR free fluid and higher
amplitude at later time in the T2 distributions indicates
Two perforation intervals were tested separately that this interval contains the highest reservoir quality.
following a 240,000-lb. proppant frac. On the lower Comparison of Swt to Swirr indicates that no mobile
perforated interval below xx200 ft, the well flowed at water is present over the major portions of the
800 Mcf/D, whereas the upper interval tested at 900 permeable gas sands. The reservoir is at irreducible
Mcf/D. These rates were sub-economic and the water saturation.
reservoir was abandoned due to recompletion problems.
This well flowed at a rate of 6.2 MMcf/d on a 16/64-
WELL D, H390 GAS-BEARING RESERVOIR inch choke with no formation water from five discrete
In Well D and Well E the Vicksburg reservoirs are in a 6-ft perforated intervals after pumping a 300,000-lb.
down-thrown fault block adjacent to Wells B and C. proppant frac.
Figure 19 shows the H390 reservoir has low resistivity
(2 to 10 ohmm) while the more porous reservoir
-10-
11. SPWLA 39th Annual Logging Symposium, May 26-29, 1998
Figure 19 Well D H390 reservoir has good Figure 20 Good flow rates over 150 ft reservoir.
porosity opposite high GR zone. 300,000 lb. frac NMR high porosity due to washout at xx975 ft.
xx900
H390 H390
xx950 xx950
6.2
MMcf/D
xx000 xx000
xx050 xx050
Caliper 90 in Resisitivity Density Porosity NMR Perm NMR Swirr Total Porosity T2 Cutoff
5 15 1 100 0.25 0.001 10 1 0 0.25 0 0.3 3000
Gamma Ray 30 in Resisitivity Neutron Porosity Swt NMR Porosity T2 Distribution
0 150 1 100 0.25 1 0 0.25 0
10 in Resisitivity
Free Water NMR Bound Fluid
1 100
NMR Free Fluid
WELL D, H454 GAS AND WATER RESERVOIR The NMR log in Figure 24 shows good permeability,
The deeper, lower-quality H454 reservoir shows low water saturation, high free fluid and stronger T2
stratified porosity from xx220 to xx370 ft in Figure 21. signal amplitude at late times above xx060 ft. Well E
Resistivity ranges from 1 to 4 ohmm and porosity from was completed over seven intervals from xx991 to
10 to 15 p.u. in the reservoir sand. The NMR log in xx197 ft and fracture stimulated with 300,000-lb.
Figure 22 shows the majority of the interval contains no proppant. A zone that has the potential to produce
free fluid except in a small interval above xx300 ft. The water was not perforated at xx100 ft. The sand appears
improvement in reservoir quality can be seen in the to contain a reasonable porosity of 12 p.u., with a low
NMR permeability, Swirr, free fluid and increased amount of free fluid, but there is some indication that
amplitude at later time in the T2 distributions. mobile water exists in this pore space with Swt greater
than NMR Swirr. On test, the well produced gas at 5.6
The well was perforated over three 7-ft intervals from MMcf/D with no formation water.
xx222 to xx342 ft and fracture stimulated with 300,000-
lb. proppant. On test, the well flowed 1.3 MMcf/D and SUMMARY
158 BWPD. Although not easily apparent in track 2,
the resistivity derived Swt is greater than NMR Swirr in Nuclear Magnetic Resonance is shown to improve
the primary sand above xx300 ft indicating the presence completion decisions in mineralogically complex
of both gas and mobile formation water. The thin 0.1- reservoirs having high irreducible water saturation.
mD sand measured by the NMR log is verified by the Understanding the petrophysical controls on these
low flow rates. reservoirs was achieved through up-front planning of a
comprehensive formation evaluation program which
WELL E, H390 GAS-BEARING RESERVOIR included cutting conventional core, core analysis and a
rigorous wireline logging program including NMR.
Well E is approximately 100 ft down-dip of Well D,
presenting a greater risk that reservoir H390 is water-
Through integration of core analysis and quantitative
bearing or contains mobile water associated with the
petrographic analysis of reservoir core, it was identified
gas. Figure 23 shows low resistivity over the porous
that high irreducible water saturation was caused by
reservoir sands, none the less, there is a small amount
high levels of micro-porosity within the arkosic
of density/neutron gas crossover in track 3.
sandstones that also contained large amounts of reactive
-11-
12. SPWLA 39th Annual Logging Symposium, May 26-29, 1998
Figure 21 Well D H454 reservoir, contains thinly Figure 22 Low gas flow rate with little NMR free
bedded sands. 300,000 lb. frac fluid porosity or permeability. Swt > Swirr
xx200
H454 H454
xx250 xx250
1.3
MMcf/D
158
BWPD
xx300 xx300
xx350 xx350
Caliper 90 in Resisitivity Density Porosity NMR Perm NMR Swirr Total Porosity T2 Cutoff
5 15 1 100 0.25 0.001 10 1 0 0.25 0 0.3 3000
Gamma Ray 30 in Resisitivity Neutron Porosity Swt NMR Porosity T2 Distribution
0 150 1 100 0.25 1 0 0.25 0
10 in Resisitivity Free Water NMR Bound Fluid
1 100
NMR Free Fluid
rock fragments. Micro-porosity was quantified using mobile formation water using NMR is dependent upon
SEM MICROQUANT and showed that feldspars, accurate computation of resistivity-based water
chlorite cement, felsic, mafic-volcanic and clay-rich saturation or bulk volume water. Errors can result in
sedimentary rock fragments contain as much as 15 to NMR estimates of mobile formation water if electrical
45 percent micro-porosity. properties of the rocks or connate water are uncertain.
Laboratory NMR Swirr measurements on as-received NOMENCLATURE
core samples containing both OBM mud filtrate and
connate water required a T2 cut-off of 40 msec to BVI bulk volume irreducible pore volume
calibrate to primary drainage capillary pressure Swirr. BWPD barrels water per day
NMR permeability based on the Coates relationship FFI free-fluid index
was calibrated to core permeability measured at net- Mcf/d thousand cubic feet per day
confining pressure. It was shown in Well C that when MMcf/d million cubic feet per day
calibrated to core, NMR log permeability, porosity and mD milli-Darcy
irreducible water saturation provide good estimates of φ porosity
these reservoir petrophysical parameters. p.u. porosity units (percent of bulk volume)
s.u. saturation units (percent of pore volume)
Using conventional logs numerous wells were Sw water saturation
completed and either produced formation water, or gas Swirr irreducible water saturation
at uneconomic rates. This study shows that the high Swt total water saturation
levels of micro-porosity result in high irreducible water Tw wait time between CPMG echo train (msec)
saturation from 50 to 70 s.u. Even at this high T2 relaxation time constant (msec)
saturation, gas wells can flow water-free rates as high
as 6 MMcf/D. NMR logs have identified several ACKNOWLEDGEMENTS
reservoirs that contain mobile formation water and were
not included in the completion program. We want to acknowledge the following people
responsible for permitting the authors time to write this
Production in these Exxon fields has tripled since the paper and to others who made valuable contributions:
advent of NMR logging and quantitative reservoir Donal Mageean, Fritz Merz and Khushari Zainun of
analysis. Finally, it is important to note that identifying Exxon Exploration Company; Quinn Passey, Lee Esch,
-12-
13. SPWLA 39th Annual Logging Symposium, May 26-29, 1998
Figure 23 Well E H390 reservoir, good porosity Figure 24 High gas flow rate albeit small NMR
development. 300,000 lb. frac free-fluid. Fair permeability in upper zone.
H390 H390
5.6
MMcf/D
xx050 xx050
xx100 xx100
xx150 xx150
xx200 xx200
Caliper 90 in Resisitivity Density Porosity NMR Perm NMR Swirr Total Porosity T2 Cutoff
5 15 1 100 0.25 0.001 10 1 0 0.25 0 0.3 3000
Gamma Ray 30 in Resisitivity Neutron Porosity Swt NMR Porosity T2 Distribution
0 150 1 100 0.25 1 0 0.25 0
10 in Resisitivity
Free Water NMR Bound Fluid
1 100
NMR Free Fluid
Bob Klimentidis, Ken Dahlberg, John Shafer, and Bill Permeability in Carbonates from NMR Logging",
Reese of Exxon Production Research Company; Neal SPWLA Transactions, Paper A.
Desmarais and Amy Omar of Exxon Company U.S.A.;
Dale Logan and Jack Horkowitz of Schlumberger Dodge, W.S., Shafer, J.L., Klimentidis, R.E., 1996,
Wireline; and Dwayne Weaver of NUMAR. Special "Capillary Pressure: The Key to Producible Porosity",
thanks to Exxon Company U.S.A., Exxon Exploration SPWLA 37th Annual Logging Symposium, Paper J.
Company, Exxon Production Research Company,
Schlumberger Wireline and NUMAR for permission to Freedman, R., Boyd, A., Gubelin, G., McKeon, D.,
publish this paper. Morriss, C.E., Flaum, C., 1997, “Measurement of Total
NMR Porosity adds new value to NMR Logging”,
REFERENCES CITED SPWLA 38th Annual Logging Symposium, Paper OO.
Akkurt, R., Prammer, M.G., Moore, M., 1996, Meiboom, S., Gill, D., 1958, "Compensation for pulse
"Selection of Optimal Acquisition Parameters for imperfections in Carr-Purcell NMR experiments", Rev.
MRIL Logs", SPWLA 37th Annual Logging Sci., Instrum., 29, p688.
Symposium.
Morriss, C.E., Deutsch, P., Freedman, R., McKeon, D.,
Carr, H.Y., Purcell, E.M., 1954, "Effects of diffusion on Kleinberg, R.L., 1996, "Operating Guide for the
free precession in NMR experiments", Physical Combinable Magnetic Resonance Tool", The Log
Review, Vol. 94, p630. Analyst, November-December.
Chakrabarty, T., Longo, J., 1997, "A New Method for Prammer, M. G., 1994, "NMR Pore Size Distribution
Mineral Quantification to aid in Hydrocarbon and Permeability at the Well Site", SPE 69th Annual
Exploration and Exploitation", Journal of Canadian Technical Conference, Paper SPE 28368.
Petroleum Technology, December, Vol. 36, No. 11, pp.
15-21. Prammer, M.G., Drack, E.D., Bouton, J.C., Gardner,
J.S., Coates, G.R., Chandler, R.N., Miller, M.N., 1996,
Chang, D., Vinegar, H., Morriss, C., and Straley, C., "Measurements of Clay-Bound Water and Total
1994, "Effective Porosity, Producible Fluid and Porosity by Magnetic Resonance Logging", SPE 36522,
-13-
14. SPWLA 39th Annual Logging Symposium, May 26-29, 1998
SPE Annual Technical Conference, Denver Co, USA, Engineering Department of Schlumberger in Houston.
6-9 October. In this position, Jack was responsible for the
development of Schlumberger's petrophysical
Shafer, J.L., Dodge, W.S., Noble, D.A., 1998, "A Case interpretation software.
Study: NMR Core-to-Log Calibration for Tight Gas
Sand Reservoirs", SPWLA 39th Annual Logging Ridvan Akkurt prior to founding NMRPlus Inc. worked
Symposium. for NUMAR, Shell Offshore Inc., Schlumberger
Overseas, Schlumberger-Doll Research and GSI, in a
Straley, C., Rossini, D., Vinegar, H., Tutunjian, P., and variety of field and research assignments in geophysics
Morriss, C., 1991, "Core Analysis by Low Field NMR", and petrophysics. He has a BSc. Degree in Electrical
Society of Core Analysts Symposium, Paper 9406. Engineering from Massachusetts Institute of
Technology and a PhD. Degree in Geophysics from the
ABOUT THE AUTHORS Colorado School of Mines. Dr. Akkurt has several
publications in the area of NMR logging and has served
Scott Dodge is a senior exploration geologist with as a Distinguished Lecturer for SPWLA. He is a
Exxon Exploration Company in Houston, Texas. He member of SPWLA and SPE.
holds a BSc. Degree in Mechanical Engineering from
Kansas State University and MSc. Degree in Petroleum
Engineering from University of Southern California.
He has served as President of the Formation Evaluation
Society of Victoria Australia, as well as SPWLA
Distinguished Lecturer during 1996 to 1998. Scott
joined Exxon in 1982 and has worked in the U.S.A.,
Canada and Australia as a Formation Evaluation
Specialist. He is a member of the SPWLA, SPE,
AAPG and Society of Core Analysts.
Angel Guzman-Garcia has a PhD. Degree in Chemical
Engineering from Tulane University. Since 1990, he
has been working at Exxon Production Research in the
area of petrophysics. His current assignment is in the
fundamentals of NMR and applications to petrophysical
interpretation. After verification of NMR principles in
the laboratory, he is involved in the design, witnessing,
and processing of NMR well-log data. He is a member
of SPWLA, SPE, and AIChE.
Dave Noble is a senior exploitation geologist with
Exxon Company, USA. He received a BSc. Degree in
Geology at Brigham Young Univeristy. Dave started
with Exxon Exploration in 1978, working in East
Texas, South Texas, and the Gulf of Mexico. In 1984
he transferred to the South Texas production
department which is now the Houston Production
Organization where Dave is now located. He has spent
the past 15 years as a geologist working the Vicksburg
and Frio formations.
Jack LaVigne is the lead petrophysicist for the Houston
Area. He holds a BSc. Degree in Electrical
Engineering from the University of Minnesota,
graduating in 1971. Jack joined Schlumberger in 1975
as a field engineer and log analyst in the Permian Basin
Division. Prior to joining the Houston Area, he worked
as a development engineer in the Interpretation
-14-