2. INTRODUCTION
Used since : 1945 AD
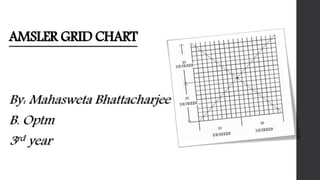
Developed by : Marc Amsler, swiss ophthalmologist.
Looks like a graph paper with multiple small sized boxes on it having a center dark spot.
The Amsler grid is a tool that opticians use to detect vision problems resulting from damage
to the macula (the central part of the retina) or the optic nerve. The damage may be caused by
macular degeneration or other eye diseases, so the Amsler grid is useful in detecting these problems.
An early diagnosis may help to limit or at least slow the vision loss.
The grid chart evaluate the central 20 degree of the visual field. It is a diagnostic tool that is
used mainly in screening, detection and monitoring macular diseases(e.g. Macular degenerations,
epi retinal membranes)as well as the optic nerve and the visual pathway.
3. Procedure
•Before starting the test, patient's near and distance vision should be corrected to normal. If the patient
is wearing spectacles, testing should be done with glasses only.
•In a well illuminated room, ask the patient to hold the grid 12 to 15 inches away from the face.
•Ask to cover one eye with hand or occlude and look directly at the center black dot.
•While looking directly at the center dot, and observe the grid. If any lines or areas look blurry, wavy,
dark or blank mark that area in chart and consult ophthalmologist.
•Follow the same steps with the other eye.
•Always remember to keep the Amsler’s Chart at the same distance from the eyes each time you test.
•This test can be self done at home also.
4. CHART1
• The most familiar and widely used of the charts is the first in
the manual, the Standard Amsler grid.
• This is merely a grid pattern consisting of 0.5cm white squares,
each corresponding to 1 degree of visual field, set against a
black background.
• This is arranged in 20 horizontal & vertical rows making
20 squares each.
• It is most commonly used. It comprises a high contrast
white grid on a black background. The outer grid
encloses400 smaller 5mm squares. When viewed about
one-third of a meter, each small square subtends an angle
of a 1 degree.
5. Relative scotoma: The
area in the visual field
which is seen as blur
or not seen clearly.
Absolute scotoma: The
area in the visual field
which is not at all seen
or unrecognizable,
usually reported by
the patient as a black
area
This grid pattern is the most versatile of the charts. This enables the
clinician to identify various forms of distortion as well as Relative and
Absolute scotoma.
6. CHART 2
• This chart is similar to chart 1but has diagonal
lines that aid fixation in patients unable to see
the central spot as a result of a central scotoma.
• The patient with a central scotoma may respond
better if this chart is used.
• The only difference between this and Standard grid chart
is that diagonal lines intersect at the center of the grid to
form an ‘X’.
• This gives the patient a better idea of where the fixation
point is located.
• A larger white central spot may be applied with tape to the
center of the grid if the patient is still unable to achieve or
maintain central fixation.
7. • This chart has an identical configuration with that of the
Standard Amsler chart, except for having red squares
instead of white ones in the black background.
• The patient suspected of having a central or cecocentral
scotoma associated with nutritional amblyopia, as from
alcohol-related thiamine deficiency, or toxic maculopathy,
as from quinine and its derivatives, should be tested with
this chart.
• This chart can also be used to differentiate patient with
functional vision loss , as from malingering with the
conjunction of red-green lenses, the red grid may allow
detection of artificial monocular field/vision loss.
• Under normal circumstances, the grid will disappear when
viewed through the green lens; conversely, it will remain
visible when viewed through the red lens.
CHART 3
8. CHART 4
• This chart has no lines to distort; instead it
consists of small white dots randomly distributed
over a black background like stars in the sky.
• Amsler hoped that the patient with one or more
paracentral scotomas may be able to delineate the
area[s] of involvement more easily with this chart.
• But its credibility is doubtful since the background
and scotoma use to appear same in color for the
observer may result in false results
9. • This chart consists of 20 evenly spaced
white horizontal lines on a black
background.
• This design makes it possible to rotate the chart
to any meridian to check for irregularities in a
particular/specific area.
• The patient with central or paracentral
metamorphopsia resulting from various retinal
and choroidal disorders may be especially
sensitive to this chart
CHART 5
10. • This chart varies slightly from chart no 5
• It contains black lines against a white
background and the areas 1 degree above and
below the fixation dot are bisected by
additional horizontal lines.
• Metamorphopsia along the reading level
may be more easily observed with this chart.
CHART 6
11. • This chart breaks the horizontally oriented 6 degreeX8
degree central area, which corresponds anatomically to
the normal macula, into 0.5 degree squares, rather than 1
degree squares.
• This making it a more sensitive detector to insidious
macular compromise
• This chart is more useful in cases where there is a
subtle visual disturbance from macular disease,
especially early in the course of the disease
CHART 7