SlideShare a Scribd company logo
1 of 81
Download to read offline
1.
2.
Copyright © 2014. Hope for Children Organization Australia Ltd.All rights reserved.
Printed in Australia. WWW.GLOBALSLAVERYINDEX.ORG
Coverimage–G.M.B.Akash
‘‘You may choose to look the other way but you
	 can never say again that you did not know.’’
WilliamWilberforce
HIGHLIGHTS OF THE GLOBAL SLAVERY INDEX
This is the second edition of the Global Slavery Index (the Index).
It is the first Index of its kind – providing an estimate, country by country,
of the number of people living in modern slavery today.
The prevalence of
modern slavery is
highest in:
Mauritania
Uzbekistan
Haiti
Qatar
India
Pakistan
Democratic Republic
of the Congo
Sudan
Syria
Central African Republic
The governments that are
taking the most action
to end modern slavery are:
Netherlands
Sweden
United States
Australia
Switzerland
Ireland
Norway
United Kingdom
Georgia
Austria
In absolute terms, the countries
with the highest number of
people in modern slavery are:
India
China
Pakistan
Uzbekistan
Russia
Nigeria
Democratic Republic
of the Congo
Indonesia
Bangladesh
Thailand
When economic capacity
is taken into account,
these countries are
taking strong efforts
to respond to modern
slavery with relatively
limited resources:
Georgia
Philippines
Macedonia
Jamaica
The governments that
are taking the least
action to end modern
slavery are:
North Korea
Iran
Syria
Eritrea
Central African
Republic
Libya
Equatorial Guinea
Uzbekistan
Republic of the
Congo
Iraq
The governments that
should be doing more,
given their wealth are:
Hong Kong
Kuwait
Brunei
Singapore
Qatar
Estimated people in
modern slavery globally
35.8MILLION
61%
Of those living in
modern slavery
are in five countries:
India, China, Pakistan,
Uzbekistan, Russia
About the Index
●● It provides an analysis of the prevalence of modern slavery in terms of the percentage of a national
population and the total number of people living in modern slavery – country by country,region by region.
●● For the first time,the Index includes an analysis of what governments are doing to eradicate modern slavery.
●● It also looks at the contextual factors that make people vulnerable to modern slavery.
7.6.
When the absolute number of people in modern slavery
per country is considered, the country ranking shifts.The
ten countries with the largest estimated numbers of people
in modern slavery are: India, China, Pakistan, Uzbekistan,
Russia, Nigeria, the Democratic Republic of the Congo,
Indonesia, Bangladesh and Thailand.Taken together,
these ten countries account for 71 percent of the total
estimate of 35.8 million people living in modern slavery.
The regions with the lowest estimates of people enslaved
are Europe and North America. Iceland and Ireland have
the lowest prevalence of modern slavery in the world.
Scandinavian countries with comparatively low prevalence
include Norway, Finland and Denmark. Canada has the
lowest estimated prevalence in the Americas, and New
Zealand,Taiwan and Australia have the smallest concentration
of people enslaved in the Asia Pacific region.
In 2014, the Index includes an analysis of 167 government
responses based on five objectives that every single
country should seek to accomplish in order to eradicate
modern slavery:
●● Survivors are identified, supported to exit and remain
out of modern slavery.
●● Criminal justice mechanisms address modern slavery.
●● Coordination and accountability mechanisms for the
central government are in place.
●● Attitudes, social systems and institutions that enable
modern slavery are addressed.
●● Businesses and governments through their public
procurement stop sourcing goods and services that use
modern slavery.
It is promising that the majority of countries have
a basic national action plan to address some forms
of modern slavery, and/or a national body tasked
with coordinating responses to this crime. However,
implementation continues to be weak.
Aside from North Korea, all countries also have national
laws that criminalise at least some form of modern slavery.
While most countries have patchy, basic victim support
services, very few countries have comprehensive services
for men, women and children, covering both emergency
support and long term reintegration services. Norway is one
of the few countries in the world which provides holistic
services for victims of modern slavery.
Globally, only three of 167 governments are making
some effort to address modern slavery in government
procurement and in the supply chains of businesses
operating in their countries: the United States of America,
Brazil and Australia.
Considered overall, countries taking the most action to end
modern slavery are: the Netherlands, Sweden, the United
States, Australia, Switzerland, Ireland, Norway, the
United Kingdom, Georgia, and Austria.
Despite the fact that the highest ranking countries have
comparatively more robust policies in place, most have
the economic capacity to do significantly more to end
modern slavery.
When national economic capacity is taken into account,
countries that are making comparatively strong efforts with
limited resources include: Georgia, the Philippines and
Jamaica, with criminal justice responses in place, and
Macedonia, with relatively strong support services for
victims of modern slavery.
The countries with the weakest responses to modern slavery
are: North Korea, Iran, Syria, Eritrea, the Central African
Republic, Libya, Equatorial Guinea, Uzbekistan, the
Republic of the Congo, and Iraq. Many of these countries
have weak economies, such as Equatorial Guinea, or have
been plagued by conflict and political instability in recent
years – for example, Libya, Central African Republic and
Syria. Some governments impose state-sponsored modern
slavery, as experienced by the 1.2 million people forced to
harvest cotton in Uzbekistan, or those forced to labour in
prison camps in North Korea.
Lastly, the vulnerability of individuals to enslavement
within countries was investigated by analysing five
dimensions, including, state policy on modern slavery,
human rights, human development, state stability, and levels
of discrimination. The findings illustrate a strong link
between the stability or instability of a country and the
vulnerability of its population to modern slavery.Anti-
slavery policies will have little impact when a country’s rule
of law has broken down because of civil war, or ethnic or
religious conflict.
High levels of prejudice and discrimination in a society
can also create a context that marks some people as less
important and less deserving of rights and protection, which
in turn makes the crime of modern slavery easier to commit
against them. Statistical testing confirms the connection
between discrimination and modern slavery.
This is the second edition of the Global Slavery Index
(‘the Index’).The Index estimates the number of people
in modern slavery in 167 countries.This year’s Index also
includes an analysis of what governments are doing to
eradicate modern slavery. In addition to measuring the
extent of the problem and the actions taken, the Index
increases our understanding of the contextual factors that
make people vulnerable to modern slavery.
The Index is the flagship report produced by the Walk Free
Foundation, a global human rights organisation dedicated
to ending modern slavery. The Walk Free Foundation was
founded by Australian philanthropists,Andrew and
Nicola Forrest.The methodology for the Index was
developed by an internal research team and through external
consultations with an international and independent Expert
Advisory Group.
The 2014 Global Slavery Index estimates there are
35.8 million people living in some form of modern
slavery globally.
The estimated prevalence of people in modern slavery has
increased from 2013. It is important to note that we are not
asserting that there has been an increase in modern slavery
around the world over the last year.We believe that the
majority of this increase is due to the improved accuracy
and precision of our measures, and that we are uncovering
modern slavery where it was not found before.
This year’s improved methodology includes nationally
representative random sample surveys undertaken in seven
countries, which provided data points for ten countries.
In addition, we obtained data from a further nine random
sample surveys, increasing the number of countries where
survey data is available to a total of 19. In 2013, we released
the Index with a sense of urgency to raise awareness of
modern slavery while acknowledging that the figures were
an imperfect estimate.As modern slavery is a hidden crime
and notoriously difficult to measure, in 2014, these surveys
have enabled us to have a more precise measurement of the
number of people enslaved.We will continue to improve
the methodology by including more random sample surveys
every year.
For 2014, the ten countries with the highest estimated
prevalence of modern slavery by population are: Mauritania,
Uzbekistan, Haiti, Qatar, India, Pakistan, the Democratic
Republic of the Congo, Sudan, Syria and the Central
African Republic.These countries span different regions,
they have diverse political systems, and range from low to
high income economies.
EXECUTIVE SUMMARY
From children denied an education by
being forced to work or marry early,
to men unable to leave their work
because of crushing debts they owe to
recruitment agents, to women and girls
exploited as unpaid, abused domestic
workers, modern slavery has many faces
and comes in many different forms.
It still exists today, in every country –
modern slavery affects us all.
Image – G.M.B.Akash
9.8.
Highlights of the Global Slavery Index. . . . . . . . . . . . . . . . . . . . . . . . . . . . . . . . . . . . . . . . . . . . 3
Executive Summary. . . . . . . . . . . . . . . . . . . . . . . . . . . . . . . . . . . . . . . . . . . . . . . . . . . . . . . . . . . . . . . . . . . . . . . . . . . . 4
Terminology. . . . . . . . . . . . . . . . . . . . . . . . . . . . . . . . . . . . . . . . . . . . . . . . . . . . . . . . . . . . . . . . . . . . . . . . . . . . . . . . . . . . . . . . . 8
What is modern slavery?. . . . . . . . . . . . . . . . . . . . . . . . . . . . . . . . . . . . . . . . . . . . . . . . . . . . . . . . . . . . . . . . . . . . . 8
About the 2014 Global Slavery Index. . . . . . . . . . . . . . . . . . . . . . . . . . . . . . . . . . . . . . . . . . . . . . . 9
The Methodology. . . . . . . . . . . . . . . . . . . . . . . . . . . . . . . . . . . . . . . . . . . . . . . . . . . . . . . . . . . . . . . . . . . . . . . . . . . . . . 10
How did we measure prevalence?. . . . . . . . . . . . . . . . . . . . . . . . . . . . . . . . . . . . . . . . . . . . . . . . . . . . . 10
How did we measure government responses?.. . . . . . . . . . . . . . . . . . . . . . . . . . . . . . . . . . . 10
How did we measure vulnerability?. . . . . . . . . . . . . . . . . . . . . . . . . . . . . . . . . . . . . . . . . . . . . . . . . . 10
Global Findings.. . . . . . . . . . . . . . . . . . . . . . . . . . . . . . . . . . . . . . . . . . . . . . . . . . . . . . . . . . . . . . . . . . . . . . . . . . . . . . . . . 13
How big is the problem?. . . . . . . . . . . . . . . . . . . . . . . . . . . . . . . . . . . . . . . . . . . . . . . . . . . . . . . . . . . . . . . . . . . 15
Estimates of people in modern slavery by absolute number.. . . . . . . . . . . . . . 18
How are governments tackling modern slavery?. . . . . . . . . . . . . . . . . . . . . . . . . . . . . . . 20
Measuring vulnerability. . . . . . . . . . . . . . . . . . . . . . . . . . . . . . . . . . . . . . . . . . . . . . . . . . . . . . . . . . . . . . . . . . . . 25
Regional Analysis.. . . . . . . . . . . . . . . . . . . . . . . . . . . . . . . . . . . . . . . . . . . . . . . . . . . . . . . . . . . . . . . . . . . . . . . . . . . . . . 29
Asia Pacific.. . . . . . . . . . . . . . . . . . . . . . . . . . . . . . . . . . . . . . . . . . . . . . . . . . . . . . . . . . . . . . . . . . . . . . . . . . . . . . . . . . . . . . . 31
Europe. . . . . . . . . . . . . . . . . . . . . . . . . . . . . . . . . . . . . . . . . . . . . . . . . . . . . . . . . . . . . . . . . . . . . . . . . . . . . . . . . . . . . . . . . . . . . . 37
Russia and Eurasia. . . . . . . . . . . . . . . . . . . . . . . . . . . . . . . . . . . . . . . . . . . . . . . . . . . . . . . . . . . . . . . . . . . . . . . . . . . . 43
Sub-Saharan Africa.. . . . . . . . . . . . . . . . . . . . . . . . . . . . . . . . . . . . . . . . . . . . . . . . . . . . . . . . . . . . . . . . . . . . . . . . . . . 47
The Middle East and North Africa.. . . . . . . . . . . . . . . . . . . . . . . . . . . . . . . . . . . . . . . . . . . . . . . . . . . 55
The Americas.. . . . . . . . . . . . . . . . . . . . . . . . . . . . . . . . . . . . . . . . . . . . . . . . . . . . . . . . . . . . . . . . . . . . . . . . . . . . . . . . . . . 59
Selected Country Studies. . . . . . . . . . . . . . . . . . . . . . . . . . . . . . . . . . . . . . . . . . . . . . . . . . . . . . . . . . . . . . . . . 65
Mauritania. . . . . . . . . . . . . . . . . . . . . . . . . . . . . . . . . . . . . . . . . . . . . . . . . . . . . . . . . . . . . . . . . . . . . . . . . . . . . . . . . . . . . . . . 66
Uzbekistan. . . . . . . . . . . . . . . . . . . . . . . . . . . . . . . . . . . . . . . . . . . . . . . . . . . . . . . . . . . . . . . . . . . . . . . . . . . . . . . . . . . . . . . . 68
Haiti. . . . . . . . . . . . . . . . . . . . . . . . . . . . . . . . . . . . . . . . . . . . . . . . . . . . . . . . . . . . . . . . . . . . . . . . . . . . . . . . . . . . . . . . . . . . . . . . . 70
Qatar. . . . . . . . . . . . . . . . . . . . . . . . . . . . . . . . . . . . . . . . . . . . . . . . . . . . . . . . . . . . . . . . . . . . . . . . . . . . . . . . . . . . . . . . . . . . . . . . 72
India. . . . . . . . . . . . . . . . . . . . . . . . . . . . . . . . . . . . . . . . . . . . . . . . . . . . . . . . . . . . . . . . . . . . . . . . . . . . . . . . . . . . . . . . . . . . . . . . . 74
Pakistan.. . . . . . . . . . . . . . . . . . . . . . . . . . . . . . . . . . . . . . . . . . . . . . . . . . . . . . . . . . . . . . . . . . . . . . . . . . . . . . . . . . . . . . . . . . . . 76
Democratic Republic of the Congo. . . . . . . . . . . . . . . . . . . . . . . . . . . . . . . . . . . . . . . . . . . . . . . . . 78
Sudan.. . . . . . . . . . . . . . . . . . . . . . . . . . . . . . . . . . . . . . . . . . . . . . . . . . . . . . . . . . . . . . . . . . . . . . . . . . . . . . . . . . . . . . . . . . . . . . . 80
Syria. . . . . . . . . . . . . . . . . . . . . . . . . . . . . . . . . . . . . . . . . . . . . . . . . . . . . . . . . . . . . . . . . . . . . . . . . . . . . . . . . . . . . . . . . . . . . . . . . 82
Central African Republic. . . . . . . . . . . . . . . . . . . . . . . . . . . . . . . . . . . . . . . . . . . . . . . . . . . . . . . . . . . . . . . . . . 84
United Arab Emirates.. . . . . . . . . . . . . . . . . . . . . . . . . . . . . . . . . . . . . . . . . . . . . . . . . . . . . . . . . . . . . . . . . . . . . . . 86
Russia. . . . . . . . . . . . . . . . . . . . . . . . . . . . . . . . . . . . . . . . . . . . . . . . . . . . . . . . . . . . . . . . . . . . . . . . . . . . . . . . . . . . . . . . . . . . . . . 88
Thailand. . . . . . . . . . . . . . . . . . . . . . . . . . . . . . . . . . . . . . . . . . . . . . . . . . . . . . . . . . . . . . . . . . . . . . . . . . . . . . . . . . . . . . . . . . . 90
Nigeria. . . . . . . . . . . . . . . . . . . . . . . . . . . . . . . . . . . . . . . . . . . . . . . . . . . . . . . . . . . . . . . . . . . . . . . . . . . . . . . . . . . . . . . . . . . . . 92
Bangladesh. . . . . . . . . . . . . . . . . . . . . . . . . . . . . . . . . . . . . . . . . . . . . . . . . . . . . . . . . . . . . . . . . . . . . . . . . . . . . . . . . . . . . . . . 94
Georgia.. . . . . . . . . . . . . . . . . . . . . . . . . . . . . . . . . . . . . . . . . . . . . . . . . . . . . . . . . . . . . . . . . . . . . . . . . . . . . . . . . . . . . . . . . . . . 96
Indonesia. . . . . . . . . . . . . . . . . . . . . . . . . . . . . . . . . . . . . . . . . . . . . . . . . . . . . . . . . . . . . . . . . . . . . . . . . . . . . . . . . . . . . . . . . . 98
China.. . . . . . . . . . . . . . . . . . . . . . . . . . . . . . . . . . . . . . . . . . . . . . . . . . . . . . . . . . . . . . . . . . . . . . . . . . . . . . . . . . . . . . . . . . . . . 100
Brazil. . . . . . . . . . . . . . . . . . . . . . . . . . . . . . . . . . . . . . . . . . . . . . . . . . . . . . . . . . . . . . . . . . . . . . . . . . . . . . . . . . . . . . . . . . . . . . 102
United States. . . . . . . . . . . . . . . . . . . . . . . . . . . . . . . . . . . . . . . . . . . . . . . . . . . . . . . . . . . . . . . . . . . . . . . . . . . . . . . . . . 104
Australia.. . . . . . . . . . . . . . . . . . . . . . . . . . . . . . . . . . . . . . . . . . . . . . . . . . . . . . . . . . . . . . . . . . . . . . . . . . . . . . . . . . . . . . . . . 106
The Netherlands. . . . . . . . . . . . . . . . . . . . . . . . . . . . . . . . . . . . . . . . . . . . . . . . . . . . . . . . . . . . . . . . . . . . . . . . . . . . . 108
Appendices. . . . . . . . . . . . . . . . . . . . . . . . . . . . . . . . . . . . . . . . . . . . . . . . . . . . . . . . . . . . . . . . . . . . . . . . . . . . . . . . . . . . . . . 111
Appendix 1 – Terminology.. . . . . . . . . . . . . . . . . . . . . . . . . . . . . . . . . . . . . . . . . . . . . . . . . . . . . . . . . . . . . . . 112
Appendix 2 – Methodology. . . . . . . . . . . . . . . . . . . . . . . . . . . . . . . . . . . . . . . . . . . . . . . . . . . . . . . . . . . . . . 113
Estimating Prevalence. . . . . . . . . . . . . . . . . . . . . . . . . . . . . . . . . . . . . . . . . . . . . . . . . . . . . . . . . . . . . . . . . . . . . 113
Measuring Government Responses.. . . . . . . . . . . . . . . . . . . . . . . . . . . . . . . . . . . . . . . . . . . . . . . . 117
MeasuringVulnerability.. . . . . . . . . . . . . . . . . . . . . . . . . . . . . . . . . . . . . . . . . . . . . . . . . . . . . . . . . . . . . . . . . . 125
Appendix 3 – Data Tables.. . . . . . . . . . . . . . . . . . . . . . . . . . . . . . . . . . . . . . . . . . . . . . . . . . . . . . . . . . . . . . . . . 130
Endnotes. . . . . . . . . . . . . . . . . . . . . . . . . . . . . . . . . . . . . . . . . . . . . . . . . . . . . . . . . . . . . . . . . . . . . . . . . . . . . . . . . . . . . . . . . . . 142
Contents
Image–PepBonet
11.10.
ABOUT THE 2014 GLOBAL SLAVERY INDEX
Modern slavery is a hidden crime. It takes many forms, and is known by many names: slavery,
forced labour, or human trafficking.All forms involve one person depriving another person
of their freedom: their freedom to leave one job for another, their freedom to leave one
workplace for another, their freedom to control their own body. Modern slavery involves
one person possessing or controlling a person in such as a way as to significantly
deprive that person of their individual liberty, with the intention of exploiting that
person through their use, management, profit, transfer or disposal.
Modern slavery contributes to the production of at least 122 goods from 58 countries
worldwide.The International Labour Organization (ILO) estimates the illicit profits of forced
labour to be $US150 billion a year.2
From the Thai fisherman trawling fishmeal, to the
Congolese boy mining diamonds, from the Uzbek child picking cotton, to the Indian girl
stitching footballs, from the women who sew dresses, to the cocoa pod pickers, their forced
labour is what we consume. Modern slavery is big business.Acknowledging the problem, and
advocating against it is not philanthropy – it is our responsibility.
Nearly every country in the world has committed to eradicate modern slavery, through their
national policies and agreements to international conventions.While we all have a role to play,
the actions of government are paramount in addressing this problem. Only governments can
ensure that victims are not treated as criminals. Only governments can adopt national action
plans and allocate budgets to fund responses.
The Global Slavery Index is a tool for citizens, non-government organisations (NGOs),
businesses, and public officials to understand the size of the problem, existing responses and
contributing factors, so they can build sound policies that will end modern slavery.
What information is included in the Global Slavery Index?
The Global Slavery Index has quantified data across three dimensions:
1.	 Size of the problem: What is the estimated prevalence of modern slavery country by
country,and what is the absolute number by population?
2.	 Government response: How are governments tackling modern slavery?
3.	 Vulnerability: What factors explain or predict the prevalence of modern slavery?
All of the supporting data tables and methodology are available to download on the Global
Slavery Index website www.globalslaveryindex.org
2	
International Labour Organization,‘Profits and Poverty:The economics of forced labour’, (ILO, 2014), accessed 06/10/14: http://www.ilo.org/
wcmsp5/groups/public/---ed_norm/---declaration/documents/publication/wcms_243391.pdf
TERMINOLOGY
What is modern slavery?
Different countries use different terminology to describe modern forms of slavery, including
the term slavery itself, but also other concepts such as human trafficking, forced labour, debt
bondage, forced or servile marriage, and the sale and exploitation of children.1
All of these crimes share some common features. For the purpose of the Index, modern
slavery involves one person possessing or controlling another person in such as a way
as to significantly deprive that person of their individual liberty, with the intention of
exploiting that person through their use, management, profit, transfer or disposal.
The Walk Free Foundation definition of modern slavery encompasses the definitions outlined
in the box below:
Modern Slavery
TRAFFICKING IN PERSONS
1	Recruitment, transportation, transfer, harbouring or receipt of persons;
2	By means of threat or use of force or other forms of coercion, of abduction, of fraud, of deception,
of the abuse of power or of a position of vulnerability or of the giving or receiving of payments or
benefits to achieve the consent of a person having control over another person (these means are
not required in the case of children);
3	 With the intent of exploiting that person through:
Prostitution of others;
Sexual exploitation;
Forced labour;
Slavery (or similar practices);
Servitude; and
Removal of organs.
(UN Trafficking Protocol, 2000)
SLAVERY AND SLAVERY LIKE PRACTICES
The status or condition of a person over whom any or all of the powers attaching to the right
of ownership are exercised.
Includes slavery-like practices: debt bondage, forced or servile marriage, sale or exploitation of children
(including in armed conflict) and descent-based slavery.
(The Slavery Convention (1926) and Supplementary Slavery Convention (1956))
FORCED LABOUR
All work or service which is exacted from any person under the menace of any penalty and for which
the said person has not offered himself voluntarily.
(ILO Forced Labour Convention, 1930 (No. 29))
1	
See Appendix 1 for full list of meanings of these terms, reflecting their origins in international law.
Image–G.M.B.Akash
13.12.
THE METHODOLOGY
How did we measure prevalence?
Measuring modern slavery is a very difficult undertaking due to the hidden nature of this crime. Surveys represent the
most accurate method for estimating the numbers of people living in modern slavery.This year, the Walk Free Foundation
commissioned Gallup Inc.3
to conduct nationally representative, random-sample surveys in seven countries: Nepal,
Indonesia, Brazil, Ethiopia, Russia, Pakistan, and Nigeria.The results from these surveys were considered alongside data
from other pre-existing surveys and a review of secondary sources for 58 countries. Data from a total of 19 countries
were obtained from random sample surveys, including the seven Gallup survey countries. An extrapolation method was
developed for the remaining countries that took into account factors including vulnerability, geography, and country context
to produce an appropriate estimate.The preliminary prevalence estimates were then reviewed against secondary source
estimates and qualitative information collated for 58 countries. Final country level adjustments were made to specific
countries where the evidence suggested it was justified, in particular for Small Island Developing States.4
How did we measure government responses?
A methodology was developed to measure how governments are responding to modern slavery in 167 countries.A team of
researchers collected data against the following five objectives for each country:
1.	 Survivors are identified, supported to exit and remain out of modern slavery.
2.	 Criminal justice mechanisms address modern slavery.
3.	 Coordination and accountability mechanisms for the central government are in place.
4.	 Attitudes, social systems and institutions that enable modern slavery are addressed.
5.	 Businesses and governments through their public procurement stop sourcing goods and services that
use modern slavery.
In April 2014, the Walk Free Foundation also conducted a survey of 167 governments; information from the 38 responses
received was incorporated into relevant country research.5
Where possible, the Walk Free Foundation researchers verified
data obtained through desk review with experts in each country.This occurred in 60 countries.
How did we measure vulnerability?
The Global Slavery Index examines the contextual factors that impact on the vulnerability of people in a country to modern
slavery. Information was collected from reputable sources on 37 variables across five dimensions that affect vulnerability to
enslavement such as:
●● National policies to combat modern slavery.
●● The availability of human rights protections in a country.
●● The level of economic and social development in a country.
●● The level of state stability in a country.
●● The extent of women’s rights and levels of discrimination in a country.
Through statistical testing the Index examines the relationship between these factors and the prevalence of modern slavery.
An outline of the methodology for assessing prevalence, government responses and vulnerability is available in Appendix 2,
and a detailed Methodology Paper is available to download on the Global Slavery Index website.
3	
Gallup Inc. is an international research-based company, http://www.gallup.com/home.aspx
4	
“InternationalYear of Small Developing States 2014”, United Nations, last modified 2014, accessed 22/09/14: http://www.un.org/en/events/islands2014/smallislands.shtml
5	
Full list of responses can be found at:“What is the progress update?” Walk Free Foundation, last modified May, 2014, accessed 22/09/14: http://www.globalslaveryindex.org/update/#about
“I was born in a small village in Nepal.
When I was almost 12 years old I worked
in a restaurant. I trusted the woman that I
worked for so when she said that I should
go with a friend of hers to work in India it
never occurred to me that I would be sold
into slavery for a brothel.”
Voice of a Nepali survivor of sexual exploitation.
Image–PepBonet
15.14.
Global Findings
Low High
Estimated Prevalence of Modern Slavery Government Resp
AAAAAA BBB
The alphabetical depi
responses to modern
the lowest a D.
The colour of the countries as shown on this map designate from lowest
to highest prevalence of modern slavery.
Those in grey were not included in the Index.
17.16.
How big is the problem?
The 2014 Global Slavery Index presents a ranking of 167 countries based on the percent of a country’s population that is
estimated to be in modern slavery. Five countries are appearing in the Global Slavery Index for the first time:Taiwan, South
Sudan, North Korea, Kosovo and Cyprus.
A ranking of one in the Index indicates the most severely concentrated modern slavery situation; a ranking of
167 indicates the least severely concentrated modern slavery problem.A detailed description of the methodology
underpinning this process is provided in Appendix 2 and on the Global Slavery Index website (www.globalslaveryindex.org).
In the second year of the Index, an estimated 35.8 million people are enslaved around the world. It is important to note
that we are not asserting that there has been an increase in modern slavery around the world over the last year.We believe
that this increase is due to the improved accuracy and precision of our measures and that we are uncovering modern slavery
where it was not seen before.
As was the case in 2013, the West African nation of Mauritania ranks number one in the Index. In 2014, an estimated four
percent of the population – approximately 155,600 people – are enslaved in Mauritania, a country with deeply entrenched
hereditary slavery. In the past 12 months, the Mauritanian Government has taken positive steps to address slavery, adopting
a plan of action recommended by the United Nations Special Rapporteur on Contemporary Forms of Slavery.The
government has agreed, amongst other things, to establishing a special tribunal to adjudicate cases of slavery.While this
progress is important, it may be several years before these changes have any impact on the size of the problem.
The Republic of Uzbekistan, a Central Asian nation whose economy relies heavily on cotton production and export, is
second in the Index.The rise in Uzbekistan’s ranking is a direct reflection of government-imposed forced labour.While it
is very difficult to obtain accurate estimates of modern slavery in Uzbekistan, the role of the government in forcing citizens
to pick cotton for two months every year has been well-documented by numerous organisations.6
The most conservative
of available estimates indicates that almost four percent – approximately 1,201,400 people – of the Uzbek population is
subjected to modern slavery during the annual cotton harvest.
Several other countries rose in the rankings in 2014.Those that entered the top ten include: Qatar, the Democratic
Republic of the Congo, Sudan, Syria and the Central African Republic.
Qatar hosts significant numbers of foreign workers, and has risen in the ranking due to improved survey data giving better
insight to the high number of enslaved migrant workers in the nation. It is ranked fourth with an estimated 1.4 percent of
the population in modern slavery.We consider this to be a conservative estimate.
The ranking of Pakistan, the Democratic Republic of the Congo (DRC), Sudan, Syria and the Central African
Republic in the top ten reflects the impact of war and conflict on modern slavery. Conflict brings an almost immediate end
to the rule of law, as well as bringing most infrastructure, normal services and governmental processes to a halt. In conflict,
exploitation becomes an immediate threat to an increased proportion of the population. Over one percent of the population
of Pakistan, the Democratic Republic of the Congo, Sudan, Syria and Central African Republic is estimated to be in
modern slavery. In absolute terms, this is approximately 2,058,200 people from Pakistan, 762,900 people from DRC, 429,000
people from Sudan, 258,200 people from Syria, and 52,200 people from the Central African Republic.
Ireland and Iceland sit at 166 and 167 in the 2014 Index with the lowest prevalence of modern slavery.While the estimated
proportion of the population in modern slavery in each country is small (0.0007, or seven in every 10,000 persons in the
population), no country in the Global Slavery Index is free of modern slavery. Ireland and Iceland are estimated to have
approximately 300 and up to 100 people in modern slavery, respectively.
6	
“Follow-up to the conclusions of the Committee on the Application of Standards International Labour Conference, 102nd Session, June 2013: Uzbekistan (Ratification: 2008)”,
(International Labour Organization, 2014), accessed 22/09/14: http://www.ilo.org/dyn/normlex/en/f?p=1000:13100:0::NO:13100:P13100_COMMENT_ID:3149080; see also “Forced
Labor in Uzbekistan: Report on the 2013 Cotton Harvest”, (Uzbek-German Forum for Human Rights, 2014), accessed 22/09/14: http://uzbekgermanforum.org/wp-content/uploads/2014/06/
Forced-Labor-in-Uzbekistan-Report-2013.pdf
Image–VladSokhin
19.18.
Rank Country
Percent of
population
in modern
slavery
Estimated
population
in modern
slavery Population
84 Macedonia 0.360 7,600 2,107,158
85 Slovenia 0.360 7,400 2,060,484
86 Estonia 0.360 4,800 1,324,612
87 Cyprus 0.360 4,100 1,141,166
88 Montenegro 0.360 2,200 621,383
89 Vietnam 0.359 322,200 89,708,900
90 Uganda 0.359 135,000 37,578,876
91 Cameroon 0.359 79,900 22,253,959
92 Sri Lanka 0.359 73,600 20,483,000
93 Kazakhstan 0.359 61,200 17,037,508
94 Azerbaijan 0.359 33,800 9,416,598
95 Tajikistan 0.359 29,500 8,207,834
96 Lao PDR 0.359 24,300 6,769,727
97 Kyrgyzstan 0.359 20,500 5,719,500
98 Turkmenistan 0.359 18,800 5,240,072
99 Timor-Leste 0.340 4,000 1,178,252
100 Tunisia 0.306 33,300 10,886,500
101 Saudi Arabia 0.292 84,200 28,828,870
102 Indonesia 0.286 714,100 249,865,631
103 Philippines 0.266 261,200 98,393,574
104 Mauritius 0.254 3,300 1,296,303
105 Turkey 0.248 185,500 74,932,641
106 Ukraine 0.248 112,600 45,489,600
107 Kosovo 0.248 4,500 1,824,000
108 Gabon 0.248 4,100 1,671,711
109 China 0.239 3,241,400 1,357,380,000
110 Papua New Guinea 0.230 16,800 7,321,262
111 Mexico 0.218 266,900 122,332,399
112 Colombia 0.218 105,400 48,321,405
113 Peru 0.218 66,300 30,375,603
114 Ecuador 0.218 34,300 15,737,878
115 Guatemala 0.218 33,800 15,468,203
116 Bolivia 0.218 23,300 10,671,200
117 Honduras 0.218 17,700 8,097,688
118 Paraguay 0.218 14,800 6,802,295
119 El Salvador 0.218 13,800 6,340,454
120 Nicaragua 0.218 13,300 6,080,478
121 Chile 0.210 36,900 17,619,708
122 Costa Rica 0.210 10,200 4,872,166
123 Panama 0.210 8,100 3,864,170
124 Uruguay 0.210 7,100 3,407,062
125 Venezuela 0.200 60,900 30,405,207
Rank Country
Percent of
population
in modern
slavery
Estimated
population
in modern
slavery Population
126 South Africa 0.200 106,000 52,981,991
127 Japan 0.187 237,500 127,338,621
128 South Korea 0.187 93,700 50,219,669
129 Argentina 0.187 77,300 41,446,246
130 Poland 0.187 71,900 38,530,725
131 Hong Kong 0.187 13,400 7,187,500
132 Dominican Republic 0.175 18,200 10,403,761
133 Trinidad and Tobago 0.169 2,300 1,341,151
134 Jamaica 0.155 4,200 2,715,000
135 Barbados 0.149 400 284,644
136 Kenya 0.146 64,900 44,353,691
137 Madagascar 0.133 30,400 22,924,851
138 Belarus 0.122 11,500 9,466,000
139 Romania 0.113 22,600 19,963,581
140 Latvia 0.113 2,300 2,013,385
141 Singapore 0.100 5,400 5,399,200
142 Israel 0.081 6,500 8,059,400
143 Brazil 0.078 155,300 200,361,925
144 Cuba 0.036 4,100 11,265,629
145 United States 0.019 60,100 316,128,839
146 Italy 0.019 11,400 59,831,093
147 Germany 0.013 10,500 80,621,788
148 France 0.013 8,600 66,028,467
149 United Kingdom 0.013 8,300 64,097,085
150 Spain 0.013 6,100 46,647,421
151 Canada 0.013 4,600 35,158,304
152 Taiwan 0.013 3,000 23,340,000
153 Australia 0.013 3,000 23,130,900
154 Netherlands 0.013 2,200 16,804,224
155 Belgium 0.013 1,500 11,195,138
156 Greece 0.013 1,400 11,032,328
157 Portugal 0.013 1,400 10,459,806
158 Sweden 0.013 1,200 9,592,552
159 Austria 0.013 1,100 8,473,786
160 Switzerland 0.013 1,100 8,081,482
161 Denmark 0.013 700 5,613,706
162 Finland 0.013 700 5,439,407
163 Norway 0.013 700 5,084,190
164 New Zealand 0.013 600 4,470,800
165 Luxembourg 0.013 100 543,202
166 Ireland 0.007 300 4,595,281
167 Iceland 0.007 100 323,002
Rank of countries by prevalence of population in modern slavery
(1 = most severe problem, 167 = least severe problem)
Rank Country
Percent of
population
in modern
slavery
Estimated
population
in modern
slavery Population
1 Mauritania 4.000 155,600 3,889,880
2 Uzbekistan 3.973 1,201,400 30,241,100
3 Haiti 2.304 237,700 10,317,461
4 Qatar 1.356 29,400 2,168,673
5 India 1.141 14,285,700 1,252,139,596
6 Pakistan 1.130 2,058,200 182,142,594
7
Democratic Republic
of the Congo
1.130 762,900 67,513,677
8 Sudan 1.130 429,000 37,964,306
9 Syria 1.130 258,200 22,845,550
10
Central African
Republic
1.130 52,200 4,616,417
11
Republic of the
Congo
1.106 49,200 4,447,632
12 United Arab Emirates 1.057 98,800 9,346,129
13 Iraq 1.035 345,900 33,417,476
14 Cambodia 1.029 155,800 15,135,169
15 Moldova 0.936 33,300 3,559,000
16 Mongolia 0.907 25,700 2,839,073
17 Namibia 0.907 20,900 2,303,315
18 Botswana 0.907 18,300 2,021,144
19 Suriname 0.907 4,900 539,276
20 Nepal 0.823 228,700 27,797,457
21 Ghana 0.746 193,100 25,904,598
22 Mozambique 0.746 192,600 25,833,752
23 Niger 0.746 132,900 17,831,270
24 Burkina Faso 0.746 126,300 16,934,839
25 Malawi 0.746 122,000 16,362,567
26 Zambia 0.746 108,400 14,538,640
27 Senegal 0.746 105,400 14,133,280
28 Benin 0.746 77,000 10,323,474
29 Togo 0.746 50,800 6,816,982
30 Liberia 0.746 32,000 4,294,077
31 Lesotho 0.746 15,500 2,074,465
32 Russia 0.732 1,049,700 143,499,861
33 Tanzania 0.711 350,400 49,253,126
34 Côte d’Ivoire 0.711 144,500 20,316,086
35 Mali 0.711 108,900 15,301,650
36 Chad 0.711 91,200 12,825,314
37 Rwanda 0.711 83,800 11,776,522
38 Guinea 0.711 83,600 11,745,189
39 South Sudan 0.711 80,400 11,296,173
40 Burundi 0.711 72,300 10,162,532
41 Sierra Leone 0.711 43,300 6,092,075
Rank Country
Percent of
population
in modern
slavery
Estimated
population
in modern
slavery Population
42 Gambia 0.711 13,200 1,849,285
43 Djibouti 0.711 6,200 872,932
44 Thailand 0.709 475,300 67,010,502
45 Oman 0.709 25,800 3,632,444
46 Kuwait 0.709 23,900 3,368,572
47 Bahrain 0.709 9,400 1,332,171
48 Brunei 0.709 3,000 417,784
49 CapeVerde 0.637 3,200 498,897
50 Swaziland 0.536 6,700 1,249,514
51 Guinea-Bissau 0.500 8,500 1,704,255
52 Nigeria 0.481 834,200 173,615,345
53 Egypt 0.480 393,800 82,056,378
54 Algeria 0.480 188,200 39,208,194
55 Morocco 0.480 158,400 33,008,150
56 Malaysia 0.480 142,600 29,716,965
57 Jordan 0.480 31,000 6,459,000
58 Lebanon 0.480 21,400 4,467,390
59 Bangladesh 0.435 680,900 156,594,962
60 Iran 0.435 336,700 77,447,168
61 Myanmar 0.435 231,600 53,259,018
62 Afghanistan 0.435 132,800 30,551,674
63 North Korea 0.435 108,200 24,895,480
64 Yemen 0.435 106,100 24,407,381
65 Angola 0.435 93,400 21,471,618
66 Zimbabwe 0.435 61,500 14,149,648
67 Somalia 0.435 45,600 10,495,583
68 Eritrea 0.435 27,500 6,333,135
69 Libya 0.435 27,000 6,201,521
70 Equatorial Guinea 0.435 3,300 757,014
71 Ethiopia 0.414 389,700 94,100,756
72 Guyana 0.387 3,100 799,613
73 Bulgaria 0.380 27,600 7,265,115
74 Czech Republic 0.360 37,900 10,521,468
75 Hungary 0.360 35,600 9,897,247
76 Serbia 0.360 25,800 7,163,976
77 Slovakia 0.360 19,500 5,414,095
78 Georgia 0.360 16,100 4,476,900
79 Croatia 0.360 15,300 4,252,700
80
Bosnia and
Herzegovina
0.360 13,800 3,829,307
81 Armenia 0.360 10,700 2,976,566
82 Lithuania 0.360 10,600 2,956,121
83 Albania 0.360 10,000 2,773,620
21.20.
Country
Percent of
population in
modern slavery
Estimated
population in
modern slavery
77 Azerbaijan 0.359 33,800
78 Guatemala 0.218 33,800
79 Moldova 0.936 33,300
80 Tunisia 0.306 33,300
81 Liberia 0.746 32,000
82 Jordan 0.480 31,000
83 Madagascar 0.133 30,400
84 Tajikistan 0.359 29,500
85 Qatar 1.356 29,400
86 Bulgaria 0.380 27,600
87 Eritrea 0.435 27,500
88 Libya 0.435 27,000
89 Oman 0.709 25,800
90 Serbia 0.360 25,800
91 Mongolia 0.907 25,700
92 Lao PDR 0.359 24,300
93 Kuwait 0.709 23,900
94 Bolivia 0.218 23,300
95 Romania 0.113 22,600
96 Lebanon 0.480 21,400
97 Namibia 0.907 20,900
98 Kyrgyzstan 0.359 20,500
99 Slovakia 0.360 19,500
100 Turkmenistan 0.359 18,800
101 Botswana 0.907 18,300
102 Dominican Republic 0.175 18,200
103 Honduras 0.218 17,700
104 Papua New Guinea 0.230 16,800
105 Georgia 0.360 16,100
106 Lesotho 0.746 15,500
107 Croatia 0.360 15,300
108 Paraguay 0.218 14,800
109
Bosnia and
Herzegovina
0.360 13,800
110 El Salvador 0.218 13,800
111 Hong Kong 0.187 13,400
112 Nicaragua 0.218 13,300
113 Gambia 0.711 13,200
114 Belarus 0.122 11,500
115 Italy 0.019 11,400
116 Armenia 0.360 10,700
117 Lithuania 0.360 10,600
118 Germany 0.013 10,500
119 Costa Rica 0.210 10,200
120 Albania 0.360 10,000
121 Bahrain 0.709 9,400
Country
Percent of
population in
modern slavery
Estimated
population in
modern slavery
122 France 0.013 8,600
123 Guinea-Bissau 0.500 8,500
124 United Kingdom 0.013 8,300
125 Panama 0.210 8,100
126 Macedonia 0.360 7,600
127 Slovenia 0.360 7,400
128 Uruguay 0.210 7,100
129 Swaziland 0.536 6,700
130 Israel 0.081 6,500
131 Djibouti 0.711 6,200
132 Spain 0.013 6,100
133 Singapore 0.100 5,400
134 Suriname 0.907 4,900
135 Estonia 0.360 4,800
136 Canada 0.013 4,600
137 Kosovo 0.248 4,500
138 Jamaica 0.155 4,200
139 Cyprus 0.360 4,100
140 Gabon 0.248 4,100
141 Cuba 0.036 4,100
142 Timor-Leste 0.340 4,000
143 Equatorial Guinea 0.435 3,300
144 Mauritius 0.254 3,300
145 CapeVerde 0.637 3,200
146 Guyana 0.387 3,100
147 Brunei 0.709 3,000
148 Taiwan 0.013 3,000
149 Australia 0.013 3,000
150 Trinidad and Tobago 0.169 2,300
151 Latvia 0.113 2,300
152 Montenegro 0.360 2,200
153 Netherlands 0.013 2,200
154 Belgium 0.013 1,500
155 Greece 0.013 1,400
156 Portugal 0.013 1,400
157 Sweden 0.013 1,200
158 Austria 0.013 1,100
159 Switzerland 0.013 1,100
160 Denmark 0.013 700
161 Finland 0.013 700
162 Norway 0.013 700
163 New Zealand 0.013 600
164 Barbados 0.149 400
165 Ireland 0.007 300
166 Luxembourg 0.013 100
167 Iceland 0.007 100
Estimates of people in modern slavery by absolute number
The countries with the highest numbers of people in modern slavery are India, China, Pakistan, Uzbekistan, Russia,
Nigeria, the Democratic Republic of the Congo, Indonesia, Bangladesh, and Thailand.Taken together, these countries
account for 71 percent of the estimated 35.8 million people in modern slavery.The following table presents countries in
order from highest number of people in modern slavery to the lowest.
Countries by absolute estimates of modern slavery, from highest to lowest.
Country
Percent of
population in
modern slavery
Estimated
population in
modern slavery
1 India 1.141 14,285,700
2 China 0.239 3,241,400
3 Pakistan 1.130 2,058,200
4 Uzbekistan 3.973 1,201,400
5 Russia 0.732 1,049,700
6 Nigeria 0.481 834,200
7
Democratic Republic
of the Congo
1.130 762,900
8 Indonesia 0.286 714,100
9 Bangladesh 0.435 680,900
10 Thailand 0.709 475,300
11 Sudan 1.130 429,000
12 Egypt 0.480 393,800
13 Ethiopia 0.414 389,700
14 Tanzania 0.711 350,400
15 Iraq 1.035 345,900
16 Iran 0.435 336,700
17 Vietnam 0.359 322,200
18 Mexico 0.218 266,900
19 Philippines 0.266 261,200
20 Syria 1.130 258,200
21 Haiti 2.304 237,700
22 Japan 0.187 237,500
23 Myanmar 0.435 231,600
24 Nepal 0.823 228,700
25 Ghana 0.746 193,100
26 Mozambique 0.746 192,600
27 Algeria 0.480 188,200
28 Turkey 0.248 185,500
29 Morocco 0.480 158,400
30 Cambodia 1.029 155,800
31 Mauritania 4.000 155,600
32 Brazil 0.078 155,300
33 Côte d’Ivoire 0.711 144,500
34 Malaysia 0.480 142,600
35 Uganda 0.359 135,000
36 Niger 0.746 132,900
37 Afghanistan 0.435 132,800
38 Burkina Faso 0.746 126,300
Country
Percent of
population in
modern slavery
Estimated
population in
modern slavery
39 Malawi 0.746 122,000
40 Ukraine 0.248 112,600
41 Mali 0.711 108,900
42 Zambia 0.746 108,400
43 North Korea 0.435 108,200
44 Yemen 0.435 106,100
45 South Africa 0.200 106,000
46 Senegal 0.746 105,400
47 Colombia 0.218 105,400
48 United Arab Emirates 1.057 98,800
49 South Korea 0.187 93,700
50 Angola 0.435 93,400
51 Chad 0.711 91,200
52 Saudi Arabia 0.292 84,200
53 Rwanda 0.711 83,800
54 Guinea 0.711 83,600
55 South Sudan 0.711 80,400
56 Cameroon 0.359 79,900
57 Argentina 0.187 77,300
58 Benin 0.746 77,000
59 Sri Lanka 0.359 73,600
60 Burundi 0.711 72,300
61 Poland 0.187 71,900
62 Peru 0.218 66,300
63 Kenya 0.146 64,900
64 Zimbabwe 0.435 61,500
65 Kazakhstan 0.359 61,200
66 Venezuela 0.200 60,900
67 United States 0.019 60,100
68
Central African
Republic
1.130 52,200
69 Togo 0.746 50,800
70
Republic of the
Congo
1.106 49,200
71 Somalia 0.435 45,600
72 Sierra Leone 0.711 43,300
73 Czech Republic 0.360 37,900
74 Chile 0.210 36,900
75 Hungary 0.360 35,600
76 Ecuador 0.218 34,300
23.22.
The Netherlands has the strongest response to modern slavery of the 167 countries examined, scoring highly across victim
assistance programmes, criminal justice responses, and responding to institutional risk.The Netherlands includes the private
sector in its National Action Plan and conducts independent evaluations.
Other governments in the top ten responses are, Sweden, the United States, Australia, Switzerland, Ireland, Norway,
the United Kingdom, Georgia and Austria. Common characteristics of each of these countries are a strong political
will to respond to the issue and a strong rule of law.These countries are also starting to take ownership of the link
between business and modern slavery. In Brazil, companies that profit from slave labour are named and shamed. In the
US, the government has taken steps to ensure its procurement practices are not contributing to modern slavery. In Australia,
public procurement rules identify modern slavery as an important issue when considering the ethical behaviour of suppliers,
but it is not clear if this has translated to action yet.
While these efforts are commendable, most countries within the top ten responses have strong economies, and also
benefit from low prevalence and low risk across all vulnerability dimensions (indicating state stability, respect for
human rights and rule of law). Despite these strong economies, none of these countries have a perfect response to modern
slavery. In the US, victim support services are currently underfunded, and skewed towards supporting victims of sexual
exploitation, but not forced labour despite recent studies confirming the significance of this problem.Victim support services
in the Netherlands also focus predominately on those who experience commercial sexual exploitation.
The actions of Georgia deserve credit – despite having a weaker economy than many countries covered by the Index and
ranking 78th in the Global Slavery Index for prevalence, the government has taken some strong steps to eradicate modern
slavery. More, however, could be done to provide training to those who would ordinarily identify victims, and to address
vulnerability factors.
In several of the countries in the top ten of responses, there is evidence of discriminatory migration policies, deportation
of potential victims without sufficient screening, or criminalisation of victims for actions whilst under the control of
criminals.The United Kingdom, for example, has been accused of deporting, or detaining in immigration detention centres,
foreign migrants who are potential victims of modern slavery.There are inconsistencies in Australia’s screening processes of
vulnerable migrant populations, such as asylum seekers, for indicators of trafficking.There have also been reports of children
being treated as offenders in the United States for conduct committed as a direct result of being sold to others for sexual
exploitation. Unaccompanied minors can also be subject to fast track screening and deportation at border points making it
very unlikely for modern slavery to be detected.
Countries at the lower end of the ranking include North Korea, Iran, Syria, Eritrea, the Central African Republic,
Libya, Equatorial Guinea, Uzbekistan, the Republic of the Congo and Iraq.These countries are characterised by weak
economies, high levels of instability caused by recent conflict, such as Libya and Syria, or government complicity in modern
slavery. Uzbek cotton, produced with forced labour, is exported to Bangladesh, South Korea and China. In North Korea,
prisoners in the gulag system – or forced labour camps – produce hardwoods for export to Japan.The forced labour systems
in both Uzbekistan and North Korea are major contributors to their national economies.
Hong Kong, Kuwait and Saudi Arabia each have either a strong or middle range economy, but have a particularly
poor response to modern slavery.The kafala system, which ties an employee to an employer, has facilitated to significant
abuses of domestic and construction workers in the Middle East. Hong Kong is part of a small group of countries in South
East Asia, such as Japan, Malaysia and Singapore, who, despite their relative wealth, have done little to respond to the
problem within their borders.
Overall, many countries appear to have responses in place on paper, yet modern slavery still persists.This indicates that
these responses are either not fit for purpose, or are not being fully implemented, or a combination of the two. Countries
in South East Asia, such as Thailand and Indonesia, appear to have strong responses on paper, but these are often
poorly implemented, or are hampered by high levels of corruption.
How are governments tackling modern slavery?
While no country has a fully comprehensive response to modern slavery, most countries within the Index are taking
some action to respond to the problem.
All countries, with the exception of North Korea, have domestic legislation which criminalises some form of
modern slavery.This ranges from articles in their penal codes criminalising forced labour or child commercial sexual
exploitation, through to fully fledged counter trafficking legislation.Australia and the United Kingdom currently criminalise
all forms of modern slavery, including forced marriage.While in most countries there is room for improvement, some
laws do exist to hold perpetrators to account in almost every country, which suggests much more could be done within
existing frameworks.
Many countries have developed a national action plan to respond to forms of modern slavery (101 of 167 countries), and
some have a national coordination body (140 of 167 countries). Nearly all countries participate in a relevant regional
response (165 of 167 countries).
Identifying victims is a critical first step to ensuring that they are removed from harm and provided with support. Most
governments provide some training to front line law enforcement on how to identify victims (150 of 167). In 2014,
the Index does not take into account the scale or quality of the training. Fewer governments, however, are providing training
for other potential ‘first responders’, that is those in the health and social services, teachers, or those who work in the tourism
industry, who may also come into contact with victims. Ireland,Argentina, and Montenegro are particularly strong in
running regular and systematic training for ‘first responders’.
Victim assistance for men, women and children is a weakness of all government responses. No country scored 100
percent on these activities while the majority of countries scored 50 percent or lower. Most countries either only provide
short term assistance, neglecting long-term reintegration, or provide support solely for female or child victims.
Many countries are taking steps to respond to attitudes or institutions that enable modern slavery to exists
(165 of 167). Of these governments, approximately 93 percent run public information campaigns to raise awareness of
modern slavery, while only eight percent focus on behaviour change. Many countries also have in place safety nets, such as
child protection systems, and protections for Internally Displaced Persons (IDPs), asylum seekers and stateless people (120 of
167 countries).While these protections may exist in paper, the challenge is how to assess if such protections operate in reality.
Globally, only three governments are making some efforts to prevent the use of forced or slave labour in their
supply chains, and in the supply chains of businesses operating in their country. These include the United States,
Brazil and Australia.These countries have either made a public commitment to address modern slavery within their own
supply chains, such as Australia, or have taken more active steps to ensure supply chain transparency, such the United States’
Executive Order, or Brazil’s Register of Companies (the Dirty List).
Brazil’s Dirty List and National Pact:
Brazil’s ‘dirty list’ publicly names and shames companies that have been found to be profiting from slave labour.
Companies, from major brands to small enterprises, stay on the list for two years, during which time they have
to prove they are making efforts to clean up supply chains.They cannot obtain credit from the government and
private banks and are boycotted by those who signed up to the list.
The ‘National Pact for the Eradication of Slave Labour’ was launched in 2005, and brings together multiple
stakeholders who are committed to end modern slavery.The Ethos Institute, the Social Observatory, the Social
Observatory Institute (IOS), the International Labour Organisation (ILO) and the Non-Government Organisation
(NGO) Reporter Brazil work with Brazilian and multinational companies that have signed the Pact to maintain
slavery free supply chains.
United States Executive Order 13627:
As the largest single purchaser of goods and services in the world, the United States Government has taken
important steps to ensure that its procurement practices are not contributing to modern slavery. President Obama
introduced the “Strengthening Protections Against Trafficking in Persons in Federal Contracts” order in 2012,
which strengthens the US Government’s existing zero-tolerance policy on human trafficking in government
contracting.The order will require federal contractors and sub-contractors to take specific preventative measures
to address and eliminate modern slavery in their supply chains. It requires contracts exceeding $US500,000
performed abroad to develop robust risk assessment and compliance plans.
25.24.
*	
The USA was capped at a BBB due to evidence of criminalisation of victims, and risk of deportation of potential vicitms.
Rank of countries by government response
Rank Country Rating
1 Netherlands AA
2 Sweden A
3 United States BBB*
4 Australia BBB
5 Switzerland BBB
6 Ireland BBB
7 Norway BBB
8 United Kingdom BBB
9 Georgia BBB
10 Austria BBB
11 Belgium BBB
12 Croatia BBB
13 Spain BBB
14 Brazil BB
15 Montenegro BB
16 Canada BB
17 Hungary BB
18 Slovakia BB
19 Macedonia BB
20 Argentina BB
21 Denmark BB
22 Poland BB
23 Portugal BB
24 Serbia BB
25 Germany BB
26 France BB
27 New Zealand BB
28 Latvia BB
29 Philippines BB
30 Taiwan BB
31 Slovenia BB
32 Italy BB
33 Finland B
34 Jamaica B
35 Czech Republic B
36 Nepal B
37 Romania B
38 Cyprus B
39 Paraguay B
40 United Arab Emirates B
41 Chile B
42 Nigeria B
Rank Country Rating
43 Mexico B
44 Lithuania B
45 Iceland B
46 Bulgaria B
47 Indonesia B
48 Thailand B
49 Guatemala B
50 Israel B
51 Azerbaijan B
52 Nicaragua B
53 Greece B
54 Peru B
55 Estonia CCC
56 Jordan CCC
57 Luxembourg CCC
58 Ukraine CCC
59 India CCC
60 Bangladesh CCC
61 Costa Rica CCC
62 Zambia CCC
63 Albania CCC
64 Sri Lanka CCC
65 Belarus CCC
66 Senegal CCC
67 Barbados CCC
68 Uruguay CCC
69 Mauritius CCC
70 Sierra Leone CCC
71 Moldova CCC
72 Bosnia and Herzegovina CCC
73 Vietnam CCC
74 Mongolia CCC
75 Dominican Republic CCC
76 South Korea CCC
77 Armenia CCC
78 Uganda CCC
79 Cambodia CCC
80 Cameroon CCC
81 Ecuador CCC
82 Turkey CCC
83 Ghana CCC
84 Japan CCC
Rank Country Rating
85 South Africa CCC
86 Panama CCC
87 Malaysia CCC
88 Trinidad and Tobago CCC
89 Colombia CCC
90 Benin CCC
91 China CCC
92 Kosovo CCC
93 Myanmar CCC
94 Malawi CCC
95 Egypt CC
96 Liberia CC
97 Bolivia CC
98 Honduras CC
99 Tajikistan CC
100 Gabon CC
101 Ethiopia CC
102 Côte d’Ivoire CC
103 El Salvador CC
104 Gambia CC
105 Kenya CC
106 Lao PDR CC
107 Guyana CC
108 Bahrain CC
109 Kazakhstan CC
110 Namibia CC
111 Togo CC
112 Mozambique CC
113 Botswana CC
114 Qatar CC
115 Rwanda CC
116 Madagascar CC
117 Timor-Leste CC
118 CapeVerde CC
119 Afghanistan CC
120 Burkina Faso CC
121 Mauritania CC
122 Venezuela CC
123 Burundi CC
124 Lesotho CC
125 Pakistan CC
126 Singapore CC
Rank Country Rating
127 Lebanon C
128 Guinea C
129 Tunisia C
130 Brunei C
131 Oman C
132 Suriname C
133 Guinea-Bissau C
134 Yemen C
135 Kyrgyzstan C
136 Russia C
137 Tanzania C
138 Angola C
139 Algeria C
140 Cuba C
141 Djibouti C
142 Zimbabwe C
143 Niger C
144 Democratic Republic of the Congo C
145 Chad C
146 Mali C
147 Haiti C
148 Papua New Guinea C
149 Swaziland C
150 Sudan C
151 Kuwait C
152 Saudi Arabia C
153 South Sudan C
154 Hong Kong C
155 Somalia C
156 Morocco C
157 Turkmenistan D
158 Iraq D
159 Republic of the Congo D
160 Uzbekistan D
161 Equatorial Guinea D
162 Libya D
163 Central African Republic D
164 Eritrea D
165 Syria D
166 Iran D
167 North Korea D
27.26.
Rating description
Rating Numerical range Description
AAA 59 to 64 The government has an implemented an effective and comprehensive response to all forms of modern slavery,
with effective emergency and long-term reintegration victim support services, a strong criminal justice
framework, high levels of coordination and collaboration, measures to address all forms of vulnerability, and
strong government procurement policies and legislation to ensure that slavery is not present in business supply
chains.There is no evidence of criminalisation or deportation of victims.
AA 53 to 58 The government has implemented a comprehensive response to most forms of modern slavery, with strong
victim support services, a robust criminal justice framework, demonstrated coordination and collaboration,
measures to address vulnerability, and government procurement guidelines and/or supply chain policies or
legislation to ensure that slavery is not present in business supply chains.
A 47 to 52 The government has implemented key components of a holistic response to some forms of modern slavery,
with strong victim support services, a strong criminal justice framework, demonstrated coordination and
collaboration, measures to address vulnerability, and may have taken action to ensure that government
procurement policies do not encourage slavery.
BBB 41 to 46 The government has implemented key components of a holistic response to modern slavery, with victim
support services, a strong criminal justice response, evidence of coordination and collaboration, and protections
in place for vulnerable populations. Governments may be beginning to address slavery in supply chains of
government procurement, or of businesses operating within their territory.There may be evidence that some
government policies and practices may criminalise and/or cause victims to be deported.
BB 35 to 40 The government has introduced a response to modern slavery, which includes short term victim support
services, a criminal justice framework that criminalises some forms of modern slavery, a body to coordinate the
response, and protections for those vulnerable to modern slavery.There may be evidence that some government
policies and practices may criminalise and/or cause victims to be deported, and/or facilitate slavery.
B 29 to 34 The government has introduced a response to modern slavery, with limited victim support services, a criminal
justice framework that criminalises some forms of modern slavery, (or has recently amended inadequate
legislation and policies), a body or mechanisms that coordinate the response, and has policies that provide
some protection for those vulnerable to modern slavery.There is evidence that some government policies
and practices may criminalise and/or deport victims, and/or facilitate slavery. Services may be provided by
International Organisations (IOs)/ NGOs with international funding, sometimes with government monetary
or in-kind support.
CCC 23 to 28 The government has a limited response to modern slavery, with limited victim support services, a criminal
justice framework that criminalises some forms of modern slavery, has a national action plan and/or national
coordination body, and has policies that provide some protections for those vulnerable to modern slavery.
There is evidence that some government policies and practices may criminalise and/or deport victims, and/
or facilitate slavery. Services may be largely provided by IOs/NGOs with international funding, with limited
government funding or in-kind support.
CC 17 to 22 The government has a limited response to modern slavery, with largely basic victim support services, a limited
criminal justice framework, limited coordination or collaboration mechanism, and few protections for those
vulnerable to modern slavery.There may be evidence that some government policies and practices facilitate
slavery. Services are largely provided by IOs/NGOs with limited government funding or in-kind support.
C 11 to 16 The government response to modern slavery is inadequate, with limited and/or few victim support services,
a weak criminal justice framework, weak coordination or collaboration, while little is being done to address
vulnerability.There are government practices and policies that facilitate slavery. Services, where available, are
largely provided by IOs/NGOs with little government funding or in-kind support.
D 0 to 10 The government has a wholly inadequate response to modern slavery, and/ or there is evidence of government
sanctioned modern slavery. However, countries in this category may be experiencing high levels of poverty
and internal conflict that may prevent, or hinder a response to modern slavery.
Measuring vulnerability
In 2014, the Global Slavery Index examines the relative vulnerability of the population in individual countries to modern
slavery, based on an analysis of data across five dimensions:
1.	 National policies to combat modern slavery.
2.	 The availability of human rights protections in a country.
3.	 The level of economic and social development in a country.
4.	 The level of state stability in a country.
5.	 The extent of women’s rights and levels of discrimination in a country.
In 2014, the ten countries where vulnerability is highest were: Somalia, Eritrea, Sudan,Yemen, the Democratic Republic
of the Congo, the Central African Republic, Syria, Libya, North Korea, and Afghanistan.
In an effort to better understand the relative significance of each of the dimensions noted above, we undertook statistical
testing (bivariate analysis) to examine the correlations between these dimensions, and prevalence of modern slavery.
Correlation results confirm that the relationship between each of these dimensions and prevalence is statistically significant.
The strongest relationships (in order of strongest to weakest) are seen between:
●● State Stability and Prevalence (r = 0.55,p.01)
●● Human Rights and Prevalence (r = 0.53,p.01)
●● Development and Prevalence (r = 0.41,p.01)
●● Discrimination and Prevalence (r =0.40,p.01)
●● State Policy on Modern Slavery and Prevalence (r = 0.38,p.01)
Each of these results is statistically significant indicating the relationship is not the result of chance (the closer r is to 1, the
stronger the relationship between the two variables).
The stability or instability of a country is a significant factor; protective policies will have little impact when a country’s rule
of law has broken down because of civil war, or ethnic or religious conflict. In the Global Slavery Index the State Stability
measure is an aggregate of factors that examine a country’s level of corruption, governance, independence of its judiciary,
relative level of peace, political stability, level of violent crime, and availability of small arms and light weapons. Statistical
testing confirms the relevance of modern slavery to conflict situations as we have seen this year in Syria and the horrors
perpetrated by the terrorist group Islamic State.
Correlation between state stability and prevalence (r = 0.55, p.01)
05101520
SLAVERY
0 20 40 60 80
STATE STABILITY VULNERABILITY
29.28.
High levels of prejudice and discrimination in a society can create a context that marks some people as less important and
less deserving of rights and protection, which in turn makes the crime of modern slavery easier to commit against them. In
the Global Slavery Index seven variables are used to measure the extent and types of discrimination.These factors include
factors of discrimination on the basis of sexual orientation, disability, immigration status, ethnicity, women’s political and
economic rights, and the level of income inequality (Gini coefficient) in a given country. Statistical testing confirms the
relationship between discrimination and prevalence of modern slavery.
Correlation between discrimination vulnerability and prevalence (r =0.40, p.01)
The full methodology is available in Appendix 2, and the full data table for vulnerability is in Appendix 3.
05101520
0 20 40 60 80 100
SLAVERY
DISCRIMINATION VULNERABILITY
Image – Panos Pictures
Regional Analysis
and Selected
Country Studies
Image – G.M.B.Akash
BBB
CCB
CCC
CCC
CCCD CCC
CC
C
BB
CCC
CCC
BB
C
CCC CCC CC C
CCC
BB
CCCB
CCCC
CCC
B
MONGOLIA
CHINA
NEPAL
AUSTRALIA
MYANMAR
THAILAND
NEW ZEALAND
BANGLADESH
INDIA
SOUTH KOREANORTH KOREA
AFGHANISTAN
LAO PDR
VIETNAM
PHILIPPINES
CAMBODIA
TIMOR-LESTE PAPUA
NEW GUINEA
MALAYSIA
INDONESIA
SRI LANKA
PAKISTAN
JAPAN
SINGAPORE BRUNEI
HONG KONG,
SAR CHINA
TAIWAN
33.32.
ASIA PACIFIC
Estimated Number Living in Modern Slavery 23,542,800
Regional Proportion of Global Estimate 65.8% of 35.8 million people in modern slavery
are in Asia Pacific
Average Government Response Rating  CC
Average Vulnerability Score 49.9%
Prevalence
Regional rank Country
Percent of population
in modern slavery
Estimated population
in modern slavery Population
1 India 1.141 14,285,700 1,252,139,596
2 Pakistan 1.130 2,058,200 182,142,594
3 Cambodia 1.029 155,800 15,135,169
4 Mongolia 0.907 25,700 2,839,073
5 Nepal 0.823 228,700 27,797,457
6 Thailand 0.709 475,300 67,010,502
7 Brunei 0.709 3,000 417,784
8 Malaysia 0.480 142,600 29,716,965
9 Bangladesh 0.435 680,900 156,594,962
10 Myanmar 0.435 231,600 53,259,018
11 Afghanistan 0.435 132,800 30,551,674
12 North Korea 0.435 108,200 24,895,480
13 Vietnam 0.359 322,200 89,708,900
14 Sri Lanka 0.359 73,600 20,483,000
15 Lao PDR 0.359 24,300 6,769,727
16 Timor-Leste 0.340 4,000 1,178,252
17 Indonesia 0.286 714,100 249,865,631
18 Philippines 0.266 261,200 98,393,574
19 China 0.239 3,241,400 1,357,380,000
20 Papua New Guinea 0.230 16,800 7,321,262
21 Japan 0.187 237,500 127,338,621
22 South Korea 0.187 93,700 50,219,669
23 Hong Kong 0.187 13,400 7,187,500
24 Singapore 0.100 5,400 5,399,200
25 Taiwan 0.013 3,000 23,340,000
26 Australia 0.013 3,000 23,130,900
27 New Zealand 0.013 600 4,470,800
In 2014, almost two-thirds (65.8 percent) of the estimated 35.8 million people in modern
slavery globally are in the Asia Pacific region. Modern slavery exists in the Asia Pacific region in
all its forms, including forced labour,7
trafficking for sexual exploitation, and forced marriage.8
Throughout the region, particularly in countries such as India and Pakistan, nationals – often
including entire families – are enslaved through bonded labour in construction, agriculture, brick
making, garment factories and manufacturing.Asian nationals who migrate for low and semi-skilled
job opportunities abroad are disproportionately vulnerable to forced labour, particularly throughout
the Middle East. Men from Nepal, Sri Lanka and Bangladesh working in the Middle East are
in forced labour in the construction industry, while women from the same countries, and the
Philippines and Indonesia, have been subject to sexual exploitation and modern slavery in domestic
7	
“Increasing Evidence of Forced Labour Across Asia Says New IOM Report”, International Organisation for Migration, last modified January 8, 2013,
accessed 18/08/14: http://www.iom.int/cms/en/sites/iom/home/news-and-views/press-briefing-notes/pbn-2013/pbn-listing/increasing-evidence-
of-forced-la.html
8	
Walk Free Foundation, Global Slavery Index, (Walk Free Foundation, 2013), p. 23, accessed 03/09/14: http://www.globalslaveryindex.org/
report/#view-online
“When I was 13, my father
arranged my marriage with
a 45-year-old man, who
promised my family money
in exchange for me. I was
very unhappy with him, but
endured life with him for
one year before running back
to my home. My father was
very angry when I returned.
He beat me and yelled at me
to return to my husband, but
not even his heavy beatings
were worse than life with my
husband.When I refused
to return, my father dug a
deep hole in the ground. He
forced me into it and began
to bury me. I still wonder if
he really would have buried
me alive if the neighbours
hadn’t heard my screaming
and stopped him.”.
Shahida, a 13 year old
victim of forced marriage
in Afghanistan.
Low High
Estimated Prevalence of Modern Slavery Government Response to Modern Slavery Rating
AAAAAA BBB BB B CCC CC C DDD DD D
The alphabetical depiction is a ‘rating’ of the strength of government
responses to modern slavery.The highest possible rating is an AAA, and
the lowest a D.
The colour of the countries as shown on this map designate from lowest
to highest prevalence of modern slavery.
Those in grey were not included in the Index.
“Stories of Hope – Shahida”, Hagar
International, last modified 2012, accessed
16/10/14: http://hagarinternational.org/
international/shahida/
Image–PanosPictures
35.34.
or carers work9
.The phenomenon of ‘baby-trafficking’10
– or selling babies under the guise of adoption – and human
trafficking for the purpose of forced marriage is an increasing concern in parts of the Asia Pacific region.11
Within the Asia Pacific region, the combined totals of India, Pakistan andThailand equal almost 50 percent of the total number
of people living in modern slavery globally.The high prevalence of modern slavery in the region reflects the reality that many
countries in South and South East Asia provide the low-skilled labour at the production stage of global supply chains for various
industries including food production, garments, and technology.12
There are also several countries within this region with low
levels of prevalence, including Australia and New Zealand.
Government Response
Regional rank Country
Survivors are
supported Criminal justice
Coordination
and
accountability
Attitudes, social
systems and
institutions
Business and
government Rating
1 Australia 72.2 88.1 66.7 81.3 50 BBB
2 New Zealand 50 66.7 41.7 87.5 0 BB
3 Philippines 61.1 71.4 58.3 56.3 0 BB
4 Taiwan 61.1 61.9 50 62.5 0 BB
5 Nepal 44.4 73.8 58.3 62.5 0 B
6 Indonesia 50 54.8 50 62.5 0 B
7 Thailand 50 61.9 58.3 50 0 B
8 India 50 47.6 33.3 62.5 0 CCC
9 Bangladesh 38.9 61.9 50 50 0 CCC
10 Sri Lanka 38.9 33.3 58.3 62.5 0 CCC
11 Vietnam 38.9 45.2 58.3 43.8 0 CCC
12 Mongolia 50 59.5 16.7 50 0 CCC
13 South Korea 33.3 42.9 25 62.5 0 CCC
14 Cambodia 44.4 66.7 41.7 37.5 0 CCC
15 Japan 44.4 35.7 33.3 43.8 0 CCC
16 Malaysia 50 40.5 33.3 31.3 0 CCC
17 China 33.3 40.5 41.7 43.8 0 CCC
18 Myanmar 38.9 33.3 66.7 31.3 0 CCC
19 Lao PDR 27.8 54.8 41.7 25 0 CC
20 Timor-Leste 33.3 40.5 16.7 43.8 0 CC
21 Afghanistan 38.9 40.5 25 31.3 0 CC
22 Pakistan 33.3 33.3 33.3 31.3 0 CC
23 Singapore 33.3 19 41.7 31.3 0 CC
24 Brunei 22.2 35.7 16.7 37.5 0 C
25 Papua New Guinea 27.8 26.2 8.3 18.8 0 C
26 Hong Kong 27.8 14.3 16.7 25 0 C
27 North Korea 0 0 8.3 0 0 D
9	
NishaVaria, Dispatches: New Protection for Saudi Arabia’s DomesticWorkers, (Human Rights Watch, 2014), accessed 03/09/14: http://www.hrw.org/news/2014/02/19/dispatches-new-
protection-saudi-arabia-s-domestic-workers
10	
“Child trafficking statistics”, All Girls Allowed, last modified 2013: http://www.allgirlsallowed.org/child-trafficking-statistics;
See also Lizzy Parry,“Chinese Police bust four major baby trafficking rings rescuing 382 abducted infants and arresting nearly 2,000 suspects”, The Daily Mail, March 11, 2014, accessed
03/09/14: http://www.dailymail.co.uk/news/article-2570484/Chinese-police-bust-four-major-baby-trafficking-rings-rescuing-382-abducted-children-arresting-nearly-2-000-suspects.html
11	
Asia Forum 9 Parliamentarians on Population and Development (AFPPD) and Global Alliance Against Traffic in Women (GAATW), HumanTrafficking in South-East Asia: Policy Brief, (AusAID,
AFPPD, GAATW, 2013), accessed 18/08/14: http://www.afppd.org/files/1113/8206/9530/Policy_Brief.pdf
12	
As above, p. 3
In 2013-14, governments throughout the Asia Pacific region continued to implement measures to combat modern slavery.
Of the 25 countries measured in the region, 24 have legislation that criminalises some form of modern slavery. In particular,
Australia and India implemented substantial legislative reforms to support the criminalisation of modern slavery, while
Mongolia andVietnam adopted standalone anti-trafficking laws in 2012.13
North Korea is the only country in Asia Pacific –
and in the world – that has not explicitly criminalised any form of modern slavery.
Legislation on its own is not enough to ensure success of a criminal justice response to modern slavery.Accordingly, it is
significant that 22 of the 25 countries in this region had some form of specialist law enforcement unit in place. For example,
India improved law enforcement efforts by establishing 215 anti-human trafficking units across the country to investigate
human trafficking cases.While impressive, funding was not always reflective of the individual units’ needs. Indian government
data, for example, suggests only 13 offenders were convicted in 2013.14
In many countries, there is a gap between the policies that exist on paper and the reality of efforts to implement and enforce
these in practice. One measure of this relates to efforts taken by countries to monitor implementation of their national action
plans. Of the 17 countries in this region that have a national action plan to combat some form of modern slavery, only seven
have an implementation strategy or national coordinating body to monitor the implementation of the plan.
While countries in the Asia Pacific region have varying levels of economic development, not all of the wealthier countries in
the region score strongly on government responses. Japan’s low score for government responses stands out given their relative
wealth compared to countries in the region with comparatively stronger responses, such as Nepal and the Philippines.
Despite several countries throughout the Asia Pacific region being at the production end of global supply chains, only
Australia has made a policy commitment to address modern slavery throughout government procurement processes.15
Recent global scrutiny of Bangladeshi ready-made garment factories, the Thai16
and Bangladeshi17
shrimp industries, and
fishing practices in New Zealand waters18
has revealed the pervasiveness of forced labour practices, including non-payment
of wages, illegal confiscation of identity documents, restriction of movement, and sexual, physical and psychological abuse by
employers.This highlights the need for governments to focus on the link between modern slavery and supply chains.
Regional collaboration continued to be a focus, with various countries forming partnerships to support victim repatriation,
cross-border investigations and prevention initiatives.The Association of South East Asian Nations (ASEAN) continued to
be a leader in regional anti-trafficking initiatives; the 2014 Senior Officials Meeting on Transnational Crime (SOMTC)
focused on continuing joint efforts to implement the Regional Plan of Action to Combat Trafficking in Persons (RPA).19
Over the last five years,Thailand and Myanmar have continued to strengthen their border cooperation to combat trafficking
in persons, and member countries of the Coordinated Mekong Ministerial Initiative against Trafficking (COMMIT)20
–
the sub-regional initiative coordinating responses to human trafficking in the Greater Mekong Sub-region – continue to
undertake joint law enforcement training.21
13	
Jargalan Avkhia , Naran Munkhbat  Tirza Theunissen,“Mongolia Strengthens Efforts to Prevent and Combat Trafficking in Persons”, Asia Foundation, March 12, 2014, accessed 03/09/14:
http://asiafoundation.org/in-asia/2014/03/12/mongolia-strengthens-efforts-to-prevent-and-combat-trafficking-in-persons/
14	
Ministry of Home Affairs, Data on HumanTrafficking during 2013, (Government of India, 2013), accessed 11/3/14: http://www.stophumantrafficking-mha.nic.in/writereaddata/DATA%20
ON%20HUMAN%20TRAFFICKING%20IN%20INDIA%20DURING%202013%20(As%20on%2021_01_2014).pdf
15	
Government of Australia,“Progress Report”, Walk Free Foundation, last modified 30/04/14, accessed 03/09/14: http://www.globalslaveryindex.org/country/australia/
16	
The Hidden Cost: Human Rights Abuses inThailand’s Shrimp Industry, (Humanity United  Environmental Justice Foundation, 2014), accessed 18/08/14: http://ejfoundation.org/sites/default/
files/public/shrimp_report_v44_lower_resolution.pdf
17	
Impossibly Cheap:Abuse and Injustice in Bangladesh’s Shrimp Industry, (Environmental Justice Foundation, 2014), p. 4, accessed 02/09/14: http://ejfoundation.org/sites/default/files/public/
Impossibly_Cheap_Web.pdf
18	
Christina Stringer, Glenn Simmons and Daren Coulston, Not in New Zealand’s waters, surely? Labour and human rights abuses abroad fishing vessels, (New Zealand Asia Institute Working Paper
Series,2011), No. 11-01, accessed 02/09/14: http://docs.business.auckland.ac.nz/Doc/11-01-Not-in-New-Zealand-waters-surely-NZAI-Working-Paper-Sept-2011.pdf
19	
“ASEAN Strengthens Cooperation in Fight Against Transnational Crime”, Association of Southeast Asian Nations, June 27, 2014, accessed 02/09/14: http://www.asean.org/news/asean-
secretariat-news/item/asean-strengthens-cooperation-in-fight-against-transnational-crime
20	
“COMMIT:The Coordinated Mekong Ministerial Initiative Against Trafficking”, United Nations Inter-Agency Project on HumanTrafficking, accessed 02/009/14: http://www.no-trafficking.org/
commit.html
21	
United Nations Inter-Agency Project on HumanTrafficking (UNI-AP) Final Report Phase III: 2007 – 2014, (United Nations Inter-Agency Project on Human Trafficking, 2014), accessed 23/09/14:
http://un-act.org/publication/view/uniap-final-report-phase-iii-2007-2014/
ASIA PACIFIC (continued)
Image – Panos Pictures
37.36.
Vulnerability (A higher score indicates higher vulnerability)
Regional rank Country Slavery Policy Human Rights Development State Stability Discrimination Mean
1 North Korea 85.9 100 59.8 75.1 58.8 75.2
2 Afghanistan 78.8 69.8 91.9 79.3 54.4 75.1
3 Myanmar 68.2 91.8 71.8 61.8 64.5 72.3
4 Pakistan 85.9 79.2 60.4 68.9 60.0 69.5
5 Papua New Guinea 89.4 28.5 65.9 48.2 89.3 65.0
6 Cambodia 75.3 58.8 54.8 65.3 63.6 62.9
7 Lao PDR 61.1 97.3 61.5 49.8 50.0 62.6
8 China 57.6 91.9 42.2 46.2 53.3 59.0
9 Malaysia 78.8 77.4 35.6 30.4 71.5 58.1
10 Bangladesh 75.3 62.0 67.3 58.6 30.0 57.3
11 India 85.9 58.9 54.0 56.5 38.3 56.7
12 Sri Lanka 64.6 69.7 47.1 58.9 34.2 55.7
13 Vietnam 47.0 91.8 45.1 49.4 41.7 54.3
14 Timor-Leste 71.7 23.0 60.5 58.2 57.0 54.2
15 Indonesia 47.0 70.0 51.9 49.6 56.0 53.7
16 Nepal 61.1 61.7 64.9 50.7 30.1 53.2
17 Thailand 57.6 60.0 40.0 44.6 58.6 51.5
18 Brunei 43.4 86.7 36.6 30.3 67.0 51.4
19 Philippines 36.4 41.4 45.6 52.5 59.4 47.1
20 Mongolia 64.6 28.5 35.7 42.5 44.9 44.0
21 Singapore 22.2 51.9 28.2 16.8 59.4 35.1
22 South Korea 22.2 39.2 30.8 30.5 36.0 30.3
23 Japan 61.1 17.6 23.4 11.4 40.0 29.9
24 Hong Kong 64.6 3.5 21.1 10.9 25.2 25.0
25 Taiwan 11.6 28.4 17.1 27.7 28.9 22.7
26 New Zealand 15.1 8.6 26.6 6.6 6.8 12.7
27 Australia 11.6 2.9 24.8 13.5 15.1 11.5
As a region that spans Afghanistan in the north-west, New Zealand in the south-east, and Mongolia in the north, there
is enormous variability in terms of vulnerability within the region. Most countries in the Asia Pacific region exhibit a
range of pre-conditions to modern slavery, including weak rule of law, corruption, high levels of poverty, and crippling
unemployment. Despite rapid economic progress throughout the region, over 800 million people live below the poverty
line,22
and one billion people work for low wages, often in difficult or dangerous conditions with few or no rights.23
Combined with a highly mobile, unskilled workforce, reliance on remittances and lack of effective migration regulation,
people in this region are some of the most vulnerable to modern slavery.24
At the other end of the spectrum, the Asia Pacific
includes countries with high levels of development, stability and with strong policies presenting fewer vulnerabilities to
modern slavery, such as Australia and New Zealand.
22	
United Nations Economic and Social Commission for Asia and the Pacific,“Economic and Social Survey of Asia andThe Pacific 2013”, (United Nations Financial and Social Commission, 2013),
accessed 18/08/14: http://www.unescap.org/publications/survey/surveys/survey2013.pdf
23	
As above, p. vi
24	
As above, p. 6, and Dovelyn Rannveig Agunias, Christine Aghazarm and Graziano Battistella, Labour Migration From Colombo Process Countries: Good Practices, Challenges andWay Forward,
(International Organisation for Migration, 2012), accessed 18/08/14: http://publications.iom.int/bookstore/free/ColomboProcessStudy_final.pdf
Regionally, North Korea presents the highest risk for people becoming enslaved.This is linked to government sanctioned
forced labour, a dramatic absence of human rights provisions, and high levels of poverty.The recent UN Report of the
Commission of Inquiry on Human Rights in the Democratic People’s Republic of Korea states that “prisoners in the
ordinary prison system are systematically subjected to deliberate starvation and illegal forced labour”.25
Similar to countries
such as Pakistan and Afghanistan, countries that experience internal conflict and governmental instability, have high levels of
vulnerability. Countries like Australia, New Zealand, Japan and Taiwan have lower indicators of vulnerability, reflecting their
strong rule of law and respect for human rights. However, as recent investigations into forced labour on fishing vessels in
New Zealand waters revealed,26
these countries are still not immune to modern slavery.
25	
Human Rights Council, Report of the Commission of Inquiry on Human Rights in the Democratic People’s Republic of Korea, (UN General Assembly, 2014), accessed 02/09/14: http://www.ohchr.
org/EN/HRBodies/HRC/CoIDPRK/Pages/ReportoftheCommissionofInquiryDPRK.aspx
26	
Christina Stringer, Glenn Simmons and Daren Coulston, “Not in New Zealand’s waters, surely? Labour and human rights abuses abroad fishing vessels”, (New Zealand Asia Institute Working Paper
Series, 2011), No. 11-01, accessed 02/09/14: http://docs.business.auckland.ac.nz/Doc/11-01-Not-in-New-Zealand-waters-surely-NZAI-Working-Paper-Sept-2011.pdf
ASIA PACIFIC (continued)
BB BBB CCC
BBBB BBB BB
BB CCC B
CCC
A
BB
BBB
BBB
BB
BB
BB
B
CCC
BB
CCC
BBB
BB
AA
BBB
B
B
B
BBBB
BBB
BB
CCC
B
BBB
FINLAND
POLAND
GERMANY
FRANCE
NORWAY
SPAIN
SWEDEN
SLOVAKIA
ESTONIA
LATVIA
LITHUANIA
HUNGARY SERBIA
ROMANIA
BULGARIA
TURKEY
GREECE MACEDONIA
CYPRUS
KOSOVO
ALBANIAMONTENEGRO
BOSNIA 
HERZEGOVINA
CROATIAITALY
SLOVENIAAUSTRIASWITZERLAND CZECH
REPUBLIC
NETHERLANDS
DENMARK
UNITED
KINGDOMIRELAND
ICELAND
BELGIUM
LUXEMBOURG
PORTUGAL
39.38.
EUROPE
Estimated Number Living in Modern Slavery 566,200
Regional Proportion of Global Estimate 1.6% of 35.8 million people in modern slavery are in Europe
Average Government Response Rating BB
Average Vulnerability Score 27.8%
Prevalence
Regional rank Country
Percent of population
in modern slavery
Estimated population
in modern slavery Population
1 Bulgaria 0.380 27,600 7,265,115
2 Czech Republic 0.360 37,900 10,521,468
3 Hungary 0.360 35,600 9,897,247
4 Serbia 0.360 25,800 7,163,976
5 Slovakia 0.360 19,500 5,414,095
6 Croatia 0.360 15,300 4,252,700
7 Bosnia and Herzegovina 0.360 13,800 3,829,307
8 Lithuania 0.360 10,600 2,956,121
9 Albania 0.360 10,000 2,773,620
10 Macedonia 0.360 7,600 2,107,158
11 Slovenia 0.360 7,400 2,060,484
12 Estonia 0.360 4,800 1,324,612
13 Cyprus 0.360 4,100 1,141,166
14 Montenegro 0.360 2,200 621,383
15 Turkey 0.248 185,500 74,932,641
16 Kosovo 0.248 4,500 1,824,000
17 Poland 0.187 71,900 38,530,725
18 Romania 0.113 22,600 19,963,581
19 Latvia 0.113 2,300 2,013,385
20 Italy 0.019 11,400 59,831,093
21 Germany 0.013 10,500 80,621,788
22 France 0.013 8,600 66,028,467
23 United Kingdom 0.013 8,300 64,097,085
24 Spain 0.013 6,100 46,647,421
25 Netherlands 0.013 2,200 16,804,224
26 Belgium 0.013 1,500 11,195,138
27 Greece 0.013 1,400 11,032,328
28 Portugal 0.013 1,400 10,459,806
29 Sweden 0.013 1,200 9,592,552
30 Austria 0.013 1,100 8,473,786
31 Switzerland 0.013 1,100 8,081,482
32 Denmark 0.013 700 5,613,706
33 Finland 0.013 700 5,439,407
34 Norway 0.013 700 5,084,190
35 Luxembourg 0.013 100 543,202
36 Ireland 0.007 300 4,595,281
37 Iceland 0.007 100 323,002
“I don’t remember good things,”
says 19 year old Elira when
asked about her childhood in
Albania. She often went hungry
because her family was so poor.
Her parents were abusive toward
her, especially her mother.
“Around age 14, my whole
life crashed.” Elira recalls.After
her parents divorced, she moved
to Kosovo with her mother in
search of a better life.“I worked
as a waitress and the other part
of the day as a dancer.
My mother and her friend
introduced me to different
men with whom I had sexual
relations. In those times, I didn’t
think the way I think today”,
Elira says.“Only now do I
understand that I was a victim
of exploitation”.
Eventually Elira returned
to Albania. She wanted to
work in Greece, but lacking
documentation, she was detained
at the border. She told the
police her story and was sent
to Albania’s national reception
centre for trafficking victims.
There, she was referred to
NGO Different and Equal,
which provided her with
counselling and skills training
that helped her find work as
a tailor.Today her life is back
on track.“Now I can handle
problems better”, Elira says.
“I’m working and I’m feeling
very good”.
Elira, a 19 year old Albanian
survivor of sexual exploitation.
Low High
Estimated Prevalence of Modern Slavery Government Response to Modern Slavery Rating
AAAAAA BBB BB B CCC CC C DDD DD D
The alphabetical depiction is a ‘rating’ of the strength of government
responses to modern slavery.The highest possible rating is an AAA, and
the lowest a D.
The colour of the countries as shown on this map designate from lowest
to highest prevalence of modern slavery.
Those in grey were not included in the Index.
United NationsVoluntary Trust Fund for
Victims of Human Trafficking, HearTheir
Story: Help Us ChangeTheir Lives, (United
Nations Office for Drugs and Crime, 2013)
p. 5, accessed 03/09/14: http://www.unodc.
org/documents/human-trafficking/Fund/
UNVTF_brochure2013.pdf
Image–KatieOrlinsky
41.40.
Despite having the lowest regional prevalence of modern slavery in the world, men, women and children continue to be
subjected to modern slavery within the European Union (EU). Recent cases include human trafficking into the cannabis
growing industry in Ireland and forced begging in France.27
Nationals from European Union member states represent 65
percent of the presumed victims of human trafficking identified within the EU, although over recent years there has been
a noted increase in non-EU victims.28
Trafficking for commercial sexual exploitation accounted for almost 70 percent of
identified victims while trafficking for forced labour accounted for 19 percent.29
Cases of debt bondage and forced labour of
nationals from Eastern Europe in Western Europe continues in the agricultural, construction and food processing sectors, as
do situations of domestic servitude of non-EU nationals in the homes of diplomatic staff.
In 2014,Turkey recorded the highest absolute numbers of modern slavery in the region, reflecting high numbers of child
marriage30
, forced labour, and trafficking for sexual exploitation.31
Bulgaria recorded the highest prevalence in 2014.The
global economic crisis and austerity measures of the EU have meant that increasing numbers of Bulgarians and Romanians
migrate in search of highly paid jobs. Some of these workers can be tricked or coerced into situations of exploitation.32
Poland also recorded high prevalence of modern slavery in 2014 due, in part, to the exploitation of cheap migrant labourers
within Poland from nearby Eastern European countries and parts of South East Asia.33
27	
“Used in Europe” accessed 18/10/14: usedineurope.com
28	
Trafficking in Human Beings, (Eurostat European Union, 2014) p. 11, accessed 19/10/14: ec.europa.eu/dgs/home-affairs/what-is-new/news/news/docs/20141017_working_paper_on_
statistics_on_trafficking_in_human_beings_en.pdf
29	
As above
30	
“Turkey: Child Marriage” (UNFPA, n.d.), accessed 17/10/14: http://www.unfpa.org/webdav/site/eeca/shared/documents/publications/Turkey%20English.pdf
31	
Country Profiles – Europe and Central Asia, (United Nations Office on Drugs and Crime, 2013), p.125, accessed 04/04/14: https://www.unodc.org/documents/data-and-analysis/glotip/
Country_Profiles_Europe_Central_Asia.pdf.
32	
José Mendes Bota, Prostitution, trafficking and modern slavery in Europe, (Council of Europe Parliamentary Assembly, Committee on Equality and Non-Discrimination March 20, 2014), p. 8 ,
accessed 08/09/14: http://www.assembly.coe.int/nw/xml/XRef/X2H-Xref-ViewPDF.asp?FileID=20559lang=en
33	
Office to Monitor and Combat Trafficking in Persons, Trafficking in Persons Report: Poland Country Narrative (United States Department of State, 2014), p. 317, accessed 25/10/14: http://
www.state.gov/documents/organization/226848.pdf; field sources, 2014. See also, Zbigniew Lasocik  Lukasz Wieczorek,“Trafficking for Forced Labour in Poland – Research Report” in
Trafficking for Forced Labour and Labour Exploitation (FLEX) – towards increased knowledge, cooperation and exchange of information in Estonia, Finland and Poland, Anniina Jokinen, Natalia Ollus and
Kauko Aromaa (eds.) (Warsaw: Heuni, 2011). accessed 06/03/14: http://www.heuni.fi/material/attachments/heuni/reports/6KmRLQd2d/HEUNl_report_68_netti.pdf
Government Response
Regional rank Country
Survivors are
supported Criminal justice
Coordination
and
accountability
Attitudes, social
systems and
institutions
Business and
government Rating
1 Netherlands 88.9 95.2 91.7 87.5 0 AA
2 Sweden 77.8 88.1 66.7 87.5 0 A
3 Switzerland 72.2 81 75 68.8 0 BBB
4 Ireland 66.7 81 75 75 0 BBB
5 Norway 66.7 81 75 68.8 0 BBB
6 United Kingdom 77.8 81 66.7 81.3 0 BBB
7 Belgium 55.6 88.1 58.3 75 0 BBB
8 Austria 72.2 81 58.3 68.8 0 BBB
9 Croatia 66.7 73.8 75 75 0 BBB
10 Spain 72.2 73.8 58.3 68.8 0 BBB
11 Montenegro 83.3 81 66.7 43.8 0 BB
12 Hungary 55.6 73.8 66.7 68.8 0 BB
13 Slovakia 66.7 66.7 66.7 62.5 0 BB
14 Macedonia 72.2 59.5 83.3 50 0 BB
15 Denmark 66.7 66.7 58.3 62.5 0 BB
16 Poland 61.1 73.8 75 50 0 BB
17 Portugal 66.7 66.7 75 50 0 BB
18 Serbia 66.7 81 50 56.3 0 BB
19 Germany 61.1 66.7 58.3 56.3 0 BB
20 France 50 81 50 68.8 0 BB
21 Latvia 61.1 81 58.3 50 0 BB
22 Slovenia 61.1 73.8 58.3 43.8 0 BB
23 Italy 66.7 71.4 41.7 50 0 BB
24 Finland 61.1 59.5 66.7 56.3 0 B
25 Czech Republic 44.4 73.8 58.3 62.5 0 B
26 Romania 50 66.7 50 75 0 B
27 Cyprus 61.1 76.2 58.3 37.5 0 B
28 Lithuania 50 61.9 58.3 50 0 B
29 Iceland 44.4 54.8 66.7 50 0 B
30 Bulgaria 50 59.5 58.3 50 0 B
31 Greece 55.6 54.8 50 50 0 B
32 Estonia 55.6 45.2 50 43.8 0 CCC
33 Luxembourg 50 73.8 33.3 31.3 0 CCC
34 Albania 61.1 52.4 41.7 37.5 0 CCC
35 Bosnia and Herzegovina 50 59.5 41.7 31.3 0 CCC
36 Turkey 38.9 52.4 41.7 31.3 0 CCC
37 Kosovo 38.9 61.9 50 18.8 0 CCC
EUROPE (continued)
43.42.
Globally, Europe was the strongest performing region in terms of how well the governments are tackling modern slavery.
In large part, this reflects the strength of regional efforts through the European Union and Council of Europe mechanisms
to implement commitments under a regional treaty – the Council of Europe Convention on Action against Trafficking in
Human Beings. 42 European countries have ratified or acceded to the Convention,34
which aims to prevent trafficking,
protect the human rights of victims of trafficking, and prosecute traffickers.35
The Convention established the Council of
Europe’s Group of Experts on Action against Trafficking in Human Beings (GRETA) monitoring and reporting mechanism,
which is responsible for holding governments in the region accountable to their commitments under the Convention.36
All countries in Europe criminalise modern slavery, either as distinct offenses in their criminal codes, or through standalone
trafficking legislation.All countries have also established some form of legal framework to allow victims to access justice;
the Netherlands, Ireland, and Norway, for example, have legal services for victims, witness protection systems, and some
recognition that child victims require specialized services. Despite this, there remains a real risk in many countries that
victims may be criminalised for actions committed while under the control of criminals, or detained on immigration
offences. In Norway, for example, there have been reports of victims being held in detention due to their irregular
immigration status;37
in France, child victims have been arrested for soliciting and theft38
; and in the UK, support
organisations who identify non-EU victims of modern slavery reportedly do not refer them to the National Referral
Mechanism, for fear they would be removed from the UK.39
The Netherlands and Sweden lead the government response globally and in Europe, demonstrating the highest outcomes in
measurements on criminal justice and addressing vulnerability to modern slavery. Both countries have undertaken research on
modern slavery, have extensive public information campaigns, and have comprehensive protections in place for domestic40
and
migrant workers.41
Austria has seriously focused on the protection of domestic workers of diplomats and staff of international
organisations in recent years.Additional measures were introduced in 2012 to ensure all domestic workers have their own
bank account and they are required to present annually to the Austrian Ministry for European and International Affairs for a
welfare check.42
When economic capacity is taken into account, Montenegro and Macedonia are performing relatively well on government
responses. Montenegro, for example, has victim assistance programmes available for all victims of modern slavery, including
men, women and children.At the other end of the scale, despite having strong economies, the Governments of Iceland and
Luxembourg are doing very little to address modern slavery.
Ensuring that business and governments through their public procurement stop sourcing goods and services that use modern
slavery remains insufficient across many countries and still represents the greatest gap in government responses to modern
slavery across Europe.
34	
Belarus is the only non-member state to accede to the Convention. Estonia and Turkey have signed but not yet ratified the Convention. See current signatures and ratification of the
Convention at the Council of Europe website: http://www.coe.int/t/dghl/monitoring/trafficking/Flags-sos_en.asp
35	
Council of Europe Convention and its Explanatory Report, (Warsaw, 16.V.2005)”, Council of Europe, accessed 18/09/14: http://www.coe.int/t/dghl/monitoring/trafficking/Docs/Convntn/
CETS197_en.asp#TopOfPage
36	
“GRETA”, Council of Europe, accessed 18/09/14: http://www.coe.int/t/dghl/monitoring/trafficking/Docs/Monitoring/GRETA_en.asp
37	
Group of Experts on Action against Trafficking in Human Beings, Report concerning the implementation of the Council of Europe Convention on Action againstTrafficking in Human Beings by
Norway,(2013), p. 51: accessed on 06/04/2014, http://www.coe.int/t/dghl/monitoring/trafficking/docs/Reports/GRETA_2013_5_FGR_NOR_with_cmnts_en.pdf
38	
Office to Monitor and Combat Trafficking in Persons,Trafficking in Persons Report: France Country Narrative, (United States Department of State, 2014), p. 179, accessed 30/07/14: http://www.
state.gov/documents/organization/226845.pdf.
39	
The UK is currently undergoing an evaluation of the National Referral Mechanism. See – Group of Experts on Action against Trafficking in Human Beings, Report concerning the
implementation of the Council of Europe Convention on Action againstTrafficking in Human Beings by the United Kingdom: First evaluation round, (Strasbourg, 2012) p. 7, accessed 3/08/14: http://www.
coe.int/t/dghl/monitoring/trafficking/docs/Reports/GRETA_2012_6_FGR_GBR_en.pdf
40	
Group of Experts on Action against Trafficking in Human Beings, Report concerning the implementation of the Council of Europe Convention on Action againstTrafficking in Human Beings byThe
Netherlands, (Council of Europe, 2014), p. 39 accessed: 31/07/2014, http://www.coe.int/t/dghl/monitoring/trafficking/Docs/Reports/GRETA_2014_10_FGR_NLD_w_cmnts_en.pdf
41	
Group of Experts on Action against Trafficking in Human Beings, Report concerning the implementation of the Council of Europe Convention on Action againstTrafficking in Human Beings by Sweden,
(Council of Europe, 2014): p. 32, accessed on 06/18/2014, http://www.coe.int/t/dghl/monitoring/trafficking/docs/Reports/GRETA_2014_11_FGR_SWE_en.pdf
42	
“Austria:Together Against Trafficking in Human Beings”, European Commission, last modified 05/05/14: http://ec.europa.eu/anti-trafficking/NIP/Austria
Vulnerability (A higher score indicates higher vulnerability)
Regional rank Country Slavery Policy Human Rights Development State Stability Discrimination Mean
1 Turkey 50.5 63.7 39.6 44.2 62.9 50.9
2 Albania 47.0 43.6 36.0 57.0 55.3 46.3
3 Bosnia and Herzegovina 29.3 57.2 34.9 46.4 53.8 45.7
4 Greece 36.4 49.8 30.2 43.3 50.9 41.4
5 Kosovo 22.2 45.0 36.3 48.4 56.3 40.9
6 Montenegro 36.4 38.8 30.3 49.5 49.0 40.8
7 Macedonia 25.8 41.7 33.7 54.9 46.0 39.7
8 Romania 25.8 50.1 34.8 42.8 40.6 38.1
9 Latvia 43.4 34.8 30.0 38.8 45.1 37.7
10 Serbia 25.8 45.4 34.1 43.2 40.2 37.0
11 Bulgaria 22.2 42.4 30.9 47.9 34.1 35.5
12 Hungary 54.0 30.8 33.8 22.1 32.4 35.3
13 Lithuania 47.0 36.4 24.5 27.1 44.3 35.2
14 Croatia 43.4 33.8 30.8 30.3 37.0 33.7
15 Estonia 50.5 13.2 28.1 24.6 43.5 30.6
16 Cyprus 25.8 27.7 29.0 20.7 46.0 29.8
17 Italy 32.8 21.9 24.0 38.1 31.3 29.6
18 Slovakia 11.6 28.5 31.2 39.3 33.4 28.8
19 Poland 1.0 21.7 27.1 22.2 48.2 25.5
20 Czech Republic 8.1 27.9 28.7 17.7 37.6 24.0
21 France 25.8 25.8 28.0 21.0 23.9 22.8
22 Spain 15.1 27.9 22.8 22.6 17.6 22.7
23 Switzerland 32.8 23.3 21.1 10.6 25.5 22.0
24 Portugal 18.7 13.0 28.2 17.0 29.7 21.4
25 Ireland 18.7 18.1 27.1 16.7 19.5 20.7
26 Slovenia 4.5 15.1 29.6 16.1 34.8 20.7
27 Iceland 54.0 19.0 22.4 12.1 3.0 20.0
28 Denmark 43.4 16.8 25.2 3.5 6.2 18.4
29 Germany 11.6 24.7 25.1 14.4 12.2 17.6
30 Luxembourg 32.8 2.4 10.9 9.9 21.6 17.0
31 Belgium 4.5 18.1 26.8 14.9 15.9 16.0
32 Finland 4.5 22.2 26.2 8.9 14.4 16.0
33 United Kingdom 8.1 10.3 17.1 18.4 17.6 15.1
34 Austria 4.5 17.3 23.9 14.4 14.4 14.9
35 Sweden 8.1 15.7 26.5 10.1 10.9 13.5
36 Netherlands 11.6 9.2 25.1 13.5 8.4 11.4
37 Norway 11.6 16.0 25.6 7.8 2.5 11.3
With regard to vulnerability to modern slavery, European countries consistently rank high on indices of peace, democracy,
anti-corruption, human rights and access to social services.Turkey,Albania, Bosnia and Herzegovina, Greece, and Kosovo
collectively represent the five most vulnerable countries in the region due in part to high discrimination measures, poor state
stability, and weaker human rights safeguards.Turkey has recorded the highest vulnerability ratings for modern slavery. High
levels of irregular migration, proximity to conflict zones in Syria and Iraq and discrimination against minority groups impact
vulnerability within Turkey. Higher levels of unemployment across Europe over the past five years increase the vulnerability
of those seeking work abroad.As a destination for migrants and refugees from conflicts in neighbouring regions, particularly
the Middle East and North Africa, European countries face the problems associated with heightened risks to trafficking and
labour exploitation among these populations.
EUROPE (continued)
Walk Free Foundation: Global Slavery Index 2014

More Related Content

What's hot

Inequality matters: BRICS inequalities fact sheet
Inequality matters: BRICS inequalities fact sheetInequality matters: BRICS inequalities fact sheet
Inequality matters: BRICS inequalities fact sheetOxfam Brasil
 
Socioeconomic Inequality in Brazil and South Africa
Socioeconomic Inequality in Brazil and South AfricaSocioeconomic Inequality in Brazil and South Africa
Socioeconomic Inequality in Brazil and South AfricaAshS1
 
IRD_Afghan_CaseStudy_29Apr14
IRD_Afghan_CaseStudy_29Apr14IRD_Afghan_CaseStudy_29Apr14
IRD_Afghan_CaseStudy_29Apr14John Engels
 
Education in the American South: Historical Context, Current State, and Futur...
Education in the American South: Historical Context, Current State, and Futur...Education in the American South: Historical Context, Current State, and Futur...
Education in the American South: Historical Context, Current State, and Futur...Jeremy Knight
 
Poverty alleviation and the pdp laban v3
Poverty alleviation and the pdp laban v3Poverty alleviation and the pdp laban v3
Poverty alleviation and the pdp laban v3ipe
 
The High Cost of Gender Inequality in Earnings
The High Cost of Gender Inequality in EarningsThe High Cost of Gender Inequality in Earnings
The High Cost of Gender Inequality in EarningsEmisor Digital
 
Poverty as a_factor_in_human_trafficking_in_rwanda
Poverty as a_factor_in_human_trafficking_in_rwandaPoverty as a_factor_in_human_trafficking_in_rwanda
Poverty as a_factor_in_human_trafficking_in_rwandaJohnGacinya
 
The problems of third world & un
The problems of third world & unThe problems of third world & un
The problems of third world & unsabeenHashmiQureshi
 
Wide Open Spaces: Schooling in Rural America Today
Wide Open Spaces: Schooling in Rural America TodayWide Open Spaces: Schooling in Rural America Today
Wide Open Spaces: Schooling in Rural America TodayJeremy Knight
 
The role of the youth in alleviating poverty
The role of the youth in alleviating povertyThe role of the youth in alleviating poverty
The role of the youth in alleviating povertyAko JB
 
FT_5 Aug 2003_Bill O'RahGoodbye, yellow brick road_p17
FT_5 Aug 2003_Bill O'RahGoodbye, yellow brick road_p17FT_5 Aug 2003_Bill O'RahGoodbye, yellow brick road_p17
FT_5 Aug 2003_Bill O'RahGoodbye, yellow brick road_p17Bill O'Rahilly
 
Introduction to international development myungnam kim final
Introduction to international development myungnam kim finalIntroduction to international development myungnam kim final
Introduction to international development myungnam kim finalKBS
 
Building a Notion of Equality: Thoughts on Women, Work and Welfare
 Building a Notion of Equality: Thoughts on Women, Work and Welfare Building a Notion of Equality: Thoughts on Women, Work and Welfare
Building a Notion of Equality: Thoughts on Women, Work and WelfareEconomic Research Forum
 
Donor-Mapping-Report-for-web-FINAL-30March16-1
Donor-Mapping-Report-for-web-FINAL-30March16-1Donor-Mapping-Report-for-web-FINAL-30March16-1
Donor-Mapping-Report-for-web-FINAL-30March16-1Brigitte Suhr
 
A1.1: Syed Jaffer Ali: Poverty, Children and Rural-Urban Inequalities in Pak...
A1.1: Syed Jaffer Ali: Poverty, Children and Rural-Urban  Inequalities in Pak...A1.1: Syed Jaffer Ali: Poverty, Children and Rural-Urban  Inequalities in Pak...
A1.1: Syed Jaffer Ali: Poverty, Children and Rural-Urban Inequalities in Pak...Debbie_at_IDS
 

What's hot (19)

Inequality matters: BRICS inequalities fact sheet
Inequality matters: BRICS inequalities fact sheetInequality matters: BRICS inequalities fact sheet
Inequality matters: BRICS inequalities fact sheet
 
Bridging gender-gap
Bridging gender-gapBridging gender-gap
Bridging gender-gap
 
Turkey for UN SC Permanent Membership
Turkey for UN SC Permanent MembershipTurkey for UN SC Permanent Membership
Turkey for UN SC Permanent Membership
 
Socioeconomic Inequality in Brazil and South Africa
Socioeconomic Inequality in Brazil and South AfricaSocioeconomic Inequality in Brazil and South Africa
Socioeconomic Inequality in Brazil and South Africa
 
IRD_Afghan_CaseStudy_29Apr14
IRD_Afghan_CaseStudy_29Apr14IRD_Afghan_CaseStudy_29Apr14
IRD_Afghan_CaseStudy_29Apr14
 
Education in the American South: Historical Context, Current State, and Futur...
Education in the American South: Historical Context, Current State, and Futur...Education in the American South: Historical Context, Current State, and Futur...
Education in the American South: Historical Context, Current State, and Futur...
 
Poverty alleviation and the pdp laban v3
Poverty alleviation and the pdp laban v3Poverty alleviation and the pdp laban v3
Poverty alleviation and the pdp laban v3
 
The High Cost of Gender Inequality in Earnings
The High Cost of Gender Inequality in EarningsThe High Cost of Gender Inequality in Earnings
The High Cost of Gender Inequality in Earnings
 
Poverty as a_factor_in_human_trafficking_in_rwanda
Poverty as a_factor_in_human_trafficking_in_rwandaPoverty as a_factor_in_human_trafficking_in_rwanda
Poverty as a_factor_in_human_trafficking_in_rwanda
 
The problems of third world & un
The problems of third world & unThe problems of third world & un
The problems of third world & un
 
Wide Open Spaces: Schooling in Rural America Today
Wide Open Spaces: Schooling in Rural America TodayWide Open Spaces: Schooling in Rural America Today
Wide Open Spaces: Schooling in Rural America Today
 
The role of the youth in alleviating poverty
The role of the youth in alleviating povertyThe role of the youth in alleviating poverty
The role of the youth in alleviating poverty
 
FT_5 Aug 2003_Bill O'RahGoodbye, yellow brick road_p17
FT_5 Aug 2003_Bill O'RahGoodbye, yellow brick road_p17FT_5 Aug 2003_Bill O'RahGoodbye, yellow brick road_p17
FT_5 Aug 2003_Bill O'RahGoodbye, yellow brick road_p17
 
Introduction to international development myungnam kim final
Introduction to international development myungnam kim finalIntroduction to international development myungnam kim final
Introduction to international development myungnam kim final
 
Building a Notion of Equality: Thoughts on Women, Work and Welfare
 Building a Notion of Equality: Thoughts on Women, Work and Welfare Building a Notion of Equality: Thoughts on Women, Work and Welfare
Building a Notion of Equality: Thoughts on Women, Work and Welfare
 
Thesis
ThesisThesis
Thesis
 
Donor-Mapping-Report-for-web-FINAL-30March16-1
Donor-Mapping-Report-for-web-FINAL-30March16-1Donor-Mapping-Report-for-web-FINAL-30March16-1
Donor-Mapping-Report-for-web-FINAL-30March16-1
 
N1358774
N1358774N1358774
N1358774
 
A1.1: Syed Jaffer Ali: Poverty, Children and Rural-Urban Inequalities in Pak...
A1.1: Syed Jaffer Ali: Poverty, Children and Rural-Urban  Inequalities in Pak...A1.1: Syed Jaffer Ali: Poverty, Children and Rural-Urban  Inequalities in Pak...
A1.1: Syed Jaffer Ali: Poverty, Children and Rural-Urban Inequalities in Pak...
 

Similar to Walk Free Foundation: Global Slavery Index 2014

Global Slavery Index 2013 | Walk Free Foundation
Global Slavery Index 2013 | Walk Free Foundation Global Slavery Index 2013 | Walk Free Foundation
Global Slavery Index 2013 | Walk Free Foundation IMPOWR
 
Global Slavery Index 2013
Global Slavery Index 2013Global Slavery Index 2013
Global Slavery Index 2013Andy Dabydeen
 
Power point for Non-Profit Organization: Models for Unity
Power point for Non-Profit Organization: Models for UnityPower point for Non-Profit Organization: Models for Unity
Power point for Non-Profit Organization: Models for UnityDestinedpolitics
 
Power point for NGO
Power point for NGOPower point for NGO
Power point for NGOTeresa Lopez
 
DefenseAndDiplomacy10Ideas
DefenseAndDiplomacy10IdeasDefenseAndDiplomacy10Ideas
DefenseAndDiplomacy10IdeasKieran Doyle
 
HAITI CLASSEE EN DEUXIEME PLACE SUR 162 COMME PAYS OU EXISTE L'ESCLAVAGE
HAITI CLASSEE EN DEUXIEME PLACE SUR 162 COMME PAYS OU EXISTE L'ESCLAVAGEHAITI CLASSEE EN DEUXIEME PLACE SUR 162 COMME PAYS OU EXISTE L'ESCLAVAGE
HAITI CLASSEE EN DEUXIEME PLACE SUR 162 COMME PAYS OU EXISTE L'ESCLAVAGEStanleylucas
 
SUSTAINABLE DEVELOPMENT GOAL.pptx
SUSTAINABLE DEVELOPMENT GOAL.pptxSUSTAINABLE DEVELOPMENT GOAL.pptx
SUSTAINABLE DEVELOPMENT GOAL.pptxVinayak247538
 
Interview Questions on Anti-Trafficking Day
Interview Questions on Anti-Trafficking DayInterview Questions on Anti-Trafficking Day
Interview Questions on Anti-Trafficking DayDifference Makers
 
Prepared By (name)As a researcher, explain why we study i.docx
Prepared By (name)As a researcher, explain why we study i.docxPrepared By (name)As a researcher, explain why we study i.docx
Prepared By (name)As a researcher, explain why we study i.docxharrisonhoward80223
 
The Invisible Victims of Crime (Nova's Final Report)
The Invisible Victims of Crime (Nova's Final Report)The Invisible Victims of Crime (Nova's Final Report)
The Invisible Victims of Crime (Nova's Final Report)Pablo Gonzalez
 
A systematic approach to strengthen the inclusion of the rights of all women ...
A systematic approach to strengthen the inclusion of the rights of all women ...A systematic approach to strengthen the inclusion of the rights of all women ...
A systematic approach to strengthen the inclusion of the rights of all women ...Anumita Sarkar
 
Bakar Fakih and Mwifadhi Mrisho (2016). Hear my voice: old age and disability...
Bakar Fakih and Mwifadhi Mrisho (2016). Hear my voice: old age and disability...Bakar Fakih and Mwifadhi Mrisho (2016). Hear my voice: old age and disability...
Bakar Fakih and Mwifadhi Mrisho (2016). Hear my voice: old age and disability...Sightsavers
 
Group 3 - Human Trafficking
Group 3 - Human TraffickingGroup 3 - Human Trafficking
Group 3 - Human TraffickingApoorva Reddy
 
Engaging with persons with disabilities and older people to prevent sexual an...
Engaging with persons with disabilities and older people to prevent sexual an...Engaging with persons with disabilities and older people to prevent sexual an...
Engaging with persons with disabilities and older people to prevent sexual an...Gry Tina Tinde
 
17168 (group no. 18) toc final draft
17168 (group no. 18)   toc final draft 17168 (group no. 18)   toc final draft
17168 (group no. 18) toc final draft pdf uploader
 
2019 Ambassador Leaders Community Action Plan - Stop Taking Our People
2019 Ambassador Leaders Community Action Plan - Stop Taking Our People2019 Ambassador Leaders Community Action Plan - Stop Taking Our People
2019 Ambassador Leaders Community Action Plan - Stop Taking Our PeopleAmbassador Leaders
 
UCSP ( JEFFREY GAD REPORTING).pptx
UCSP ( JEFFREY GAD REPORTING).pptxUCSP ( JEFFREY GAD REPORTING).pptx
UCSP ( JEFFREY GAD REPORTING).pptxJacobLabrador
 
All Things Being Equal, perspectives on disability in development
All Things Being Equal, perspectives on disability in developmentAll Things Being Equal, perspectives on disability in development
All Things Being Equal, perspectives on disability in developmentJonathan Flower
 

Similar to Walk Free Foundation: Global Slavery Index 2014 (20)

Global Slavery Index 2013 | Walk Free Foundation
Global Slavery Index 2013 | Walk Free Foundation Global Slavery Index 2013 | Walk Free Foundation
Global Slavery Index 2013 | Walk Free Foundation
 
Global Slavery Index 2013
Global Slavery Index 2013Global Slavery Index 2013
Global Slavery Index 2013
 
Power point for ngo
Power point for ngoPower point for ngo
Power point for ngo
 
Power point for Non-Profit Organization: Models for Unity
Power point for Non-Profit Organization: Models for UnityPower point for Non-Profit Organization: Models for Unity
Power point for Non-Profit Organization: Models for Unity
 
Power point for NGO
Power point for NGOPower point for NGO
Power point for NGO
 
DefenseAndDiplomacy10Ideas
DefenseAndDiplomacy10IdeasDefenseAndDiplomacy10Ideas
DefenseAndDiplomacy10Ideas
 
HAITI CLASSEE EN DEUXIEME PLACE SUR 162 COMME PAYS OU EXISTE L'ESCLAVAGE
HAITI CLASSEE EN DEUXIEME PLACE SUR 162 COMME PAYS OU EXISTE L'ESCLAVAGEHAITI CLASSEE EN DEUXIEME PLACE SUR 162 COMME PAYS OU EXISTE L'ESCLAVAGE
HAITI CLASSEE EN DEUXIEME PLACE SUR 162 COMME PAYS OU EXISTE L'ESCLAVAGE
 
SUSTAINABLE DEVELOPMENT GOAL.pptx
SUSTAINABLE DEVELOPMENT GOAL.pptxSUSTAINABLE DEVELOPMENT GOAL.pptx
SUSTAINABLE DEVELOPMENT GOAL.pptx
 
Interview Questions on Anti-Trafficking Day
Interview Questions on Anti-Trafficking DayInterview Questions on Anti-Trafficking Day
Interview Questions on Anti-Trafficking Day
 
Prepared By (name)As a researcher, explain why we study i.docx
Prepared By (name)As a researcher, explain why we study i.docxPrepared By (name)As a researcher, explain why we study i.docx
Prepared By (name)As a researcher, explain why we study i.docx
 
The Invisible Victims of Crime (Nova's Final Report)
The Invisible Victims of Crime (Nova's Final Report)The Invisible Victims of Crime (Nova's Final Report)
The Invisible Victims of Crime (Nova's Final Report)
 
A systematic approach to strengthen the inclusion of the rights of all women ...
A systematic approach to strengthen the inclusion of the rights of all women ...A systematic approach to strengthen the inclusion of the rights of all women ...
A systematic approach to strengthen the inclusion of the rights of all women ...
 
LivingFreeAndEqual
LivingFreeAndEqualLivingFreeAndEqual
LivingFreeAndEqual
 
Bakar Fakih and Mwifadhi Mrisho (2016). Hear my voice: old age and disability...
Bakar Fakih and Mwifadhi Mrisho (2016). Hear my voice: old age and disability...Bakar Fakih and Mwifadhi Mrisho (2016). Hear my voice: old age and disability...
Bakar Fakih and Mwifadhi Mrisho (2016). Hear my voice: old age and disability...
 
Group 3 - Human Trafficking
Group 3 - Human TraffickingGroup 3 - Human Trafficking
Group 3 - Human Trafficking
 
Engaging with persons with disabilities and older people to prevent sexual an...
Engaging with persons with disabilities and older people to prevent sexual an...Engaging with persons with disabilities and older people to prevent sexual an...
Engaging with persons with disabilities and older people to prevent sexual an...
 
17168 (group no. 18) toc final draft
17168 (group no. 18)   toc final draft 17168 (group no. 18)   toc final draft
17168 (group no. 18) toc final draft
 
2019 Ambassador Leaders Community Action Plan - Stop Taking Our People
2019 Ambassador Leaders Community Action Plan - Stop Taking Our People2019 Ambassador Leaders Community Action Plan - Stop Taking Our People
2019 Ambassador Leaders Community Action Plan - Stop Taking Our People
 
UCSP ( JEFFREY GAD REPORTING).pptx
UCSP ( JEFFREY GAD REPORTING).pptxUCSP ( JEFFREY GAD REPORTING).pptx
UCSP ( JEFFREY GAD REPORTING).pptx
 
All Things Being Equal, perspectives on disability in development
All Things Being Equal, perspectives on disability in developmentAll Things Being Equal, perspectives on disability in development
All Things Being Equal, perspectives on disability in development
 

More from ABA IHRC

Growing Up on Death Row: The Death Penalty and Juvenile Offenders in Iran
Growing Up on Death Row: The Death Penalty and Juvenile Offenders in Iran Growing Up on Death Row: The Death Penalty and Juvenile Offenders in Iran
Growing Up on Death Row: The Death Penalty and Juvenile Offenders in Iran ABA IHRC
 
OWAAT Cyprus Launches World's First Greek International Human Rights Self-Hel...
OWAAT Cyprus Launches World's First Greek International Human Rights Self-Hel...OWAAT Cyprus Launches World's First Greek International Human Rights Self-Hel...
OWAAT Cyprus Launches World's First Greek International Human Rights Self-Hel...ABA IHRC
 
The Global Gender Gap Report 2015
The Global Gender Gap Report 2015The Global Gender Gap Report 2015
The Global Gender Gap Report 2015ABA IHRC
 
Scholastic Action Magazine: Witness to War (Syria)
Scholastic Action Magazine: Witness to War (Syria) Scholastic Action Magazine: Witness to War (Syria)
Scholastic Action Magazine: Witness to War (Syria) ABA IHRC
 
2015 Year-in-Review Guidelines for Contributing Authors
2015 Year-in-Review Guidelines for Contributing Authors 2015 Year-in-Review Guidelines for Contributing Authors
2015 Year-in-Review Guidelines for Contributing Authors ABA IHRC
 
CHINA: NO END IN SIGHT
CHINA: NO END IN SIGHTCHINA: NO END IN SIGHT
CHINA: NO END IN SIGHTABA IHRC
 
ABA Section of International Law Fall Conference 2015 (Montréal, Canada)
ABA Section of International Law Fall Conference 2015 (Montréal, Canada)ABA Section of International Law Fall Conference 2015 (Montréal, Canada)
ABA Section of International Law Fall Conference 2015 (Montréal, Canada)ABA IHRC
 
Presumption of Guilt: The Global Overuse of Pretrial Detention
Presumption of Guilt: The Global Overuse of Pretrial Detention Presumption of Guilt: The Global Overuse of Pretrial Detention
Presumption of Guilt: The Global Overuse of Pretrial Detention ABA IHRC
 
Plight & Prospects: The Landscape for Cause Lawyers in China
Plight & Prospects: The Landscape for Cause Lawyers in China Plight & Prospects: The Landscape for Cause Lawyers in China
Plight & Prospects: The Landscape for Cause Lawyers in China ABA IHRC
 
Clearing the Slate: Seeking Effective Remedies for Criminalized Trafficking V...
Clearing the Slate: Seeking Effective Remedies for Criminalized Trafficking V...Clearing the Slate: Seeking Effective Remedies for Criminalized Trafficking V...
Clearing the Slate: Seeking Effective Remedies for Criminalized Trafficking V...ABA IHRC
 
ABA Section of International Law Fall 2014 Meeting (Buenos Aires, Argentina)
ABA Section of International Law Fall 2014 Meeting (Buenos Aires, Argentina)ABA Section of International Law Fall 2014 Meeting (Buenos Aires, Argentina)
ABA Section of International Law Fall 2014 Meeting (Buenos Aires, Argentina)ABA IHRC
 
Children in Danger: Act to End Violence Against Children
Children in Danger: Act to End Violence Against Children Children in Danger: Act to End Violence Against Children
Children in Danger: Act to End Violence Against Children ABA IHRC
 
2014 UNDP ILRC Annual Report
2014 UNDP ILRC Annual Report 2014 UNDP ILRC Annual Report
2014 UNDP ILRC Annual Report ABA IHRC
 
EXTRAJUDICIAL, ARBITRARY, AND SUMMARY EXECUTIONS IN NIGERIA
EXTRAJUDICIAL, ARBITRARY, AND SUMMARY EXECUTIONS IN NIGERIAEXTRAJUDICIAL, ARBITRARY, AND SUMMARY EXECUTIONS IN NIGERIA
EXTRAJUDICIAL, ARBITRARY, AND SUMMARY EXECUTIONS IN NIGERIAABA IHRC
 
CEDAW - One Pager
CEDAW - One Pager CEDAW - One Pager
CEDAW - One Pager ABA IHRC
 
ASIA LAW NEWS - OCTOBER 2012
ASIA LAW NEWS - OCTOBER 2012ASIA LAW NEWS - OCTOBER 2012
ASIA LAW NEWS - OCTOBER 2012ABA IHRC
 

More from ABA IHRC (16)

Growing Up on Death Row: The Death Penalty and Juvenile Offenders in Iran
Growing Up on Death Row: The Death Penalty and Juvenile Offenders in Iran Growing Up on Death Row: The Death Penalty and Juvenile Offenders in Iran
Growing Up on Death Row: The Death Penalty and Juvenile Offenders in Iran
 
OWAAT Cyprus Launches World's First Greek International Human Rights Self-Hel...
OWAAT Cyprus Launches World's First Greek International Human Rights Self-Hel...OWAAT Cyprus Launches World's First Greek International Human Rights Self-Hel...
OWAAT Cyprus Launches World's First Greek International Human Rights Self-Hel...
 
The Global Gender Gap Report 2015
The Global Gender Gap Report 2015The Global Gender Gap Report 2015
The Global Gender Gap Report 2015
 
Scholastic Action Magazine: Witness to War (Syria)
Scholastic Action Magazine: Witness to War (Syria) Scholastic Action Magazine: Witness to War (Syria)
Scholastic Action Magazine: Witness to War (Syria)
 
2015 Year-in-Review Guidelines for Contributing Authors
2015 Year-in-Review Guidelines for Contributing Authors 2015 Year-in-Review Guidelines for Contributing Authors
2015 Year-in-Review Guidelines for Contributing Authors
 
CHINA: NO END IN SIGHT
CHINA: NO END IN SIGHTCHINA: NO END IN SIGHT
CHINA: NO END IN SIGHT
 
ABA Section of International Law Fall Conference 2015 (Montréal, Canada)
ABA Section of International Law Fall Conference 2015 (Montréal, Canada)ABA Section of International Law Fall Conference 2015 (Montréal, Canada)
ABA Section of International Law Fall Conference 2015 (Montréal, Canada)
 
Presumption of Guilt: The Global Overuse of Pretrial Detention
Presumption of Guilt: The Global Overuse of Pretrial Detention Presumption of Guilt: The Global Overuse of Pretrial Detention
Presumption of Guilt: The Global Overuse of Pretrial Detention
 
Plight & Prospects: The Landscape for Cause Lawyers in China
Plight & Prospects: The Landscape for Cause Lawyers in China Plight & Prospects: The Landscape for Cause Lawyers in China
Plight & Prospects: The Landscape for Cause Lawyers in China
 
Clearing the Slate: Seeking Effective Remedies for Criminalized Trafficking V...
Clearing the Slate: Seeking Effective Remedies for Criminalized Trafficking V...Clearing the Slate: Seeking Effective Remedies for Criminalized Trafficking V...
Clearing the Slate: Seeking Effective Remedies for Criminalized Trafficking V...
 
ABA Section of International Law Fall 2014 Meeting (Buenos Aires, Argentina)
ABA Section of International Law Fall 2014 Meeting (Buenos Aires, Argentina)ABA Section of International Law Fall 2014 Meeting (Buenos Aires, Argentina)
ABA Section of International Law Fall 2014 Meeting (Buenos Aires, Argentina)
 
Children in Danger: Act to End Violence Against Children
Children in Danger: Act to End Violence Against Children Children in Danger: Act to End Violence Against Children
Children in Danger: Act to End Violence Against Children
 
2014 UNDP ILRC Annual Report
2014 UNDP ILRC Annual Report 2014 UNDP ILRC Annual Report
2014 UNDP ILRC Annual Report
 
EXTRAJUDICIAL, ARBITRARY, AND SUMMARY EXECUTIONS IN NIGERIA
EXTRAJUDICIAL, ARBITRARY, AND SUMMARY EXECUTIONS IN NIGERIAEXTRAJUDICIAL, ARBITRARY, AND SUMMARY EXECUTIONS IN NIGERIA
EXTRAJUDICIAL, ARBITRARY, AND SUMMARY EXECUTIONS IN NIGERIA
 
CEDAW - One Pager
CEDAW - One Pager CEDAW - One Pager
CEDAW - One Pager
 
ASIA LAW NEWS - OCTOBER 2012
ASIA LAW NEWS - OCTOBER 2012ASIA LAW NEWS - OCTOBER 2012
ASIA LAW NEWS - OCTOBER 2012
 

Recently uploaded

Congestive Cardiac Failure..presentation
Congestive Cardiac Failure..presentationCongestive Cardiac Failure..presentation
Congestive Cardiac Failure..presentationdeepaannamalai16
 
ICS2208 Lecture6 Notes for SL spaces.pdf
ICS2208 Lecture6 Notes for SL spaces.pdfICS2208 Lecture6 Notes for SL spaces.pdf
ICS2208 Lecture6 Notes for SL spaces.pdfVanessa Camilleri
 
Concurrency Control in Database Management system
Concurrency Control in Database Management systemConcurrency Control in Database Management system
Concurrency Control in Database Management systemChristalin Nelson
 
Reading and Writing Skills 11 quarter 4 melc 1
Reading and Writing Skills 11 quarter 4 melc 1Reading and Writing Skills 11 quarter 4 melc 1
Reading and Writing Skills 11 quarter 4 melc 1GloryAnnCastre1
 
ROLES IN A STAGE PRODUCTION in arts.pptx
ROLES IN A STAGE PRODUCTION in arts.pptxROLES IN A STAGE PRODUCTION in arts.pptx
ROLES IN A STAGE PRODUCTION in arts.pptxVanesaIglesias10
 
Mental Health Awareness - a toolkit for supporting young minds
Mental Health Awareness - a toolkit for supporting young mindsMental Health Awareness - a toolkit for supporting young minds
Mental Health Awareness - a toolkit for supporting young mindsPooky Knightsmith
 
Unraveling Hypertext_ Analyzing Postmodern Elements in Literature.pptx
Unraveling Hypertext_ Analyzing  Postmodern Elements in  Literature.pptxUnraveling Hypertext_ Analyzing  Postmodern Elements in  Literature.pptx
Unraveling Hypertext_ Analyzing Postmodern Elements in Literature.pptxDhatriParmar
 
Q4-PPT-Music9_Lesson-1-Romantic-Opera.pptx
Q4-PPT-Music9_Lesson-1-Romantic-Opera.pptxQ4-PPT-Music9_Lesson-1-Romantic-Opera.pptx
Q4-PPT-Music9_Lesson-1-Romantic-Opera.pptxlancelewisportillo
 
Q-Factor HISPOL Quiz-6th April 2024, Quiz Club NITW
Q-Factor HISPOL Quiz-6th April 2024, Quiz Club NITWQ-Factor HISPOL Quiz-6th April 2024, Quiz Club NITW
Q-Factor HISPOL Quiz-6th April 2024, Quiz Club NITWQuiz Club NITW
 
How to Make a Duplicate of Your Odoo 17 Database
How to Make a Duplicate of Your Odoo 17 DatabaseHow to Make a Duplicate of Your Odoo 17 Database
How to Make a Duplicate of Your Odoo 17 DatabaseCeline George
 
Daily Lesson Plan in Mathematics Quarter 4
Daily Lesson Plan in Mathematics Quarter 4Daily Lesson Plan in Mathematics Quarter 4
Daily Lesson Plan in Mathematics Quarter 4JOYLYNSAMANIEGO
 
Active Learning Strategies (in short ALS).pdf
Active Learning Strategies (in short ALS).pdfActive Learning Strategies (in short ALS).pdf
Active Learning Strategies (in short ALS).pdfPatidar M
 
Man or Manufactured_ Redefining Humanity Through Biopunk Narratives.pptx
Man or Manufactured_ Redefining Humanity Through Biopunk Narratives.pptxMan or Manufactured_ Redefining Humanity Through Biopunk Narratives.pptx
Man or Manufactured_ Redefining Humanity Through Biopunk Narratives.pptxDhatriParmar
 
week 1 cookery 8 fourth - quarter .pptx
week 1 cookery 8  fourth  -  quarter .pptxweek 1 cookery 8  fourth  -  quarter .pptx
week 1 cookery 8 fourth - quarter .pptxJonalynLegaspi2
 
Grade Three -ELLNA-REVIEWER-ENGLISH.pptx
Grade Three -ELLNA-REVIEWER-ENGLISH.pptxGrade Three -ELLNA-REVIEWER-ENGLISH.pptx
Grade Three -ELLNA-REVIEWER-ENGLISH.pptxkarenfajardo43
 
Grade 9 Quarter 4 Dll Grade 9 Quarter 4 DLL.pdf
Grade 9 Quarter 4 Dll Grade 9 Quarter 4 DLL.pdfGrade 9 Quarter 4 Dll Grade 9 Quarter 4 DLL.pdf
Grade 9 Quarter 4 Dll Grade 9 Quarter 4 DLL.pdfJemuel Francisco
 
DIFFERENT BASKETRY IN THE PHILIPPINES PPT.pptx
DIFFERENT BASKETRY IN THE PHILIPPINES PPT.pptxDIFFERENT BASKETRY IN THE PHILIPPINES PPT.pptx
DIFFERENT BASKETRY IN THE PHILIPPINES PPT.pptxMichelleTuguinay1
 

Recently uploaded (20)

Congestive Cardiac Failure..presentation
Congestive Cardiac Failure..presentationCongestive Cardiac Failure..presentation
Congestive Cardiac Failure..presentation
 
ICS2208 Lecture6 Notes for SL spaces.pdf
ICS2208 Lecture6 Notes for SL spaces.pdfICS2208 Lecture6 Notes for SL spaces.pdf
ICS2208 Lecture6 Notes for SL spaces.pdf
 
Concurrency Control in Database Management system
Concurrency Control in Database Management systemConcurrency Control in Database Management system
Concurrency Control in Database Management system
 
Reading and Writing Skills 11 quarter 4 melc 1
Reading and Writing Skills 11 quarter 4 melc 1Reading and Writing Skills 11 quarter 4 melc 1
Reading and Writing Skills 11 quarter 4 melc 1
 
ROLES IN A STAGE PRODUCTION in arts.pptx
ROLES IN A STAGE PRODUCTION in arts.pptxROLES IN A STAGE PRODUCTION in arts.pptx
ROLES IN A STAGE PRODUCTION in arts.pptx
 
Mental Health Awareness - a toolkit for supporting young minds
Mental Health Awareness - a toolkit for supporting young mindsMental Health Awareness - a toolkit for supporting young minds
Mental Health Awareness - a toolkit for supporting young minds
 
Unraveling Hypertext_ Analyzing Postmodern Elements in Literature.pptx
Unraveling Hypertext_ Analyzing  Postmodern Elements in  Literature.pptxUnraveling Hypertext_ Analyzing  Postmodern Elements in  Literature.pptx
Unraveling Hypertext_ Analyzing Postmodern Elements in Literature.pptx
 
Q4-PPT-Music9_Lesson-1-Romantic-Opera.pptx
Q4-PPT-Music9_Lesson-1-Romantic-Opera.pptxQ4-PPT-Music9_Lesson-1-Romantic-Opera.pptx
Q4-PPT-Music9_Lesson-1-Romantic-Opera.pptx
 
Q-Factor HISPOL Quiz-6th April 2024, Quiz Club NITW
Q-Factor HISPOL Quiz-6th April 2024, Quiz Club NITWQ-Factor HISPOL Quiz-6th April 2024, Quiz Club NITW
Q-Factor HISPOL Quiz-6th April 2024, Quiz Club NITW
 
How to Make a Duplicate of Your Odoo 17 Database
How to Make a Duplicate of Your Odoo 17 DatabaseHow to Make a Duplicate of Your Odoo 17 Database
How to Make a Duplicate of Your Odoo 17 Database
 
Paradigm shift in nursing research by RS MEHTA
Paradigm shift in nursing research by RS MEHTAParadigm shift in nursing research by RS MEHTA
Paradigm shift in nursing research by RS MEHTA
 
Daily Lesson Plan in Mathematics Quarter 4
Daily Lesson Plan in Mathematics Quarter 4Daily Lesson Plan in Mathematics Quarter 4
Daily Lesson Plan in Mathematics Quarter 4
 
prashanth updated resume 2024 for Teaching Profession
prashanth updated resume 2024 for Teaching Professionprashanth updated resume 2024 for Teaching Profession
prashanth updated resume 2024 for Teaching Profession
 
INCLUSIVE EDUCATION PRACTICES FOR TEACHERS AND TRAINERS.pptx
INCLUSIVE EDUCATION PRACTICES FOR TEACHERS AND TRAINERS.pptxINCLUSIVE EDUCATION PRACTICES FOR TEACHERS AND TRAINERS.pptx
INCLUSIVE EDUCATION PRACTICES FOR TEACHERS AND TRAINERS.pptx
 
Active Learning Strategies (in short ALS).pdf
Active Learning Strategies (in short ALS).pdfActive Learning Strategies (in short ALS).pdf
Active Learning Strategies (in short ALS).pdf
 
Man or Manufactured_ Redefining Humanity Through Biopunk Narratives.pptx
Man or Manufactured_ Redefining Humanity Through Biopunk Narratives.pptxMan or Manufactured_ Redefining Humanity Through Biopunk Narratives.pptx
Man or Manufactured_ Redefining Humanity Through Biopunk Narratives.pptx
 
week 1 cookery 8 fourth - quarter .pptx
week 1 cookery 8  fourth  -  quarter .pptxweek 1 cookery 8  fourth  -  quarter .pptx
week 1 cookery 8 fourth - quarter .pptx
 
Grade Three -ELLNA-REVIEWER-ENGLISH.pptx
Grade Three -ELLNA-REVIEWER-ENGLISH.pptxGrade Three -ELLNA-REVIEWER-ENGLISH.pptx
Grade Three -ELLNA-REVIEWER-ENGLISH.pptx
 
Grade 9 Quarter 4 Dll Grade 9 Quarter 4 DLL.pdf
Grade 9 Quarter 4 Dll Grade 9 Quarter 4 DLL.pdfGrade 9 Quarter 4 Dll Grade 9 Quarter 4 DLL.pdf
Grade 9 Quarter 4 Dll Grade 9 Quarter 4 DLL.pdf
 
DIFFERENT BASKETRY IN THE PHILIPPINES PPT.pptx
DIFFERENT BASKETRY IN THE PHILIPPINES PPT.pptxDIFFERENT BASKETRY IN THE PHILIPPINES PPT.pptx
DIFFERENT BASKETRY IN THE PHILIPPINES PPT.pptx
 

Walk Free Foundation: Global Slavery Index 2014

  • 1. 1.
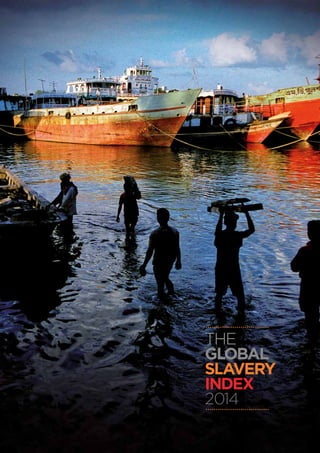
  • 2. 2. Copyright © 2014. Hope for Children Organization Australia Ltd.All rights reserved. Printed in Australia. WWW.GLOBALSLAVERYINDEX.ORG Coverimage–G.M.B.Akash
  • 3. ‘‘You may choose to look the other way but you can never say again that you did not know.’’ WilliamWilberforce HIGHLIGHTS OF THE GLOBAL SLAVERY INDEX This is the second edition of the Global Slavery Index (the Index). It is the first Index of its kind – providing an estimate, country by country, of the number of people living in modern slavery today. The prevalence of modern slavery is highest in: Mauritania Uzbekistan Haiti Qatar India Pakistan Democratic Republic of the Congo Sudan Syria Central African Republic The governments that are taking the most action to end modern slavery are: Netherlands Sweden United States Australia Switzerland Ireland Norway United Kingdom Georgia Austria In absolute terms, the countries with the highest number of people in modern slavery are: India China Pakistan Uzbekistan Russia Nigeria Democratic Republic of the Congo Indonesia Bangladesh Thailand When economic capacity is taken into account, these countries are taking strong efforts to respond to modern slavery with relatively limited resources: Georgia Philippines Macedonia Jamaica The governments that are taking the least action to end modern slavery are: North Korea Iran Syria Eritrea Central African Republic Libya Equatorial Guinea Uzbekistan Republic of the Congo Iraq The governments that should be doing more, given their wealth are: Hong Kong Kuwait Brunei Singapore Qatar Estimated people in modern slavery globally 35.8MILLION 61% Of those living in modern slavery are in five countries: India, China, Pakistan, Uzbekistan, Russia About the Index ●● It provides an analysis of the prevalence of modern slavery in terms of the percentage of a national population and the total number of people living in modern slavery – country by country,region by region. ●● For the first time,the Index includes an analysis of what governments are doing to eradicate modern slavery. ●● It also looks at the contextual factors that make people vulnerable to modern slavery.
  • 4. 7.6. When the absolute number of people in modern slavery per country is considered, the country ranking shifts.The ten countries with the largest estimated numbers of people in modern slavery are: India, China, Pakistan, Uzbekistan, Russia, Nigeria, the Democratic Republic of the Congo, Indonesia, Bangladesh and Thailand.Taken together, these ten countries account for 71 percent of the total estimate of 35.8 million people living in modern slavery. The regions with the lowest estimates of people enslaved are Europe and North America. Iceland and Ireland have the lowest prevalence of modern slavery in the world. Scandinavian countries with comparatively low prevalence include Norway, Finland and Denmark. Canada has the lowest estimated prevalence in the Americas, and New Zealand,Taiwan and Australia have the smallest concentration of people enslaved in the Asia Pacific region. In 2014, the Index includes an analysis of 167 government responses based on five objectives that every single country should seek to accomplish in order to eradicate modern slavery: ●● Survivors are identified, supported to exit and remain out of modern slavery. ●● Criminal justice mechanisms address modern slavery. ●● Coordination and accountability mechanisms for the central government are in place. ●● Attitudes, social systems and institutions that enable modern slavery are addressed. ●● Businesses and governments through their public procurement stop sourcing goods and services that use modern slavery. It is promising that the majority of countries have a basic national action plan to address some forms of modern slavery, and/or a national body tasked with coordinating responses to this crime. However, implementation continues to be weak. Aside from North Korea, all countries also have national laws that criminalise at least some form of modern slavery. While most countries have patchy, basic victim support services, very few countries have comprehensive services for men, women and children, covering both emergency support and long term reintegration services. Norway is one of the few countries in the world which provides holistic services for victims of modern slavery. Globally, only three of 167 governments are making some effort to address modern slavery in government procurement and in the supply chains of businesses operating in their countries: the United States of America, Brazil and Australia. Considered overall, countries taking the most action to end modern slavery are: the Netherlands, Sweden, the United States, Australia, Switzerland, Ireland, Norway, the United Kingdom, Georgia, and Austria. Despite the fact that the highest ranking countries have comparatively more robust policies in place, most have the economic capacity to do significantly more to end modern slavery. When national economic capacity is taken into account, countries that are making comparatively strong efforts with limited resources include: Georgia, the Philippines and Jamaica, with criminal justice responses in place, and Macedonia, with relatively strong support services for victims of modern slavery. The countries with the weakest responses to modern slavery are: North Korea, Iran, Syria, Eritrea, the Central African Republic, Libya, Equatorial Guinea, Uzbekistan, the Republic of the Congo, and Iraq. Many of these countries have weak economies, such as Equatorial Guinea, or have been plagued by conflict and political instability in recent years – for example, Libya, Central African Republic and Syria. Some governments impose state-sponsored modern slavery, as experienced by the 1.2 million people forced to harvest cotton in Uzbekistan, or those forced to labour in prison camps in North Korea. Lastly, the vulnerability of individuals to enslavement within countries was investigated by analysing five dimensions, including, state policy on modern slavery, human rights, human development, state stability, and levels of discrimination. The findings illustrate a strong link between the stability or instability of a country and the vulnerability of its population to modern slavery.Anti- slavery policies will have little impact when a country’s rule of law has broken down because of civil war, or ethnic or religious conflict. High levels of prejudice and discrimination in a society can also create a context that marks some people as less important and less deserving of rights and protection, which in turn makes the crime of modern slavery easier to commit against them. Statistical testing confirms the connection between discrimination and modern slavery. This is the second edition of the Global Slavery Index (‘the Index’).The Index estimates the number of people in modern slavery in 167 countries.This year’s Index also includes an analysis of what governments are doing to eradicate modern slavery. In addition to measuring the extent of the problem and the actions taken, the Index increases our understanding of the contextual factors that make people vulnerable to modern slavery. The Index is the flagship report produced by the Walk Free Foundation, a global human rights organisation dedicated to ending modern slavery. The Walk Free Foundation was founded by Australian philanthropists,Andrew and Nicola Forrest.The methodology for the Index was developed by an internal research team and through external consultations with an international and independent Expert Advisory Group. The 2014 Global Slavery Index estimates there are 35.8 million people living in some form of modern slavery globally. The estimated prevalence of people in modern slavery has increased from 2013. It is important to note that we are not asserting that there has been an increase in modern slavery around the world over the last year.We believe that the majority of this increase is due to the improved accuracy and precision of our measures, and that we are uncovering modern slavery where it was not found before. This year’s improved methodology includes nationally representative random sample surveys undertaken in seven countries, which provided data points for ten countries. In addition, we obtained data from a further nine random sample surveys, increasing the number of countries where survey data is available to a total of 19. In 2013, we released the Index with a sense of urgency to raise awareness of modern slavery while acknowledging that the figures were an imperfect estimate.As modern slavery is a hidden crime and notoriously difficult to measure, in 2014, these surveys have enabled us to have a more precise measurement of the number of people enslaved.We will continue to improve the methodology by including more random sample surveys every year. For 2014, the ten countries with the highest estimated prevalence of modern slavery by population are: Mauritania, Uzbekistan, Haiti, Qatar, India, Pakistan, the Democratic Republic of the Congo, Sudan, Syria and the Central African Republic.These countries span different regions, they have diverse political systems, and range from low to high income economies. EXECUTIVE SUMMARY From children denied an education by being forced to work or marry early, to men unable to leave their work because of crushing debts they owe to recruitment agents, to women and girls exploited as unpaid, abused domestic workers, modern slavery has many faces and comes in many different forms. It still exists today, in every country – modern slavery affects us all. Image – G.M.B.Akash
  • 5. 9.8. Highlights of the Global Slavery Index. . . . . . . . . . . . . . . . . . . . . . . . . . . . . . . . . . . . . . . . . . . . 3 Executive Summary. . . . . . . . . . . . . . . . . . . . . . . . . . . . . . . . . . . . . . . . . . . . . . . . . . . . . . . . . . . . . . . . . . . . . . . . . . . . 4 Terminology. . . . . . . . . . . . . . . . . . . . . . . . . . . . . . . . . . . . . . . . . . . . . . . . . . . . . . . . . . . . . . . . . . . . . . . . . . . . . . . . . . . . . . . . . 8 What is modern slavery?. . . . . . . . . . . . . . . . . . . . . . . . . . . . . . . . . . . . . . . . . . . . . . . . . . . . . . . . . . . . . . . . . . . . . 8 About the 2014 Global Slavery Index. . . . . . . . . . . . . . . . . . . . . . . . . . . . . . . . . . . . . . . . . . . . . . . 9 The Methodology. . . . . . . . . . . . . . . . . . . . . . . . . . . . . . . . . . . . . . . . . . . . . . . . . . . . . . . . . . . . . . . . . . . . . . . . . . . . . . 10 How did we measure prevalence?. . . . . . . . . . . . . . . . . . . . . . . . . . . . . . . . . . . . . . . . . . . . . . . . . . . . . 10 How did we measure government responses?.. . . . . . . . . . . . . . . . . . . . . . . . . . . . . . . . . . . 10 How did we measure vulnerability?. . . . . . . . . . . . . . . . . . . . . . . . . . . . . . . . . . . . . . . . . . . . . . . . . . 10 Global Findings.. . . . . . . . . . . . . . . . . . . . . . . . . . . . . . . . . . . . . . . . . . . . . . . . . . . . . . . . . . . . . . . . . . . . . . . . . . . . . . . . . 13 How big is the problem?. . . . . . . . . . . . . . . . . . . . . . . . . . . . . . . . . . . . . . . . . . . . . . . . . . . . . . . . . . . . . . . . . . . 15 Estimates of people in modern slavery by absolute number.. . . . . . . . . . . . . . 18 How are governments tackling modern slavery?. . . . . . . . . . . . . . . . . . . . . . . . . . . . . . . 20 Measuring vulnerability. . . . . . . . . . . . . . . . . . . . . . . . . . . . . . . . . . . . . . . . . . . . . . . . . . . . . . . . . . . . . . . . . . . . 25 Regional Analysis.. . . . . . . . . . . . . . . . . . . . . . . . . . . . . . . . . . . . . . . . . . . . . . . . . . . . . . . . . . . . . . . . . . . . . . . . . . . . . . 29 Asia Pacific.. . . . . . . . . . . . . . . . . . . . . . . . . . . . . . . . . . . . . . . . . . . . . . . . . . . . . . . . . . . . . . . . . . . . . . . . . . . . . . . . . . . . . . . 31 Europe. . . . . . . . . . . . . . . . . . . . . . . . . . . . . . . . . . . . . . . . . . . . . . . . . . . . . . . . . . . . . . . . . . . . . . . . . . . . . . . . . . . . . . . . . . . . . . 37 Russia and Eurasia. . . . . . . . . . . . . . . . . . . . . . . . . . . . . . . . . . . . . . . . . . . . . . . . . . . . . . . . . . . . . . . . . . . . . . . . . . . . 43 Sub-Saharan Africa.. . . . . . . . . . . . . . . . . . . . . . . . . . . . . . . . . . . . . . . . . . . . . . . . . . . . . . . . . . . . . . . . . . . . . . . . . . . 47 The Middle East and North Africa.. . . . . . . . . . . . . . . . . . . . . . . . . . . . . . . . . . . . . . . . . . . . . . . . . . . 55 The Americas.. . . . . . . . . . . . . . . . . . . . . . . . . . . . . . . . . . . . . . . . . . . . . . . . . . . . . . . . . . . . . . . . . . . . . . . . . . . . . . . . . . . 59 Selected Country Studies. . . . . . . . . . . . . . . . . . . . . . . . . . . . . . . . . . . . . . . . . . . . . . . . . . . . . . . . . . . . . . . . . 65 Mauritania. . . . . . . . . . . . . . . . . . . . . . . . . . . . . . . . . . . . . . . . . . . . . . . . . . . . . . . . . . . . . . . . . . . . . . . . . . . . . . . . . . . . . . . . 66 Uzbekistan. . . . . . . . . . . . . . . . . . . . . . . . . . . . . . . . . . . . . . . . . . . . . . . . . . . . . . . . . . . . . . . . . . . . . . . . . . . . . . . . . . . . . . . . 68 Haiti. . . . . . . . . . . . . . . . . . . . . . . . . . . . . . . . . . . . . . . . . . . . . . . . . . . . . . . . . . . . . . . . . . . . . . . . . . . . . . . . . . . . . . . . . . . . . . . . . 70 Qatar. . . . . . . . . . . . . . . . . . . . . . . . . . . . . . . . . . . . . . . . . . . . . . . . . . . . . . . . . . . . . . . . . . . . . . . . . . . . . . . . . . . . . . . . . . . . . . . . 72 India. . . . . . . . . . . . . . . . . . . . . . . . . . . . . . . . . . . . . . . . . . . . . . . . . . . . . . . . . . . . . . . . . . . . . . . . . . . . . . . . . . . . . . . . . . . . . . . . . 74 Pakistan.. . . . . . . . . . . . . . . . . . . . . . . . . . . . . . . . . . . . . . . . . . . . . . . . . . . . . . . . . . . . . . . . . . . . . . . . . . . . . . . . . . . . . . . . . . . . 76 Democratic Republic of the Congo. . . . . . . . . . . . . . . . . . . . . . . . . . . . . . . . . . . . . . . . . . . . . . . . . 78 Sudan.. . . . . . . . . . . . . . . . . . . . . . . . . . . . . . . . . . . . . . . . . . . . . . . . . . . . . . . . . . . . . . . . . . . . . . . . . . . . . . . . . . . . . . . . . . . . . . . 80 Syria. . . . . . . . . . . . . . . . . . . . . . . . . . . . . . . . . . . . . . . . . . . . . . . . . . . . . . . . . . . . . . . . . . . . . . . . . . . . . . . . . . . . . . . . . . . . . . . . . 82 Central African Republic. . . . . . . . . . . . . . . . . . . . . . . . . . . . . . . . . . . . . . . . . . . . . . . . . . . . . . . . . . . . . . . . . . 84 United Arab Emirates.. . . . . . . . . . . . . . . . . . . . . . . . . . . . . . . . . . . . . . . . . . . . . . . . . . . . . . . . . . . . . . . . . . . . . . . 86 Russia. . . . . . . . . . . . . . . . . . . . . . . . . . . . . . . . . . . . . . . . . . . . . . . . . . . . . . . . . . . . . . . . . . . . . . . . . . . . . . . . . . . . . . . . . . . . . . . 88 Thailand. . . . . . . . . . . . . . . . . . . . . . . . . . . . . . . . . . . . . . . . . . . . . . . . . . . . . . . . . . . . . . . . . . . . . . . . . . . . . . . . . . . . . . . . . . . 90 Nigeria. . . . . . . . . . . . . . . . . . . . . . . . . . . . . . . . . . . . . . . . . . . . . . . . . . . . . . . . . . . . . . . . . . . . . . . . . . . . . . . . . . . . . . . . . . . . . 92 Bangladesh. . . . . . . . . . . . . . . . . . . . . . . . . . . . . . . . . . . . . . . . . . . . . . . . . . . . . . . . . . . . . . . . . . . . . . . . . . . . . . . . . . . . . . . . 94 Georgia.. . . . . . . . . . . . . . . . . . . . . . . . . . . . . . . . . . . . . . . . . . . . . . . . . . . . . . . . . . . . . . . . . . . . . . . . . . . . . . . . . . . . . . . . . . . . 96 Indonesia. . . . . . . . . . . . . . . . . . . . . . . . . . . . . . . . . . . . . . . . . . . . . . . . . . . . . . . . . . . . . . . . . . . . . . . . . . . . . . . . . . . . . . . . . . 98 China.. . . . . . . . . . . . . . . . . . . . . . . . . . . . . . . . . . . . . . . . . . . . . . . . . . . . . . . . . . . . . . . . . . . . . . . . . . . . . . . . . . . . . . . . . . . . . 100 Brazil. . . . . . . . . . . . . . . . . . . . . . . . . . . . . . . . . . . . . . . . . . . . . . . . . . . . . . . . . . . . . . . . . . . . . . . . . . . . . . . . . . . . . . . . . . . . . . 102 United States. . . . . . . . . . . . . . . . . . . . . . . . . . . . . . . . . . . . . . . . . . . . . . . . . . . . . . . . . . . . . . . . . . . . . . . . . . . . . . . . . . 104 Australia.. . . . . . . . . . . . . . . . . . . . . . . . . . . . . . . . . . . . . . . . . . . . . . . . . . . . . . . . . . . . . . . . . . . . . . . . . . . . . . . . . . . . . . . . . 106 The Netherlands. . . . . . . . . . . . . . . . . . . . . . . . . . . . . . . . . . . . . . . . . . . . . . . . . . . . . . . . . . . . . . . . . . . . . . . . . . . . . 108 Appendices. . . . . . . . . . . . . . . . . . . . . . . . . . . . . . . . . . . . . . . . . . . . . . . . . . . . . . . . . . . . . . . . . . . . . . . . . . . . . . . . . . . . . . . 111 Appendix 1 – Terminology.. . . . . . . . . . . . . . . . . . . . . . . . . . . . . . . . . . . . . . . . . . . . . . . . . . . . . . . . . . . . . . . 112 Appendix 2 – Methodology. . . . . . . . . . . . . . . . . . . . . . . . . . . . . . . . . . . . . . . . . . . . . . . . . . . . . . . . . . . . . . 113 Estimating Prevalence. . . . . . . . . . . . . . . . . . . . . . . . . . . . . . . . . . . . . . . . . . . . . . . . . . . . . . . . . . . . . . . . . . . . . 113 Measuring Government Responses.. . . . . . . . . . . . . . . . . . . . . . . . . . . . . . . . . . . . . . . . . . . . . . . . 117 MeasuringVulnerability.. . . . . . . . . . . . . . . . . . . . . . . . . . . . . . . . . . . . . . . . . . . . . . . . . . . . . . . . . . . . . . . . . . 125 Appendix 3 – Data Tables.. . . . . . . . . . . . . . . . . . . . . . . . . . . . . . . . . . . . . . . . . . . . . . . . . . . . . . . . . . . . . . . . . 130 Endnotes. . . . . . . . . . . . . . . . . . . . . . . . . . . . . . . . . . . . . . . . . . . . . . . . . . . . . . . . . . . . . . . . . . . . . . . . . . . . . . . . . . . . . . . . . . . 142 Contents Image–PepBonet
  • 6. 11.10. ABOUT THE 2014 GLOBAL SLAVERY INDEX Modern slavery is a hidden crime. It takes many forms, and is known by many names: slavery, forced labour, or human trafficking.All forms involve one person depriving another person of their freedom: their freedom to leave one job for another, their freedom to leave one workplace for another, their freedom to control their own body. Modern slavery involves one person possessing or controlling a person in such as a way as to significantly deprive that person of their individual liberty, with the intention of exploiting that person through their use, management, profit, transfer or disposal. Modern slavery contributes to the production of at least 122 goods from 58 countries worldwide.The International Labour Organization (ILO) estimates the illicit profits of forced labour to be $US150 billion a year.2 From the Thai fisherman trawling fishmeal, to the Congolese boy mining diamonds, from the Uzbek child picking cotton, to the Indian girl stitching footballs, from the women who sew dresses, to the cocoa pod pickers, their forced labour is what we consume. Modern slavery is big business.Acknowledging the problem, and advocating against it is not philanthropy – it is our responsibility. Nearly every country in the world has committed to eradicate modern slavery, through their national policies and agreements to international conventions.While we all have a role to play, the actions of government are paramount in addressing this problem. Only governments can ensure that victims are not treated as criminals. Only governments can adopt national action plans and allocate budgets to fund responses. The Global Slavery Index is a tool for citizens, non-government organisations (NGOs), businesses, and public officials to understand the size of the problem, existing responses and contributing factors, so they can build sound policies that will end modern slavery. What information is included in the Global Slavery Index? The Global Slavery Index has quantified data across three dimensions: 1. Size of the problem: What is the estimated prevalence of modern slavery country by country,and what is the absolute number by population? 2. Government response: How are governments tackling modern slavery? 3. Vulnerability: What factors explain or predict the prevalence of modern slavery? All of the supporting data tables and methodology are available to download on the Global Slavery Index website www.globalslaveryindex.org 2 International Labour Organization,‘Profits and Poverty:The economics of forced labour’, (ILO, 2014), accessed 06/10/14: http://www.ilo.org/ wcmsp5/groups/public/---ed_norm/---declaration/documents/publication/wcms_243391.pdf TERMINOLOGY What is modern slavery? Different countries use different terminology to describe modern forms of slavery, including the term slavery itself, but also other concepts such as human trafficking, forced labour, debt bondage, forced or servile marriage, and the sale and exploitation of children.1 All of these crimes share some common features. For the purpose of the Index, modern slavery involves one person possessing or controlling another person in such as a way as to significantly deprive that person of their individual liberty, with the intention of exploiting that person through their use, management, profit, transfer or disposal. The Walk Free Foundation definition of modern slavery encompasses the definitions outlined in the box below: Modern Slavery TRAFFICKING IN PERSONS 1 Recruitment, transportation, transfer, harbouring or receipt of persons; 2 By means of threat or use of force or other forms of coercion, of abduction, of fraud, of deception, of the abuse of power or of a position of vulnerability or of the giving or receiving of payments or benefits to achieve the consent of a person having control over another person (these means are not required in the case of children); 3 With the intent of exploiting that person through: Prostitution of others; Sexual exploitation; Forced labour; Slavery (or similar practices); Servitude; and Removal of organs. (UN Trafficking Protocol, 2000) SLAVERY AND SLAVERY LIKE PRACTICES The status or condition of a person over whom any or all of the powers attaching to the right of ownership are exercised. Includes slavery-like practices: debt bondage, forced or servile marriage, sale or exploitation of children (including in armed conflict) and descent-based slavery. (The Slavery Convention (1926) and Supplementary Slavery Convention (1956)) FORCED LABOUR All work or service which is exacted from any person under the menace of any penalty and for which the said person has not offered himself voluntarily. (ILO Forced Labour Convention, 1930 (No. 29)) 1 See Appendix 1 for full list of meanings of these terms, reflecting their origins in international law. Image–G.M.B.Akash
  • 7. 13.12. THE METHODOLOGY How did we measure prevalence? Measuring modern slavery is a very difficult undertaking due to the hidden nature of this crime. Surveys represent the most accurate method for estimating the numbers of people living in modern slavery.This year, the Walk Free Foundation commissioned Gallup Inc.3 to conduct nationally representative, random-sample surveys in seven countries: Nepal, Indonesia, Brazil, Ethiopia, Russia, Pakistan, and Nigeria.The results from these surveys were considered alongside data from other pre-existing surveys and a review of secondary sources for 58 countries. Data from a total of 19 countries were obtained from random sample surveys, including the seven Gallup survey countries. An extrapolation method was developed for the remaining countries that took into account factors including vulnerability, geography, and country context to produce an appropriate estimate.The preliminary prevalence estimates were then reviewed against secondary source estimates and qualitative information collated for 58 countries. Final country level adjustments were made to specific countries where the evidence suggested it was justified, in particular for Small Island Developing States.4 How did we measure government responses? A methodology was developed to measure how governments are responding to modern slavery in 167 countries.A team of researchers collected data against the following five objectives for each country: 1. Survivors are identified, supported to exit and remain out of modern slavery. 2. Criminal justice mechanisms address modern slavery. 3. Coordination and accountability mechanisms for the central government are in place. 4. Attitudes, social systems and institutions that enable modern slavery are addressed. 5. Businesses and governments through their public procurement stop sourcing goods and services that use modern slavery. In April 2014, the Walk Free Foundation also conducted a survey of 167 governments; information from the 38 responses received was incorporated into relevant country research.5 Where possible, the Walk Free Foundation researchers verified data obtained through desk review with experts in each country.This occurred in 60 countries. How did we measure vulnerability? The Global Slavery Index examines the contextual factors that impact on the vulnerability of people in a country to modern slavery. Information was collected from reputable sources on 37 variables across five dimensions that affect vulnerability to enslavement such as: ●● National policies to combat modern slavery. ●● The availability of human rights protections in a country. ●● The level of economic and social development in a country. ●● The level of state stability in a country. ●● The extent of women’s rights and levels of discrimination in a country. Through statistical testing the Index examines the relationship between these factors and the prevalence of modern slavery. An outline of the methodology for assessing prevalence, government responses and vulnerability is available in Appendix 2, and a detailed Methodology Paper is available to download on the Global Slavery Index website. 3 Gallup Inc. is an international research-based company, http://www.gallup.com/home.aspx 4 “InternationalYear of Small Developing States 2014”, United Nations, last modified 2014, accessed 22/09/14: http://www.un.org/en/events/islands2014/smallislands.shtml 5 Full list of responses can be found at:“What is the progress update?” Walk Free Foundation, last modified May, 2014, accessed 22/09/14: http://www.globalslaveryindex.org/update/#about “I was born in a small village in Nepal. When I was almost 12 years old I worked in a restaurant. I trusted the woman that I worked for so when she said that I should go with a friend of hers to work in India it never occurred to me that I would be sold into slavery for a brothel.” Voice of a Nepali survivor of sexual exploitation. Image–PepBonet
  • 8. 15.14. Global Findings Low High Estimated Prevalence of Modern Slavery Government Resp AAAAAA BBB The alphabetical depi responses to modern the lowest a D. The colour of the countries as shown on this map designate from lowest to highest prevalence of modern slavery. Those in grey were not included in the Index.
  • 9. 17.16. How big is the problem? The 2014 Global Slavery Index presents a ranking of 167 countries based on the percent of a country’s population that is estimated to be in modern slavery. Five countries are appearing in the Global Slavery Index for the first time:Taiwan, South Sudan, North Korea, Kosovo and Cyprus. A ranking of one in the Index indicates the most severely concentrated modern slavery situation; a ranking of 167 indicates the least severely concentrated modern slavery problem.A detailed description of the methodology underpinning this process is provided in Appendix 2 and on the Global Slavery Index website (www.globalslaveryindex.org). In the second year of the Index, an estimated 35.8 million people are enslaved around the world. It is important to note that we are not asserting that there has been an increase in modern slavery around the world over the last year.We believe that this increase is due to the improved accuracy and precision of our measures and that we are uncovering modern slavery where it was not seen before. As was the case in 2013, the West African nation of Mauritania ranks number one in the Index. In 2014, an estimated four percent of the population – approximately 155,600 people – are enslaved in Mauritania, a country with deeply entrenched hereditary slavery. In the past 12 months, the Mauritanian Government has taken positive steps to address slavery, adopting a plan of action recommended by the United Nations Special Rapporteur on Contemporary Forms of Slavery.The government has agreed, amongst other things, to establishing a special tribunal to adjudicate cases of slavery.While this progress is important, it may be several years before these changes have any impact on the size of the problem. The Republic of Uzbekistan, a Central Asian nation whose economy relies heavily on cotton production and export, is second in the Index.The rise in Uzbekistan’s ranking is a direct reflection of government-imposed forced labour.While it is very difficult to obtain accurate estimates of modern slavery in Uzbekistan, the role of the government in forcing citizens to pick cotton for two months every year has been well-documented by numerous organisations.6 The most conservative of available estimates indicates that almost four percent – approximately 1,201,400 people – of the Uzbek population is subjected to modern slavery during the annual cotton harvest. Several other countries rose in the rankings in 2014.Those that entered the top ten include: Qatar, the Democratic Republic of the Congo, Sudan, Syria and the Central African Republic. Qatar hosts significant numbers of foreign workers, and has risen in the ranking due to improved survey data giving better insight to the high number of enslaved migrant workers in the nation. It is ranked fourth with an estimated 1.4 percent of the population in modern slavery.We consider this to be a conservative estimate. The ranking of Pakistan, the Democratic Republic of the Congo (DRC), Sudan, Syria and the Central African Republic in the top ten reflects the impact of war and conflict on modern slavery. Conflict brings an almost immediate end to the rule of law, as well as bringing most infrastructure, normal services and governmental processes to a halt. In conflict, exploitation becomes an immediate threat to an increased proportion of the population. Over one percent of the population of Pakistan, the Democratic Republic of the Congo, Sudan, Syria and Central African Republic is estimated to be in modern slavery. In absolute terms, this is approximately 2,058,200 people from Pakistan, 762,900 people from DRC, 429,000 people from Sudan, 258,200 people from Syria, and 52,200 people from the Central African Republic. Ireland and Iceland sit at 166 and 167 in the 2014 Index with the lowest prevalence of modern slavery.While the estimated proportion of the population in modern slavery in each country is small (0.0007, or seven in every 10,000 persons in the population), no country in the Global Slavery Index is free of modern slavery. Ireland and Iceland are estimated to have approximately 300 and up to 100 people in modern slavery, respectively. 6 “Follow-up to the conclusions of the Committee on the Application of Standards International Labour Conference, 102nd Session, June 2013: Uzbekistan (Ratification: 2008)”, (International Labour Organization, 2014), accessed 22/09/14: http://www.ilo.org/dyn/normlex/en/f?p=1000:13100:0::NO:13100:P13100_COMMENT_ID:3149080; see also “Forced Labor in Uzbekistan: Report on the 2013 Cotton Harvest”, (Uzbek-German Forum for Human Rights, 2014), accessed 22/09/14: http://uzbekgermanforum.org/wp-content/uploads/2014/06/ Forced-Labor-in-Uzbekistan-Report-2013.pdf Image–VladSokhin
  • 10. 19.18. Rank Country Percent of population in modern slavery Estimated population in modern slavery Population 84 Macedonia 0.360 7,600 2,107,158 85 Slovenia 0.360 7,400 2,060,484 86 Estonia 0.360 4,800 1,324,612 87 Cyprus 0.360 4,100 1,141,166 88 Montenegro 0.360 2,200 621,383 89 Vietnam 0.359 322,200 89,708,900 90 Uganda 0.359 135,000 37,578,876 91 Cameroon 0.359 79,900 22,253,959 92 Sri Lanka 0.359 73,600 20,483,000 93 Kazakhstan 0.359 61,200 17,037,508 94 Azerbaijan 0.359 33,800 9,416,598 95 Tajikistan 0.359 29,500 8,207,834 96 Lao PDR 0.359 24,300 6,769,727 97 Kyrgyzstan 0.359 20,500 5,719,500 98 Turkmenistan 0.359 18,800 5,240,072 99 Timor-Leste 0.340 4,000 1,178,252 100 Tunisia 0.306 33,300 10,886,500 101 Saudi Arabia 0.292 84,200 28,828,870 102 Indonesia 0.286 714,100 249,865,631 103 Philippines 0.266 261,200 98,393,574 104 Mauritius 0.254 3,300 1,296,303 105 Turkey 0.248 185,500 74,932,641 106 Ukraine 0.248 112,600 45,489,600 107 Kosovo 0.248 4,500 1,824,000 108 Gabon 0.248 4,100 1,671,711 109 China 0.239 3,241,400 1,357,380,000 110 Papua New Guinea 0.230 16,800 7,321,262 111 Mexico 0.218 266,900 122,332,399 112 Colombia 0.218 105,400 48,321,405 113 Peru 0.218 66,300 30,375,603 114 Ecuador 0.218 34,300 15,737,878 115 Guatemala 0.218 33,800 15,468,203 116 Bolivia 0.218 23,300 10,671,200 117 Honduras 0.218 17,700 8,097,688 118 Paraguay 0.218 14,800 6,802,295 119 El Salvador 0.218 13,800 6,340,454 120 Nicaragua 0.218 13,300 6,080,478 121 Chile 0.210 36,900 17,619,708 122 Costa Rica 0.210 10,200 4,872,166 123 Panama 0.210 8,100 3,864,170 124 Uruguay 0.210 7,100 3,407,062 125 Venezuela 0.200 60,900 30,405,207 Rank Country Percent of population in modern slavery Estimated population in modern slavery Population 126 South Africa 0.200 106,000 52,981,991 127 Japan 0.187 237,500 127,338,621 128 South Korea 0.187 93,700 50,219,669 129 Argentina 0.187 77,300 41,446,246 130 Poland 0.187 71,900 38,530,725 131 Hong Kong 0.187 13,400 7,187,500 132 Dominican Republic 0.175 18,200 10,403,761 133 Trinidad and Tobago 0.169 2,300 1,341,151 134 Jamaica 0.155 4,200 2,715,000 135 Barbados 0.149 400 284,644 136 Kenya 0.146 64,900 44,353,691 137 Madagascar 0.133 30,400 22,924,851 138 Belarus 0.122 11,500 9,466,000 139 Romania 0.113 22,600 19,963,581 140 Latvia 0.113 2,300 2,013,385 141 Singapore 0.100 5,400 5,399,200 142 Israel 0.081 6,500 8,059,400 143 Brazil 0.078 155,300 200,361,925 144 Cuba 0.036 4,100 11,265,629 145 United States 0.019 60,100 316,128,839 146 Italy 0.019 11,400 59,831,093 147 Germany 0.013 10,500 80,621,788 148 France 0.013 8,600 66,028,467 149 United Kingdom 0.013 8,300 64,097,085 150 Spain 0.013 6,100 46,647,421 151 Canada 0.013 4,600 35,158,304 152 Taiwan 0.013 3,000 23,340,000 153 Australia 0.013 3,000 23,130,900 154 Netherlands 0.013 2,200 16,804,224 155 Belgium 0.013 1,500 11,195,138 156 Greece 0.013 1,400 11,032,328 157 Portugal 0.013 1,400 10,459,806 158 Sweden 0.013 1,200 9,592,552 159 Austria 0.013 1,100 8,473,786 160 Switzerland 0.013 1,100 8,081,482 161 Denmark 0.013 700 5,613,706 162 Finland 0.013 700 5,439,407 163 Norway 0.013 700 5,084,190 164 New Zealand 0.013 600 4,470,800 165 Luxembourg 0.013 100 543,202 166 Ireland 0.007 300 4,595,281 167 Iceland 0.007 100 323,002 Rank of countries by prevalence of population in modern slavery (1 = most severe problem, 167 = least severe problem) Rank Country Percent of population in modern slavery Estimated population in modern slavery Population 1 Mauritania 4.000 155,600 3,889,880 2 Uzbekistan 3.973 1,201,400 30,241,100 3 Haiti 2.304 237,700 10,317,461 4 Qatar 1.356 29,400 2,168,673 5 India 1.141 14,285,700 1,252,139,596 6 Pakistan 1.130 2,058,200 182,142,594 7 Democratic Republic of the Congo 1.130 762,900 67,513,677 8 Sudan 1.130 429,000 37,964,306 9 Syria 1.130 258,200 22,845,550 10 Central African Republic 1.130 52,200 4,616,417 11 Republic of the Congo 1.106 49,200 4,447,632 12 United Arab Emirates 1.057 98,800 9,346,129 13 Iraq 1.035 345,900 33,417,476 14 Cambodia 1.029 155,800 15,135,169 15 Moldova 0.936 33,300 3,559,000 16 Mongolia 0.907 25,700 2,839,073 17 Namibia 0.907 20,900 2,303,315 18 Botswana 0.907 18,300 2,021,144 19 Suriname 0.907 4,900 539,276 20 Nepal 0.823 228,700 27,797,457 21 Ghana 0.746 193,100 25,904,598 22 Mozambique 0.746 192,600 25,833,752 23 Niger 0.746 132,900 17,831,270 24 Burkina Faso 0.746 126,300 16,934,839 25 Malawi 0.746 122,000 16,362,567 26 Zambia 0.746 108,400 14,538,640 27 Senegal 0.746 105,400 14,133,280 28 Benin 0.746 77,000 10,323,474 29 Togo 0.746 50,800 6,816,982 30 Liberia 0.746 32,000 4,294,077 31 Lesotho 0.746 15,500 2,074,465 32 Russia 0.732 1,049,700 143,499,861 33 Tanzania 0.711 350,400 49,253,126 34 Côte d’Ivoire 0.711 144,500 20,316,086 35 Mali 0.711 108,900 15,301,650 36 Chad 0.711 91,200 12,825,314 37 Rwanda 0.711 83,800 11,776,522 38 Guinea 0.711 83,600 11,745,189 39 South Sudan 0.711 80,400 11,296,173 40 Burundi 0.711 72,300 10,162,532 41 Sierra Leone 0.711 43,300 6,092,075 Rank Country Percent of population in modern slavery Estimated population in modern slavery Population 42 Gambia 0.711 13,200 1,849,285 43 Djibouti 0.711 6,200 872,932 44 Thailand 0.709 475,300 67,010,502 45 Oman 0.709 25,800 3,632,444 46 Kuwait 0.709 23,900 3,368,572 47 Bahrain 0.709 9,400 1,332,171 48 Brunei 0.709 3,000 417,784 49 CapeVerde 0.637 3,200 498,897 50 Swaziland 0.536 6,700 1,249,514 51 Guinea-Bissau 0.500 8,500 1,704,255 52 Nigeria 0.481 834,200 173,615,345 53 Egypt 0.480 393,800 82,056,378 54 Algeria 0.480 188,200 39,208,194 55 Morocco 0.480 158,400 33,008,150 56 Malaysia 0.480 142,600 29,716,965 57 Jordan 0.480 31,000 6,459,000 58 Lebanon 0.480 21,400 4,467,390 59 Bangladesh 0.435 680,900 156,594,962 60 Iran 0.435 336,700 77,447,168 61 Myanmar 0.435 231,600 53,259,018 62 Afghanistan 0.435 132,800 30,551,674 63 North Korea 0.435 108,200 24,895,480 64 Yemen 0.435 106,100 24,407,381 65 Angola 0.435 93,400 21,471,618 66 Zimbabwe 0.435 61,500 14,149,648 67 Somalia 0.435 45,600 10,495,583 68 Eritrea 0.435 27,500 6,333,135 69 Libya 0.435 27,000 6,201,521 70 Equatorial Guinea 0.435 3,300 757,014 71 Ethiopia 0.414 389,700 94,100,756 72 Guyana 0.387 3,100 799,613 73 Bulgaria 0.380 27,600 7,265,115 74 Czech Republic 0.360 37,900 10,521,468 75 Hungary 0.360 35,600 9,897,247 76 Serbia 0.360 25,800 7,163,976 77 Slovakia 0.360 19,500 5,414,095 78 Georgia 0.360 16,100 4,476,900 79 Croatia 0.360 15,300 4,252,700 80 Bosnia and Herzegovina 0.360 13,800 3,829,307 81 Armenia 0.360 10,700 2,976,566 82 Lithuania 0.360 10,600 2,956,121 83 Albania 0.360 10,000 2,773,620
  • 11. 21.20. Country Percent of population in modern slavery Estimated population in modern slavery 77 Azerbaijan 0.359 33,800 78 Guatemala 0.218 33,800 79 Moldova 0.936 33,300 80 Tunisia 0.306 33,300 81 Liberia 0.746 32,000 82 Jordan 0.480 31,000 83 Madagascar 0.133 30,400 84 Tajikistan 0.359 29,500 85 Qatar 1.356 29,400 86 Bulgaria 0.380 27,600 87 Eritrea 0.435 27,500 88 Libya 0.435 27,000 89 Oman 0.709 25,800 90 Serbia 0.360 25,800 91 Mongolia 0.907 25,700 92 Lao PDR 0.359 24,300 93 Kuwait 0.709 23,900 94 Bolivia 0.218 23,300 95 Romania 0.113 22,600 96 Lebanon 0.480 21,400 97 Namibia 0.907 20,900 98 Kyrgyzstan 0.359 20,500 99 Slovakia 0.360 19,500 100 Turkmenistan 0.359 18,800 101 Botswana 0.907 18,300 102 Dominican Republic 0.175 18,200 103 Honduras 0.218 17,700 104 Papua New Guinea 0.230 16,800 105 Georgia 0.360 16,100 106 Lesotho 0.746 15,500 107 Croatia 0.360 15,300 108 Paraguay 0.218 14,800 109 Bosnia and Herzegovina 0.360 13,800 110 El Salvador 0.218 13,800 111 Hong Kong 0.187 13,400 112 Nicaragua 0.218 13,300 113 Gambia 0.711 13,200 114 Belarus 0.122 11,500 115 Italy 0.019 11,400 116 Armenia 0.360 10,700 117 Lithuania 0.360 10,600 118 Germany 0.013 10,500 119 Costa Rica 0.210 10,200 120 Albania 0.360 10,000 121 Bahrain 0.709 9,400 Country Percent of population in modern slavery Estimated population in modern slavery 122 France 0.013 8,600 123 Guinea-Bissau 0.500 8,500 124 United Kingdom 0.013 8,300 125 Panama 0.210 8,100 126 Macedonia 0.360 7,600 127 Slovenia 0.360 7,400 128 Uruguay 0.210 7,100 129 Swaziland 0.536 6,700 130 Israel 0.081 6,500 131 Djibouti 0.711 6,200 132 Spain 0.013 6,100 133 Singapore 0.100 5,400 134 Suriname 0.907 4,900 135 Estonia 0.360 4,800 136 Canada 0.013 4,600 137 Kosovo 0.248 4,500 138 Jamaica 0.155 4,200 139 Cyprus 0.360 4,100 140 Gabon 0.248 4,100 141 Cuba 0.036 4,100 142 Timor-Leste 0.340 4,000 143 Equatorial Guinea 0.435 3,300 144 Mauritius 0.254 3,300 145 CapeVerde 0.637 3,200 146 Guyana 0.387 3,100 147 Brunei 0.709 3,000 148 Taiwan 0.013 3,000 149 Australia 0.013 3,000 150 Trinidad and Tobago 0.169 2,300 151 Latvia 0.113 2,300 152 Montenegro 0.360 2,200 153 Netherlands 0.013 2,200 154 Belgium 0.013 1,500 155 Greece 0.013 1,400 156 Portugal 0.013 1,400 157 Sweden 0.013 1,200 158 Austria 0.013 1,100 159 Switzerland 0.013 1,100 160 Denmark 0.013 700 161 Finland 0.013 700 162 Norway 0.013 700 163 New Zealand 0.013 600 164 Barbados 0.149 400 165 Ireland 0.007 300 166 Luxembourg 0.013 100 167 Iceland 0.007 100 Estimates of people in modern slavery by absolute number The countries with the highest numbers of people in modern slavery are India, China, Pakistan, Uzbekistan, Russia, Nigeria, the Democratic Republic of the Congo, Indonesia, Bangladesh, and Thailand.Taken together, these countries account for 71 percent of the estimated 35.8 million people in modern slavery.The following table presents countries in order from highest number of people in modern slavery to the lowest. Countries by absolute estimates of modern slavery, from highest to lowest. Country Percent of population in modern slavery Estimated population in modern slavery 1 India 1.141 14,285,700 2 China 0.239 3,241,400 3 Pakistan 1.130 2,058,200 4 Uzbekistan 3.973 1,201,400 5 Russia 0.732 1,049,700 6 Nigeria 0.481 834,200 7 Democratic Republic of the Congo 1.130 762,900 8 Indonesia 0.286 714,100 9 Bangladesh 0.435 680,900 10 Thailand 0.709 475,300 11 Sudan 1.130 429,000 12 Egypt 0.480 393,800 13 Ethiopia 0.414 389,700 14 Tanzania 0.711 350,400 15 Iraq 1.035 345,900 16 Iran 0.435 336,700 17 Vietnam 0.359 322,200 18 Mexico 0.218 266,900 19 Philippines 0.266 261,200 20 Syria 1.130 258,200 21 Haiti 2.304 237,700 22 Japan 0.187 237,500 23 Myanmar 0.435 231,600 24 Nepal 0.823 228,700 25 Ghana 0.746 193,100 26 Mozambique 0.746 192,600 27 Algeria 0.480 188,200 28 Turkey 0.248 185,500 29 Morocco 0.480 158,400 30 Cambodia 1.029 155,800 31 Mauritania 4.000 155,600 32 Brazil 0.078 155,300 33 Côte d’Ivoire 0.711 144,500 34 Malaysia 0.480 142,600 35 Uganda 0.359 135,000 36 Niger 0.746 132,900 37 Afghanistan 0.435 132,800 38 Burkina Faso 0.746 126,300 Country Percent of population in modern slavery Estimated population in modern slavery 39 Malawi 0.746 122,000 40 Ukraine 0.248 112,600 41 Mali 0.711 108,900 42 Zambia 0.746 108,400 43 North Korea 0.435 108,200 44 Yemen 0.435 106,100 45 South Africa 0.200 106,000 46 Senegal 0.746 105,400 47 Colombia 0.218 105,400 48 United Arab Emirates 1.057 98,800 49 South Korea 0.187 93,700 50 Angola 0.435 93,400 51 Chad 0.711 91,200 52 Saudi Arabia 0.292 84,200 53 Rwanda 0.711 83,800 54 Guinea 0.711 83,600 55 South Sudan 0.711 80,400 56 Cameroon 0.359 79,900 57 Argentina 0.187 77,300 58 Benin 0.746 77,000 59 Sri Lanka 0.359 73,600 60 Burundi 0.711 72,300 61 Poland 0.187 71,900 62 Peru 0.218 66,300 63 Kenya 0.146 64,900 64 Zimbabwe 0.435 61,500 65 Kazakhstan 0.359 61,200 66 Venezuela 0.200 60,900 67 United States 0.019 60,100 68 Central African Republic 1.130 52,200 69 Togo 0.746 50,800 70 Republic of the Congo 1.106 49,200 71 Somalia 0.435 45,600 72 Sierra Leone 0.711 43,300 73 Czech Republic 0.360 37,900 74 Chile 0.210 36,900 75 Hungary 0.360 35,600 76 Ecuador 0.218 34,300
  • 12. 23.22. The Netherlands has the strongest response to modern slavery of the 167 countries examined, scoring highly across victim assistance programmes, criminal justice responses, and responding to institutional risk.The Netherlands includes the private sector in its National Action Plan and conducts independent evaluations. Other governments in the top ten responses are, Sweden, the United States, Australia, Switzerland, Ireland, Norway, the United Kingdom, Georgia and Austria. Common characteristics of each of these countries are a strong political will to respond to the issue and a strong rule of law.These countries are also starting to take ownership of the link between business and modern slavery. In Brazil, companies that profit from slave labour are named and shamed. In the US, the government has taken steps to ensure its procurement practices are not contributing to modern slavery. In Australia, public procurement rules identify modern slavery as an important issue when considering the ethical behaviour of suppliers, but it is not clear if this has translated to action yet. While these efforts are commendable, most countries within the top ten responses have strong economies, and also benefit from low prevalence and low risk across all vulnerability dimensions (indicating state stability, respect for human rights and rule of law). Despite these strong economies, none of these countries have a perfect response to modern slavery. In the US, victim support services are currently underfunded, and skewed towards supporting victims of sexual exploitation, but not forced labour despite recent studies confirming the significance of this problem.Victim support services in the Netherlands also focus predominately on those who experience commercial sexual exploitation. The actions of Georgia deserve credit – despite having a weaker economy than many countries covered by the Index and ranking 78th in the Global Slavery Index for prevalence, the government has taken some strong steps to eradicate modern slavery. More, however, could be done to provide training to those who would ordinarily identify victims, and to address vulnerability factors. In several of the countries in the top ten of responses, there is evidence of discriminatory migration policies, deportation of potential victims without sufficient screening, or criminalisation of victims for actions whilst under the control of criminals.The United Kingdom, for example, has been accused of deporting, or detaining in immigration detention centres, foreign migrants who are potential victims of modern slavery.There are inconsistencies in Australia’s screening processes of vulnerable migrant populations, such as asylum seekers, for indicators of trafficking.There have also been reports of children being treated as offenders in the United States for conduct committed as a direct result of being sold to others for sexual exploitation. Unaccompanied minors can also be subject to fast track screening and deportation at border points making it very unlikely for modern slavery to be detected. Countries at the lower end of the ranking include North Korea, Iran, Syria, Eritrea, the Central African Republic, Libya, Equatorial Guinea, Uzbekistan, the Republic of the Congo and Iraq.These countries are characterised by weak economies, high levels of instability caused by recent conflict, such as Libya and Syria, or government complicity in modern slavery. Uzbek cotton, produced with forced labour, is exported to Bangladesh, South Korea and China. In North Korea, prisoners in the gulag system – or forced labour camps – produce hardwoods for export to Japan.The forced labour systems in both Uzbekistan and North Korea are major contributors to their national economies. Hong Kong, Kuwait and Saudi Arabia each have either a strong or middle range economy, but have a particularly poor response to modern slavery.The kafala system, which ties an employee to an employer, has facilitated to significant abuses of domestic and construction workers in the Middle East. Hong Kong is part of a small group of countries in South East Asia, such as Japan, Malaysia and Singapore, who, despite their relative wealth, have done little to respond to the problem within their borders. Overall, many countries appear to have responses in place on paper, yet modern slavery still persists.This indicates that these responses are either not fit for purpose, or are not being fully implemented, or a combination of the two. Countries in South East Asia, such as Thailand and Indonesia, appear to have strong responses on paper, but these are often poorly implemented, or are hampered by high levels of corruption. How are governments tackling modern slavery? While no country has a fully comprehensive response to modern slavery, most countries within the Index are taking some action to respond to the problem. All countries, with the exception of North Korea, have domestic legislation which criminalises some form of modern slavery.This ranges from articles in their penal codes criminalising forced labour or child commercial sexual exploitation, through to fully fledged counter trafficking legislation.Australia and the United Kingdom currently criminalise all forms of modern slavery, including forced marriage.While in most countries there is room for improvement, some laws do exist to hold perpetrators to account in almost every country, which suggests much more could be done within existing frameworks. Many countries have developed a national action plan to respond to forms of modern slavery (101 of 167 countries), and some have a national coordination body (140 of 167 countries). Nearly all countries participate in a relevant regional response (165 of 167 countries). Identifying victims is a critical first step to ensuring that they are removed from harm and provided with support. Most governments provide some training to front line law enforcement on how to identify victims (150 of 167). In 2014, the Index does not take into account the scale or quality of the training. Fewer governments, however, are providing training for other potential ‘first responders’, that is those in the health and social services, teachers, or those who work in the tourism industry, who may also come into contact with victims. Ireland,Argentina, and Montenegro are particularly strong in running regular and systematic training for ‘first responders’. Victim assistance for men, women and children is a weakness of all government responses. No country scored 100 percent on these activities while the majority of countries scored 50 percent or lower. Most countries either only provide short term assistance, neglecting long-term reintegration, or provide support solely for female or child victims. Many countries are taking steps to respond to attitudes or institutions that enable modern slavery to exists (165 of 167). Of these governments, approximately 93 percent run public information campaigns to raise awareness of modern slavery, while only eight percent focus on behaviour change. Many countries also have in place safety nets, such as child protection systems, and protections for Internally Displaced Persons (IDPs), asylum seekers and stateless people (120 of 167 countries).While these protections may exist in paper, the challenge is how to assess if such protections operate in reality. Globally, only three governments are making some efforts to prevent the use of forced or slave labour in their supply chains, and in the supply chains of businesses operating in their country. These include the United States, Brazil and Australia.These countries have either made a public commitment to address modern slavery within their own supply chains, such as Australia, or have taken more active steps to ensure supply chain transparency, such the United States’ Executive Order, or Brazil’s Register of Companies (the Dirty List). Brazil’s Dirty List and National Pact: Brazil’s ‘dirty list’ publicly names and shames companies that have been found to be profiting from slave labour. Companies, from major brands to small enterprises, stay on the list for two years, during which time they have to prove they are making efforts to clean up supply chains.They cannot obtain credit from the government and private banks and are boycotted by those who signed up to the list. The ‘National Pact for the Eradication of Slave Labour’ was launched in 2005, and brings together multiple stakeholders who are committed to end modern slavery.The Ethos Institute, the Social Observatory, the Social Observatory Institute (IOS), the International Labour Organisation (ILO) and the Non-Government Organisation (NGO) Reporter Brazil work with Brazilian and multinational companies that have signed the Pact to maintain slavery free supply chains. United States Executive Order 13627: As the largest single purchaser of goods and services in the world, the United States Government has taken important steps to ensure that its procurement practices are not contributing to modern slavery. President Obama introduced the “Strengthening Protections Against Trafficking in Persons in Federal Contracts” order in 2012, which strengthens the US Government’s existing zero-tolerance policy on human trafficking in government contracting.The order will require federal contractors and sub-contractors to take specific preventative measures to address and eliminate modern slavery in their supply chains. It requires contracts exceeding $US500,000 performed abroad to develop robust risk assessment and compliance plans.
  • 13. 25.24. * The USA was capped at a BBB due to evidence of criminalisation of victims, and risk of deportation of potential vicitms. Rank of countries by government response Rank Country Rating 1 Netherlands AA 2 Sweden A 3 United States BBB* 4 Australia BBB 5 Switzerland BBB 6 Ireland BBB 7 Norway BBB 8 United Kingdom BBB 9 Georgia BBB 10 Austria BBB 11 Belgium BBB 12 Croatia BBB 13 Spain BBB 14 Brazil BB 15 Montenegro BB 16 Canada BB 17 Hungary BB 18 Slovakia BB 19 Macedonia BB 20 Argentina BB 21 Denmark BB 22 Poland BB 23 Portugal BB 24 Serbia BB 25 Germany BB 26 France BB 27 New Zealand BB 28 Latvia BB 29 Philippines BB 30 Taiwan BB 31 Slovenia BB 32 Italy BB 33 Finland B 34 Jamaica B 35 Czech Republic B 36 Nepal B 37 Romania B 38 Cyprus B 39 Paraguay B 40 United Arab Emirates B 41 Chile B 42 Nigeria B Rank Country Rating 43 Mexico B 44 Lithuania B 45 Iceland B 46 Bulgaria B 47 Indonesia B 48 Thailand B 49 Guatemala B 50 Israel B 51 Azerbaijan B 52 Nicaragua B 53 Greece B 54 Peru B 55 Estonia CCC 56 Jordan CCC 57 Luxembourg CCC 58 Ukraine CCC 59 India CCC 60 Bangladesh CCC 61 Costa Rica CCC 62 Zambia CCC 63 Albania CCC 64 Sri Lanka CCC 65 Belarus CCC 66 Senegal CCC 67 Barbados CCC 68 Uruguay CCC 69 Mauritius CCC 70 Sierra Leone CCC 71 Moldova CCC 72 Bosnia and Herzegovina CCC 73 Vietnam CCC 74 Mongolia CCC 75 Dominican Republic CCC 76 South Korea CCC 77 Armenia CCC 78 Uganda CCC 79 Cambodia CCC 80 Cameroon CCC 81 Ecuador CCC 82 Turkey CCC 83 Ghana CCC 84 Japan CCC Rank Country Rating 85 South Africa CCC 86 Panama CCC 87 Malaysia CCC 88 Trinidad and Tobago CCC 89 Colombia CCC 90 Benin CCC 91 China CCC 92 Kosovo CCC 93 Myanmar CCC 94 Malawi CCC 95 Egypt CC 96 Liberia CC 97 Bolivia CC 98 Honduras CC 99 Tajikistan CC 100 Gabon CC 101 Ethiopia CC 102 Côte d’Ivoire CC 103 El Salvador CC 104 Gambia CC 105 Kenya CC 106 Lao PDR CC 107 Guyana CC 108 Bahrain CC 109 Kazakhstan CC 110 Namibia CC 111 Togo CC 112 Mozambique CC 113 Botswana CC 114 Qatar CC 115 Rwanda CC 116 Madagascar CC 117 Timor-Leste CC 118 CapeVerde CC 119 Afghanistan CC 120 Burkina Faso CC 121 Mauritania CC 122 Venezuela CC 123 Burundi CC 124 Lesotho CC 125 Pakistan CC 126 Singapore CC Rank Country Rating 127 Lebanon C 128 Guinea C 129 Tunisia C 130 Brunei C 131 Oman C 132 Suriname C 133 Guinea-Bissau C 134 Yemen C 135 Kyrgyzstan C 136 Russia C 137 Tanzania C 138 Angola C 139 Algeria C 140 Cuba C 141 Djibouti C 142 Zimbabwe C 143 Niger C 144 Democratic Republic of the Congo C 145 Chad C 146 Mali C 147 Haiti C 148 Papua New Guinea C 149 Swaziland C 150 Sudan C 151 Kuwait C 152 Saudi Arabia C 153 South Sudan C 154 Hong Kong C 155 Somalia C 156 Morocco C 157 Turkmenistan D 158 Iraq D 159 Republic of the Congo D 160 Uzbekistan D 161 Equatorial Guinea D 162 Libya D 163 Central African Republic D 164 Eritrea D 165 Syria D 166 Iran D 167 North Korea D
  • 14. 27.26. Rating description Rating Numerical range Description AAA 59 to 64 The government has an implemented an effective and comprehensive response to all forms of modern slavery, with effective emergency and long-term reintegration victim support services, a strong criminal justice framework, high levels of coordination and collaboration, measures to address all forms of vulnerability, and strong government procurement policies and legislation to ensure that slavery is not present in business supply chains.There is no evidence of criminalisation or deportation of victims. AA 53 to 58 The government has implemented a comprehensive response to most forms of modern slavery, with strong victim support services, a robust criminal justice framework, demonstrated coordination and collaboration, measures to address vulnerability, and government procurement guidelines and/or supply chain policies or legislation to ensure that slavery is not present in business supply chains. A 47 to 52 The government has implemented key components of a holistic response to some forms of modern slavery, with strong victim support services, a strong criminal justice framework, demonstrated coordination and collaboration, measures to address vulnerability, and may have taken action to ensure that government procurement policies do not encourage slavery. BBB 41 to 46 The government has implemented key components of a holistic response to modern slavery, with victim support services, a strong criminal justice response, evidence of coordination and collaboration, and protections in place for vulnerable populations. Governments may be beginning to address slavery in supply chains of government procurement, or of businesses operating within their territory.There may be evidence that some government policies and practices may criminalise and/or cause victims to be deported. BB 35 to 40 The government has introduced a response to modern slavery, which includes short term victim support services, a criminal justice framework that criminalises some forms of modern slavery, a body to coordinate the response, and protections for those vulnerable to modern slavery.There may be evidence that some government policies and practices may criminalise and/or cause victims to be deported, and/or facilitate slavery. B 29 to 34 The government has introduced a response to modern slavery, with limited victim support services, a criminal justice framework that criminalises some forms of modern slavery, (or has recently amended inadequate legislation and policies), a body or mechanisms that coordinate the response, and has policies that provide some protection for those vulnerable to modern slavery.There is evidence that some government policies and practices may criminalise and/or deport victims, and/or facilitate slavery. Services may be provided by International Organisations (IOs)/ NGOs with international funding, sometimes with government monetary or in-kind support. CCC 23 to 28 The government has a limited response to modern slavery, with limited victim support services, a criminal justice framework that criminalises some forms of modern slavery, has a national action plan and/or national coordination body, and has policies that provide some protections for those vulnerable to modern slavery. There is evidence that some government policies and practices may criminalise and/or deport victims, and/ or facilitate slavery. Services may be largely provided by IOs/NGOs with international funding, with limited government funding or in-kind support. CC 17 to 22 The government has a limited response to modern slavery, with largely basic victim support services, a limited criminal justice framework, limited coordination or collaboration mechanism, and few protections for those vulnerable to modern slavery.There may be evidence that some government policies and practices facilitate slavery. Services are largely provided by IOs/NGOs with limited government funding or in-kind support. C 11 to 16 The government response to modern slavery is inadequate, with limited and/or few victim support services, a weak criminal justice framework, weak coordination or collaboration, while little is being done to address vulnerability.There are government practices and policies that facilitate slavery. Services, where available, are largely provided by IOs/NGOs with little government funding or in-kind support. D 0 to 10 The government has a wholly inadequate response to modern slavery, and/ or there is evidence of government sanctioned modern slavery. However, countries in this category may be experiencing high levels of poverty and internal conflict that may prevent, or hinder a response to modern slavery. Measuring vulnerability In 2014, the Global Slavery Index examines the relative vulnerability of the population in individual countries to modern slavery, based on an analysis of data across five dimensions: 1. National policies to combat modern slavery. 2. The availability of human rights protections in a country. 3. The level of economic and social development in a country. 4. The level of state stability in a country. 5. The extent of women’s rights and levels of discrimination in a country. In 2014, the ten countries where vulnerability is highest were: Somalia, Eritrea, Sudan,Yemen, the Democratic Republic of the Congo, the Central African Republic, Syria, Libya, North Korea, and Afghanistan. In an effort to better understand the relative significance of each of the dimensions noted above, we undertook statistical testing (bivariate analysis) to examine the correlations between these dimensions, and prevalence of modern slavery. Correlation results confirm that the relationship between each of these dimensions and prevalence is statistically significant. The strongest relationships (in order of strongest to weakest) are seen between: ●● State Stability and Prevalence (r = 0.55,p.01) ●● Human Rights and Prevalence (r = 0.53,p.01) ●● Development and Prevalence (r = 0.41,p.01) ●● Discrimination and Prevalence (r =0.40,p.01) ●● State Policy on Modern Slavery and Prevalence (r = 0.38,p.01) Each of these results is statistically significant indicating the relationship is not the result of chance (the closer r is to 1, the stronger the relationship between the two variables). The stability or instability of a country is a significant factor; protective policies will have little impact when a country’s rule of law has broken down because of civil war, or ethnic or religious conflict. In the Global Slavery Index the State Stability measure is an aggregate of factors that examine a country’s level of corruption, governance, independence of its judiciary, relative level of peace, political stability, level of violent crime, and availability of small arms and light weapons. Statistical testing confirms the relevance of modern slavery to conflict situations as we have seen this year in Syria and the horrors perpetrated by the terrorist group Islamic State. Correlation between state stability and prevalence (r = 0.55, p.01) 05101520 SLAVERY 0 20 40 60 80 STATE STABILITY VULNERABILITY
  • 15. 29.28. High levels of prejudice and discrimination in a society can create a context that marks some people as less important and less deserving of rights and protection, which in turn makes the crime of modern slavery easier to commit against them. In the Global Slavery Index seven variables are used to measure the extent and types of discrimination.These factors include factors of discrimination on the basis of sexual orientation, disability, immigration status, ethnicity, women’s political and economic rights, and the level of income inequality (Gini coefficient) in a given country. Statistical testing confirms the relationship between discrimination and prevalence of modern slavery. Correlation between discrimination vulnerability and prevalence (r =0.40, p.01) The full methodology is available in Appendix 2, and the full data table for vulnerability is in Appendix 3. 05101520 0 20 40 60 80 100 SLAVERY DISCRIMINATION VULNERABILITY Image – Panos Pictures
  • 16. Regional Analysis and Selected Country Studies Image – G.M.B.Akash
  • 17. BBB CCB CCC CCC CCCD CCC CC C BB CCC CCC BB C CCC CCC CC C CCC BB CCCB CCCC CCC B MONGOLIA CHINA NEPAL AUSTRALIA MYANMAR THAILAND NEW ZEALAND BANGLADESH INDIA SOUTH KOREANORTH KOREA AFGHANISTAN LAO PDR VIETNAM PHILIPPINES CAMBODIA TIMOR-LESTE PAPUA NEW GUINEA MALAYSIA INDONESIA SRI LANKA PAKISTAN JAPAN SINGAPORE BRUNEI HONG KONG, SAR CHINA TAIWAN 33.32. ASIA PACIFIC Estimated Number Living in Modern Slavery 23,542,800 Regional Proportion of Global Estimate 65.8% of 35.8 million people in modern slavery are in Asia Pacific Average Government Response Rating  CC Average Vulnerability Score 49.9% Prevalence Regional rank Country Percent of population in modern slavery Estimated population in modern slavery Population 1 India 1.141 14,285,700 1,252,139,596 2 Pakistan 1.130 2,058,200 182,142,594 3 Cambodia 1.029 155,800 15,135,169 4 Mongolia 0.907 25,700 2,839,073 5 Nepal 0.823 228,700 27,797,457 6 Thailand 0.709 475,300 67,010,502 7 Brunei 0.709 3,000 417,784 8 Malaysia 0.480 142,600 29,716,965 9 Bangladesh 0.435 680,900 156,594,962 10 Myanmar 0.435 231,600 53,259,018 11 Afghanistan 0.435 132,800 30,551,674 12 North Korea 0.435 108,200 24,895,480 13 Vietnam 0.359 322,200 89,708,900 14 Sri Lanka 0.359 73,600 20,483,000 15 Lao PDR 0.359 24,300 6,769,727 16 Timor-Leste 0.340 4,000 1,178,252 17 Indonesia 0.286 714,100 249,865,631 18 Philippines 0.266 261,200 98,393,574 19 China 0.239 3,241,400 1,357,380,000 20 Papua New Guinea 0.230 16,800 7,321,262 21 Japan 0.187 237,500 127,338,621 22 South Korea 0.187 93,700 50,219,669 23 Hong Kong 0.187 13,400 7,187,500 24 Singapore 0.100 5,400 5,399,200 25 Taiwan 0.013 3,000 23,340,000 26 Australia 0.013 3,000 23,130,900 27 New Zealand 0.013 600 4,470,800 In 2014, almost two-thirds (65.8 percent) of the estimated 35.8 million people in modern slavery globally are in the Asia Pacific region. Modern slavery exists in the Asia Pacific region in all its forms, including forced labour,7 trafficking for sexual exploitation, and forced marriage.8 Throughout the region, particularly in countries such as India and Pakistan, nationals – often including entire families – are enslaved through bonded labour in construction, agriculture, brick making, garment factories and manufacturing.Asian nationals who migrate for low and semi-skilled job opportunities abroad are disproportionately vulnerable to forced labour, particularly throughout the Middle East. Men from Nepal, Sri Lanka and Bangladesh working in the Middle East are in forced labour in the construction industry, while women from the same countries, and the Philippines and Indonesia, have been subject to sexual exploitation and modern slavery in domestic 7 “Increasing Evidence of Forced Labour Across Asia Says New IOM Report”, International Organisation for Migration, last modified January 8, 2013, accessed 18/08/14: http://www.iom.int/cms/en/sites/iom/home/news-and-views/press-briefing-notes/pbn-2013/pbn-listing/increasing-evidence- of-forced-la.html 8 Walk Free Foundation, Global Slavery Index, (Walk Free Foundation, 2013), p. 23, accessed 03/09/14: http://www.globalslaveryindex.org/ report/#view-online “When I was 13, my father arranged my marriage with a 45-year-old man, who promised my family money in exchange for me. I was very unhappy with him, but endured life with him for one year before running back to my home. My father was very angry when I returned. He beat me and yelled at me to return to my husband, but not even his heavy beatings were worse than life with my husband.When I refused to return, my father dug a deep hole in the ground. He forced me into it and began to bury me. I still wonder if he really would have buried me alive if the neighbours hadn’t heard my screaming and stopped him.”. Shahida, a 13 year old victim of forced marriage in Afghanistan. Low High Estimated Prevalence of Modern Slavery Government Response to Modern Slavery Rating AAAAAA BBB BB B CCC CC C DDD DD D The alphabetical depiction is a ‘rating’ of the strength of government responses to modern slavery.The highest possible rating is an AAA, and the lowest a D. The colour of the countries as shown on this map designate from lowest to highest prevalence of modern slavery. Those in grey were not included in the Index. “Stories of Hope – Shahida”, Hagar International, last modified 2012, accessed 16/10/14: http://hagarinternational.org/ international/shahida/ Image–PanosPictures
  • 18. 35.34. or carers work9 .The phenomenon of ‘baby-trafficking’10 – or selling babies under the guise of adoption – and human trafficking for the purpose of forced marriage is an increasing concern in parts of the Asia Pacific region.11 Within the Asia Pacific region, the combined totals of India, Pakistan andThailand equal almost 50 percent of the total number of people living in modern slavery globally.The high prevalence of modern slavery in the region reflects the reality that many countries in South and South East Asia provide the low-skilled labour at the production stage of global supply chains for various industries including food production, garments, and technology.12 There are also several countries within this region with low levels of prevalence, including Australia and New Zealand. Government Response Regional rank Country Survivors are supported Criminal justice Coordination and accountability Attitudes, social systems and institutions Business and government Rating 1 Australia 72.2 88.1 66.7 81.3 50 BBB 2 New Zealand 50 66.7 41.7 87.5 0 BB 3 Philippines 61.1 71.4 58.3 56.3 0 BB 4 Taiwan 61.1 61.9 50 62.5 0 BB 5 Nepal 44.4 73.8 58.3 62.5 0 B 6 Indonesia 50 54.8 50 62.5 0 B 7 Thailand 50 61.9 58.3 50 0 B 8 India 50 47.6 33.3 62.5 0 CCC 9 Bangladesh 38.9 61.9 50 50 0 CCC 10 Sri Lanka 38.9 33.3 58.3 62.5 0 CCC 11 Vietnam 38.9 45.2 58.3 43.8 0 CCC 12 Mongolia 50 59.5 16.7 50 0 CCC 13 South Korea 33.3 42.9 25 62.5 0 CCC 14 Cambodia 44.4 66.7 41.7 37.5 0 CCC 15 Japan 44.4 35.7 33.3 43.8 0 CCC 16 Malaysia 50 40.5 33.3 31.3 0 CCC 17 China 33.3 40.5 41.7 43.8 0 CCC 18 Myanmar 38.9 33.3 66.7 31.3 0 CCC 19 Lao PDR 27.8 54.8 41.7 25 0 CC 20 Timor-Leste 33.3 40.5 16.7 43.8 0 CC 21 Afghanistan 38.9 40.5 25 31.3 0 CC 22 Pakistan 33.3 33.3 33.3 31.3 0 CC 23 Singapore 33.3 19 41.7 31.3 0 CC 24 Brunei 22.2 35.7 16.7 37.5 0 C 25 Papua New Guinea 27.8 26.2 8.3 18.8 0 C 26 Hong Kong 27.8 14.3 16.7 25 0 C 27 North Korea 0 0 8.3 0 0 D 9 NishaVaria, Dispatches: New Protection for Saudi Arabia’s DomesticWorkers, (Human Rights Watch, 2014), accessed 03/09/14: http://www.hrw.org/news/2014/02/19/dispatches-new- protection-saudi-arabia-s-domestic-workers 10 “Child trafficking statistics”, All Girls Allowed, last modified 2013: http://www.allgirlsallowed.org/child-trafficking-statistics; See also Lizzy Parry,“Chinese Police bust four major baby trafficking rings rescuing 382 abducted infants and arresting nearly 2,000 suspects”, The Daily Mail, March 11, 2014, accessed 03/09/14: http://www.dailymail.co.uk/news/article-2570484/Chinese-police-bust-four-major-baby-trafficking-rings-rescuing-382-abducted-children-arresting-nearly-2-000-suspects.html 11 Asia Forum 9 Parliamentarians on Population and Development (AFPPD) and Global Alliance Against Traffic in Women (GAATW), HumanTrafficking in South-East Asia: Policy Brief, (AusAID, AFPPD, GAATW, 2013), accessed 18/08/14: http://www.afppd.org/files/1113/8206/9530/Policy_Brief.pdf 12 As above, p. 3 In 2013-14, governments throughout the Asia Pacific region continued to implement measures to combat modern slavery. Of the 25 countries measured in the region, 24 have legislation that criminalises some form of modern slavery. In particular, Australia and India implemented substantial legislative reforms to support the criminalisation of modern slavery, while Mongolia andVietnam adopted standalone anti-trafficking laws in 2012.13 North Korea is the only country in Asia Pacific – and in the world – that has not explicitly criminalised any form of modern slavery. Legislation on its own is not enough to ensure success of a criminal justice response to modern slavery.Accordingly, it is significant that 22 of the 25 countries in this region had some form of specialist law enforcement unit in place. For example, India improved law enforcement efforts by establishing 215 anti-human trafficking units across the country to investigate human trafficking cases.While impressive, funding was not always reflective of the individual units’ needs. Indian government data, for example, suggests only 13 offenders were convicted in 2013.14 In many countries, there is a gap between the policies that exist on paper and the reality of efforts to implement and enforce these in practice. One measure of this relates to efforts taken by countries to monitor implementation of their national action plans. Of the 17 countries in this region that have a national action plan to combat some form of modern slavery, only seven have an implementation strategy or national coordinating body to monitor the implementation of the plan. While countries in the Asia Pacific region have varying levels of economic development, not all of the wealthier countries in the region score strongly on government responses. Japan’s low score for government responses stands out given their relative wealth compared to countries in the region with comparatively stronger responses, such as Nepal and the Philippines. Despite several countries throughout the Asia Pacific region being at the production end of global supply chains, only Australia has made a policy commitment to address modern slavery throughout government procurement processes.15 Recent global scrutiny of Bangladeshi ready-made garment factories, the Thai16 and Bangladeshi17 shrimp industries, and fishing practices in New Zealand waters18 has revealed the pervasiveness of forced labour practices, including non-payment of wages, illegal confiscation of identity documents, restriction of movement, and sexual, physical and psychological abuse by employers.This highlights the need for governments to focus on the link between modern slavery and supply chains. Regional collaboration continued to be a focus, with various countries forming partnerships to support victim repatriation, cross-border investigations and prevention initiatives.The Association of South East Asian Nations (ASEAN) continued to be a leader in regional anti-trafficking initiatives; the 2014 Senior Officials Meeting on Transnational Crime (SOMTC) focused on continuing joint efforts to implement the Regional Plan of Action to Combat Trafficking in Persons (RPA).19 Over the last five years,Thailand and Myanmar have continued to strengthen their border cooperation to combat trafficking in persons, and member countries of the Coordinated Mekong Ministerial Initiative against Trafficking (COMMIT)20 – the sub-regional initiative coordinating responses to human trafficking in the Greater Mekong Sub-region – continue to undertake joint law enforcement training.21 13 Jargalan Avkhia , Naran Munkhbat Tirza Theunissen,“Mongolia Strengthens Efforts to Prevent and Combat Trafficking in Persons”, Asia Foundation, March 12, 2014, accessed 03/09/14: http://asiafoundation.org/in-asia/2014/03/12/mongolia-strengthens-efforts-to-prevent-and-combat-trafficking-in-persons/ 14 Ministry of Home Affairs, Data on HumanTrafficking during 2013, (Government of India, 2013), accessed 11/3/14: http://www.stophumantrafficking-mha.nic.in/writereaddata/DATA%20 ON%20HUMAN%20TRAFFICKING%20IN%20INDIA%20DURING%202013%20(As%20on%2021_01_2014).pdf 15 Government of Australia,“Progress Report”, Walk Free Foundation, last modified 30/04/14, accessed 03/09/14: http://www.globalslaveryindex.org/country/australia/ 16 The Hidden Cost: Human Rights Abuses inThailand’s Shrimp Industry, (Humanity United Environmental Justice Foundation, 2014), accessed 18/08/14: http://ejfoundation.org/sites/default/ files/public/shrimp_report_v44_lower_resolution.pdf 17 Impossibly Cheap:Abuse and Injustice in Bangladesh’s Shrimp Industry, (Environmental Justice Foundation, 2014), p. 4, accessed 02/09/14: http://ejfoundation.org/sites/default/files/public/ Impossibly_Cheap_Web.pdf 18 Christina Stringer, Glenn Simmons and Daren Coulston, Not in New Zealand’s waters, surely? Labour and human rights abuses abroad fishing vessels, (New Zealand Asia Institute Working Paper Series,2011), No. 11-01, accessed 02/09/14: http://docs.business.auckland.ac.nz/Doc/11-01-Not-in-New-Zealand-waters-surely-NZAI-Working-Paper-Sept-2011.pdf 19 “ASEAN Strengthens Cooperation in Fight Against Transnational Crime”, Association of Southeast Asian Nations, June 27, 2014, accessed 02/09/14: http://www.asean.org/news/asean- secretariat-news/item/asean-strengthens-cooperation-in-fight-against-transnational-crime 20 “COMMIT:The Coordinated Mekong Ministerial Initiative Against Trafficking”, United Nations Inter-Agency Project on HumanTrafficking, accessed 02/009/14: http://www.no-trafficking.org/ commit.html 21 United Nations Inter-Agency Project on HumanTrafficking (UNI-AP) Final Report Phase III: 2007 – 2014, (United Nations Inter-Agency Project on Human Trafficking, 2014), accessed 23/09/14: http://un-act.org/publication/view/uniap-final-report-phase-iii-2007-2014/ ASIA PACIFIC (continued)
  • 19. Image – Panos Pictures 37.36. Vulnerability (A higher score indicates higher vulnerability) Regional rank Country Slavery Policy Human Rights Development State Stability Discrimination Mean 1 North Korea 85.9 100 59.8 75.1 58.8 75.2 2 Afghanistan 78.8 69.8 91.9 79.3 54.4 75.1 3 Myanmar 68.2 91.8 71.8 61.8 64.5 72.3 4 Pakistan 85.9 79.2 60.4 68.9 60.0 69.5 5 Papua New Guinea 89.4 28.5 65.9 48.2 89.3 65.0 6 Cambodia 75.3 58.8 54.8 65.3 63.6 62.9 7 Lao PDR 61.1 97.3 61.5 49.8 50.0 62.6 8 China 57.6 91.9 42.2 46.2 53.3 59.0 9 Malaysia 78.8 77.4 35.6 30.4 71.5 58.1 10 Bangladesh 75.3 62.0 67.3 58.6 30.0 57.3 11 India 85.9 58.9 54.0 56.5 38.3 56.7 12 Sri Lanka 64.6 69.7 47.1 58.9 34.2 55.7 13 Vietnam 47.0 91.8 45.1 49.4 41.7 54.3 14 Timor-Leste 71.7 23.0 60.5 58.2 57.0 54.2 15 Indonesia 47.0 70.0 51.9 49.6 56.0 53.7 16 Nepal 61.1 61.7 64.9 50.7 30.1 53.2 17 Thailand 57.6 60.0 40.0 44.6 58.6 51.5 18 Brunei 43.4 86.7 36.6 30.3 67.0 51.4 19 Philippines 36.4 41.4 45.6 52.5 59.4 47.1 20 Mongolia 64.6 28.5 35.7 42.5 44.9 44.0 21 Singapore 22.2 51.9 28.2 16.8 59.4 35.1 22 South Korea 22.2 39.2 30.8 30.5 36.0 30.3 23 Japan 61.1 17.6 23.4 11.4 40.0 29.9 24 Hong Kong 64.6 3.5 21.1 10.9 25.2 25.0 25 Taiwan 11.6 28.4 17.1 27.7 28.9 22.7 26 New Zealand 15.1 8.6 26.6 6.6 6.8 12.7 27 Australia 11.6 2.9 24.8 13.5 15.1 11.5 As a region that spans Afghanistan in the north-west, New Zealand in the south-east, and Mongolia in the north, there is enormous variability in terms of vulnerability within the region. Most countries in the Asia Pacific region exhibit a range of pre-conditions to modern slavery, including weak rule of law, corruption, high levels of poverty, and crippling unemployment. Despite rapid economic progress throughout the region, over 800 million people live below the poverty line,22 and one billion people work for low wages, often in difficult or dangerous conditions with few or no rights.23 Combined with a highly mobile, unskilled workforce, reliance on remittances and lack of effective migration regulation, people in this region are some of the most vulnerable to modern slavery.24 At the other end of the spectrum, the Asia Pacific includes countries with high levels of development, stability and with strong policies presenting fewer vulnerabilities to modern slavery, such as Australia and New Zealand. 22 United Nations Economic and Social Commission for Asia and the Pacific,“Economic and Social Survey of Asia andThe Pacific 2013”, (United Nations Financial and Social Commission, 2013), accessed 18/08/14: http://www.unescap.org/publications/survey/surveys/survey2013.pdf 23 As above, p. vi 24 As above, p. 6, and Dovelyn Rannveig Agunias, Christine Aghazarm and Graziano Battistella, Labour Migration From Colombo Process Countries: Good Practices, Challenges andWay Forward, (International Organisation for Migration, 2012), accessed 18/08/14: http://publications.iom.int/bookstore/free/ColomboProcessStudy_final.pdf Regionally, North Korea presents the highest risk for people becoming enslaved.This is linked to government sanctioned forced labour, a dramatic absence of human rights provisions, and high levels of poverty.The recent UN Report of the Commission of Inquiry on Human Rights in the Democratic People’s Republic of Korea states that “prisoners in the ordinary prison system are systematically subjected to deliberate starvation and illegal forced labour”.25 Similar to countries such as Pakistan and Afghanistan, countries that experience internal conflict and governmental instability, have high levels of vulnerability. Countries like Australia, New Zealand, Japan and Taiwan have lower indicators of vulnerability, reflecting their strong rule of law and respect for human rights. However, as recent investigations into forced labour on fishing vessels in New Zealand waters revealed,26 these countries are still not immune to modern slavery. 25 Human Rights Council, Report of the Commission of Inquiry on Human Rights in the Democratic People’s Republic of Korea, (UN General Assembly, 2014), accessed 02/09/14: http://www.ohchr. org/EN/HRBodies/HRC/CoIDPRK/Pages/ReportoftheCommissionofInquiryDPRK.aspx 26 Christina Stringer, Glenn Simmons and Daren Coulston, “Not in New Zealand’s waters, surely? Labour and human rights abuses abroad fishing vessels”, (New Zealand Asia Institute Working Paper Series, 2011), No. 11-01, accessed 02/09/14: http://docs.business.auckland.ac.nz/Doc/11-01-Not-in-New-Zealand-waters-surely-NZAI-Working-Paper-Sept-2011.pdf ASIA PACIFIC (continued)
  • 20. BB BBB CCC BBBB BBB BB BB CCC B CCC A BB BBB BBB BB BB BB B CCC BB CCC BBB BB AA BBB B B B BBBB BBB BB CCC B BBB FINLAND POLAND GERMANY FRANCE NORWAY SPAIN SWEDEN SLOVAKIA ESTONIA LATVIA LITHUANIA HUNGARY SERBIA ROMANIA BULGARIA TURKEY GREECE MACEDONIA CYPRUS KOSOVO ALBANIAMONTENEGRO BOSNIA HERZEGOVINA CROATIAITALY SLOVENIAAUSTRIASWITZERLAND CZECH REPUBLIC NETHERLANDS DENMARK UNITED KINGDOMIRELAND ICELAND BELGIUM LUXEMBOURG PORTUGAL 39.38. EUROPE Estimated Number Living in Modern Slavery 566,200 Regional Proportion of Global Estimate 1.6% of 35.8 million people in modern slavery are in Europe Average Government Response Rating BB Average Vulnerability Score 27.8% Prevalence Regional rank Country Percent of population in modern slavery Estimated population in modern slavery Population 1 Bulgaria 0.380 27,600 7,265,115 2 Czech Republic 0.360 37,900 10,521,468 3 Hungary 0.360 35,600 9,897,247 4 Serbia 0.360 25,800 7,163,976 5 Slovakia 0.360 19,500 5,414,095 6 Croatia 0.360 15,300 4,252,700 7 Bosnia and Herzegovina 0.360 13,800 3,829,307 8 Lithuania 0.360 10,600 2,956,121 9 Albania 0.360 10,000 2,773,620 10 Macedonia 0.360 7,600 2,107,158 11 Slovenia 0.360 7,400 2,060,484 12 Estonia 0.360 4,800 1,324,612 13 Cyprus 0.360 4,100 1,141,166 14 Montenegro 0.360 2,200 621,383 15 Turkey 0.248 185,500 74,932,641 16 Kosovo 0.248 4,500 1,824,000 17 Poland 0.187 71,900 38,530,725 18 Romania 0.113 22,600 19,963,581 19 Latvia 0.113 2,300 2,013,385 20 Italy 0.019 11,400 59,831,093 21 Germany 0.013 10,500 80,621,788 22 France 0.013 8,600 66,028,467 23 United Kingdom 0.013 8,300 64,097,085 24 Spain 0.013 6,100 46,647,421 25 Netherlands 0.013 2,200 16,804,224 26 Belgium 0.013 1,500 11,195,138 27 Greece 0.013 1,400 11,032,328 28 Portugal 0.013 1,400 10,459,806 29 Sweden 0.013 1,200 9,592,552 30 Austria 0.013 1,100 8,473,786 31 Switzerland 0.013 1,100 8,081,482 32 Denmark 0.013 700 5,613,706 33 Finland 0.013 700 5,439,407 34 Norway 0.013 700 5,084,190 35 Luxembourg 0.013 100 543,202 36 Ireland 0.007 300 4,595,281 37 Iceland 0.007 100 323,002 “I don’t remember good things,” says 19 year old Elira when asked about her childhood in Albania. She often went hungry because her family was so poor. Her parents were abusive toward her, especially her mother. “Around age 14, my whole life crashed.” Elira recalls.After her parents divorced, she moved to Kosovo with her mother in search of a better life.“I worked as a waitress and the other part of the day as a dancer. My mother and her friend introduced me to different men with whom I had sexual relations. In those times, I didn’t think the way I think today”, Elira says.“Only now do I understand that I was a victim of exploitation”. Eventually Elira returned to Albania. She wanted to work in Greece, but lacking documentation, she was detained at the border. She told the police her story and was sent to Albania’s national reception centre for trafficking victims. There, she was referred to NGO Different and Equal, which provided her with counselling and skills training that helped her find work as a tailor.Today her life is back on track.“Now I can handle problems better”, Elira says. “I’m working and I’m feeling very good”. Elira, a 19 year old Albanian survivor of sexual exploitation. Low High Estimated Prevalence of Modern Slavery Government Response to Modern Slavery Rating AAAAAA BBB BB B CCC CC C DDD DD D The alphabetical depiction is a ‘rating’ of the strength of government responses to modern slavery.The highest possible rating is an AAA, and the lowest a D. The colour of the countries as shown on this map designate from lowest to highest prevalence of modern slavery. Those in grey were not included in the Index. United NationsVoluntary Trust Fund for Victims of Human Trafficking, HearTheir Story: Help Us ChangeTheir Lives, (United Nations Office for Drugs and Crime, 2013) p. 5, accessed 03/09/14: http://www.unodc. org/documents/human-trafficking/Fund/ UNVTF_brochure2013.pdf Image–KatieOrlinsky
  • 21. 41.40. Despite having the lowest regional prevalence of modern slavery in the world, men, women and children continue to be subjected to modern slavery within the European Union (EU). Recent cases include human trafficking into the cannabis growing industry in Ireland and forced begging in France.27 Nationals from European Union member states represent 65 percent of the presumed victims of human trafficking identified within the EU, although over recent years there has been a noted increase in non-EU victims.28 Trafficking for commercial sexual exploitation accounted for almost 70 percent of identified victims while trafficking for forced labour accounted for 19 percent.29 Cases of debt bondage and forced labour of nationals from Eastern Europe in Western Europe continues in the agricultural, construction and food processing sectors, as do situations of domestic servitude of non-EU nationals in the homes of diplomatic staff. In 2014,Turkey recorded the highest absolute numbers of modern slavery in the region, reflecting high numbers of child marriage30 , forced labour, and trafficking for sexual exploitation.31 Bulgaria recorded the highest prevalence in 2014.The global economic crisis and austerity measures of the EU have meant that increasing numbers of Bulgarians and Romanians migrate in search of highly paid jobs. Some of these workers can be tricked or coerced into situations of exploitation.32 Poland also recorded high prevalence of modern slavery in 2014 due, in part, to the exploitation of cheap migrant labourers within Poland from nearby Eastern European countries and parts of South East Asia.33 27 “Used in Europe” accessed 18/10/14: usedineurope.com 28 Trafficking in Human Beings, (Eurostat European Union, 2014) p. 11, accessed 19/10/14: ec.europa.eu/dgs/home-affairs/what-is-new/news/news/docs/20141017_working_paper_on_ statistics_on_trafficking_in_human_beings_en.pdf 29 As above 30 “Turkey: Child Marriage” (UNFPA, n.d.), accessed 17/10/14: http://www.unfpa.org/webdav/site/eeca/shared/documents/publications/Turkey%20English.pdf 31 Country Profiles – Europe and Central Asia, (United Nations Office on Drugs and Crime, 2013), p.125, accessed 04/04/14: https://www.unodc.org/documents/data-and-analysis/glotip/ Country_Profiles_Europe_Central_Asia.pdf. 32 José Mendes Bota, Prostitution, trafficking and modern slavery in Europe, (Council of Europe Parliamentary Assembly, Committee on Equality and Non-Discrimination March 20, 2014), p. 8 , accessed 08/09/14: http://www.assembly.coe.int/nw/xml/XRef/X2H-Xref-ViewPDF.asp?FileID=20559lang=en 33 Office to Monitor and Combat Trafficking in Persons, Trafficking in Persons Report: Poland Country Narrative (United States Department of State, 2014), p. 317, accessed 25/10/14: http:// www.state.gov/documents/organization/226848.pdf; field sources, 2014. See also, Zbigniew Lasocik Lukasz Wieczorek,“Trafficking for Forced Labour in Poland – Research Report” in Trafficking for Forced Labour and Labour Exploitation (FLEX) – towards increased knowledge, cooperation and exchange of information in Estonia, Finland and Poland, Anniina Jokinen, Natalia Ollus and Kauko Aromaa (eds.) (Warsaw: Heuni, 2011). accessed 06/03/14: http://www.heuni.fi/material/attachments/heuni/reports/6KmRLQd2d/HEUNl_report_68_netti.pdf Government Response Regional rank Country Survivors are supported Criminal justice Coordination and accountability Attitudes, social systems and institutions Business and government Rating 1 Netherlands 88.9 95.2 91.7 87.5 0 AA 2 Sweden 77.8 88.1 66.7 87.5 0 A 3 Switzerland 72.2 81 75 68.8 0 BBB 4 Ireland 66.7 81 75 75 0 BBB 5 Norway 66.7 81 75 68.8 0 BBB 6 United Kingdom 77.8 81 66.7 81.3 0 BBB 7 Belgium 55.6 88.1 58.3 75 0 BBB 8 Austria 72.2 81 58.3 68.8 0 BBB 9 Croatia 66.7 73.8 75 75 0 BBB 10 Spain 72.2 73.8 58.3 68.8 0 BBB 11 Montenegro 83.3 81 66.7 43.8 0 BB 12 Hungary 55.6 73.8 66.7 68.8 0 BB 13 Slovakia 66.7 66.7 66.7 62.5 0 BB 14 Macedonia 72.2 59.5 83.3 50 0 BB 15 Denmark 66.7 66.7 58.3 62.5 0 BB 16 Poland 61.1 73.8 75 50 0 BB 17 Portugal 66.7 66.7 75 50 0 BB 18 Serbia 66.7 81 50 56.3 0 BB 19 Germany 61.1 66.7 58.3 56.3 0 BB 20 France 50 81 50 68.8 0 BB 21 Latvia 61.1 81 58.3 50 0 BB 22 Slovenia 61.1 73.8 58.3 43.8 0 BB 23 Italy 66.7 71.4 41.7 50 0 BB 24 Finland 61.1 59.5 66.7 56.3 0 B 25 Czech Republic 44.4 73.8 58.3 62.5 0 B 26 Romania 50 66.7 50 75 0 B 27 Cyprus 61.1 76.2 58.3 37.5 0 B 28 Lithuania 50 61.9 58.3 50 0 B 29 Iceland 44.4 54.8 66.7 50 0 B 30 Bulgaria 50 59.5 58.3 50 0 B 31 Greece 55.6 54.8 50 50 0 B 32 Estonia 55.6 45.2 50 43.8 0 CCC 33 Luxembourg 50 73.8 33.3 31.3 0 CCC 34 Albania 61.1 52.4 41.7 37.5 0 CCC 35 Bosnia and Herzegovina 50 59.5 41.7 31.3 0 CCC 36 Turkey 38.9 52.4 41.7 31.3 0 CCC 37 Kosovo 38.9 61.9 50 18.8 0 CCC EUROPE (continued)
  • 22. 43.42. Globally, Europe was the strongest performing region in terms of how well the governments are tackling modern slavery. In large part, this reflects the strength of regional efforts through the European Union and Council of Europe mechanisms to implement commitments under a regional treaty – the Council of Europe Convention on Action against Trafficking in Human Beings. 42 European countries have ratified or acceded to the Convention,34 which aims to prevent trafficking, protect the human rights of victims of trafficking, and prosecute traffickers.35 The Convention established the Council of Europe’s Group of Experts on Action against Trafficking in Human Beings (GRETA) monitoring and reporting mechanism, which is responsible for holding governments in the region accountable to their commitments under the Convention.36 All countries in Europe criminalise modern slavery, either as distinct offenses in their criminal codes, or through standalone trafficking legislation.All countries have also established some form of legal framework to allow victims to access justice; the Netherlands, Ireland, and Norway, for example, have legal services for victims, witness protection systems, and some recognition that child victims require specialized services. Despite this, there remains a real risk in many countries that victims may be criminalised for actions committed while under the control of criminals, or detained on immigration offences. In Norway, for example, there have been reports of victims being held in detention due to their irregular immigration status;37 in France, child victims have been arrested for soliciting and theft38 ; and in the UK, support organisations who identify non-EU victims of modern slavery reportedly do not refer them to the National Referral Mechanism, for fear they would be removed from the UK.39 The Netherlands and Sweden lead the government response globally and in Europe, demonstrating the highest outcomes in measurements on criminal justice and addressing vulnerability to modern slavery. Both countries have undertaken research on modern slavery, have extensive public information campaigns, and have comprehensive protections in place for domestic40 and migrant workers.41 Austria has seriously focused on the protection of domestic workers of diplomats and staff of international organisations in recent years.Additional measures were introduced in 2012 to ensure all domestic workers have their own bank account and they are required to present annually to the Austrian Ministry for European and International Affairs for a welfare check.42 When economic capacity is taken into account, Montenegro and Macedonia are performing relatively well on government responses. Montenegro, for example, has victim assistance programmes available for all victims of modern slavery, including men, women and children.At the other end of the scale, despite having strong economies, the Governments of Iceland and Luxembourg are doing very little to address modern slavery. Ensuring that business and governments through their public procurement stop sourcing goods and services that use modern slavery remains insufficient across many countries and still represents the greatest gap in government responses to modern slavery across Europe. 34 Belarus is the only non-member state to accede to the Convention. Estonia and Turkey have signed but not yet ratified the Convention. See current signatures and ratification of the Convention at the Council of Europe website: http://www.coe.int/t/dghl/monitoring/trafficking/Flags-sos_en.asp 35 Council of Europe Convention and its Explanatory Report, (Warsaw, 16.V.2005)”, Council of Europe, accessed 18/09/14: http://www.coe.int/t/dghl/monitoring/trafficking/Docs/Convntn/ CETS197_en.asp#TopOfPage 36 “GRETA”, Council of Europe, accessed 18/09/14: http://www.coe.int/t/dghl/monitoring/trafficking/Docs/Monitoring/GRETA_en.asp 37 Group of Experts on Action against Trafficking in Human Beings, Report concerning the implementation of the Council of Europe Convention on Action againstTrafficking in Human Beings by Norway,(2013), p. 51: accessed on 06/04/2014, http://www.coe.int/t/dghl/monitoring/trafficking/docs/Reports/GRETA_2013_5_FGR_NOR_with_cmnts_en.pdf 38 Office to Monitor and Combat Trafficking in Persons,Trafficking in Persons Report: France Country Narrative, (United States Department of State, 2014), p. 179, accessed 30/07/14: http://www. state.gov/documents/organization/226845.pdf. 39 The UK is currently undergoing an evaluation of the National Referral Mechanism. See – Group of Experts on Action against Trafficking in Human Beings, Report concerning the implementation of the Council of Europe Convention on Action againstTrafficking in Human Beings by the United Kingdom: First evaluation round, (Strasbourg, 2012) p. 7, accessed 3/08/14: http://www. coe.int/t/dghl/monitoring/trafficking/docs/Reports/GRETA_2012_6_FGR_GBR_en.pdf 40 Group of Experts on Action against Trafficking in Human Beings, Report concerning the implementation of the Council of Europe Convention on Action againstTrafficking in Human Beings byThe Netherlands, (Council of Europe, 2014), p. 39 accessed: 31/07/2014, http://www.coe.int/t/dghl/monitoring/trafficking/Docs/Reports/GRETA_2014_10_FGR_NLD_w_cmnts_en.pdf 41 Group of Experts on Action against Trafficking in Human Beings, Report concerning the implementation of the Council of Europe Convention on Action againstTrafficking in Human Beings by Sweden, (Council of Europe, 2014): p. 32, accessed on 06/18/2014, http://www.coe.int/t/dghl/monitoring/trafficking/docs/Reports/GRETA_2014_11_FGR_SWE_en.pdf 42 “Austria:Together Against Trafficking in Human Beings”, European Commission, last modified 05/05/14: http://ec.europa.eu/anti-trafficking/NIP/Austria Vulnerability (A higher score indicates higher vulnerability) Regional rank Country Slavery Policy Human Rights Development State Stability Discrimination Mean 1 Turkey 50.5 63.7 39.6 44.2 62.9 50.9 2 Albania 47.0 43.6 36.0 57.0 55.3 46.3 3 Bosnia and Herzegovina 29.3 57.2 34.9 46.4 53.8 45.7 4 Greece 36.4 49.8 30.2 43.3 50.9 41.4 5 Kosovo 22.2 45.0 36.3 48.4 56.3 40.9 6 Montenegro 36.4 38.8 30.3 49.5 49.0 40.8 7 Macedonia 25.8 41.7 33.7 54.9 46.0 39.7 8 Romania 25.8 50.1 34.8 42.8 40.6 38.1 9 Latvia 43.4 34.8 30.0 38.8 45.1 37.7 10 Serbia 25.8 45.4 34.1 43.2 40.2 37.0 11 Bulgaria 22.2 42.4 30.9 47.9 34.1 35.5 12 Hungary 54.0 30.8 33.8 22.1 32.4 35.3 13 Lithuania 47.0 36.4 24.5 27.1 44.3 35.2 14 Croatia 43.4 33.8 30.8 30.3 37.0 33.7 15 Estonia 50.5 13.2 28.1 24.6 43.5 30.6 16 Cyprus 25.8 27.7 29.0 20.7 46.0 29.8 17 Italy 32.8 21.9 24.0 38.1 31.3 29.6 18 Slovakia 11.6 28.5 31.2 39.3 33.4 28.8 19 Poland 1.0 21.7 27.1 22.2 48.2 25.5 20 Czech Republic 8.1 27.9 28.7 17.7 37.6 24.0 21 France 25.8 25.8 28.0 21.0 23.9 22.8 22 Spain 15.1 27.9 22.8 22.6 17.6 22.7 23 Switzerland 32.8 23.3 21.1 10.6 25.5 22.0 24 Portugal 18.7 13.0 28.2 17.0 29.7 21.4 25 Ireland 18.7 18.1 27.1 16.7 19.5 20.7 26 Slovenia 4.5 15.1 29.6 16.1 34.8 20.7 27 Iceland 54.0 19.0 22.4 12.1 3.0 20.0 28 Denmark 43.4 16.8 25.2 3.5 6.2 18.4 29 Germany 11.6 24.7 25.1 14.4 12.2 17.6 30 Luxembourg 32.8 2.4 10.9 9.9 21.6 17.0 31 Belgium 4.5 18.1 26.8 14.9 15.9 16.0 32 Finland 4.5 22.2 26.2 8.9 14.4 16.0 33 United Kingdom 8.1 10.3 17.1 18.4 17.6 15.1 34 Austria 4.5 17.3 23.9 14.4 14.4 14.9 35 Sweden 8.1 15.7 26.5 10.1 10.9 13.5 36 Netherlands 11.6 9.2 25.1 13.5 8.4 11.4 37 Norway 11.6 16.0 25.6 7.8 2.5 11.3 With regard to vulnerability to modern slavery, European countries consistently rank high on indices of peace, democracy, anti-corruption, human rights and access to social services.Turkey,Albania, Bosnia and Herzegovina, Greece, and Kosovo collectively represent the five most vulnerable countries in the region due in part to high discrimination measures, poor state stability, and weaker human rights safeguards.Turkey has recorded the highest vulnerability ratings for modern slavery. High levels of irregular migration, proximity to conflict zones in Syria and Iraq and discrimination against minority groups impact vulnerability within Turkey. Higher levels of unemployment across Europe over the past five years increase the vulnerability of those seeking work abroad.As a destination for migrants and refugees from conflicts in neighbouring regions, particularly the Middle East and North Africa, European countries face the problems associated with heightened risks to trafficking and labour exploitation among these populations. EUROPE (continued)