TrustArc Webinar - Unlock the Power of AI-Driven Data Discovery
Data mining chapter04and5-best
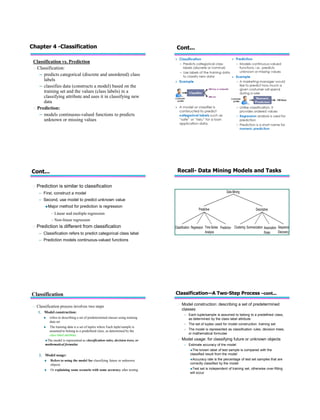
1. Classification vs. Prediction
Classification:
– predicts categorical (discrete and unordered) class
labels
– classifies data (constructs a model) based on the
training set and the values (class labels) in a
classifying attribute and uses it in classifying new
data
Prediction:
– models continuous-valued functions to predicts
unknown or missing values
Chapter 4 -Classification Cont...
Cont...
Prediction is similar to classification
– First, construct a model
– Second, use model to predict unknown value
Major method for prediction is regression
– Linear and multiple regression
– Non-linear regression
Prediction is different from classification
– Classification refers to predict categorical class label
– Prediction models continuous-valued functions
Recall- Data Mining Models and Tasks
Classification
Classification process involves two steps
1. Model construction:
refers to describing a set of predetermined classes using training
data set
The training data is a set of tuples where Each tuple/sample is
assumed to belong to a predefined class, as determined by the
class label attribute
The model is represented as classification rules, decision trees, or
mathematical formulae
2. Model usage:
Refers to using the model for classifying future or unknown
objects
Or explaining some scenario with some accuracy after testing
Classification—A Two-Step Process –cont...
Model construction: describing a set of predetermined
classes
– Each tuple/sample is assumed to belong to a predefined class,
as determined by the class label attribute
– The set of tuples used for model construction: training set
– The model is represented as classification rules, decision trees,
or mathematical formulae
Model usage: for classifying future or unknown objects
– Estimate accuracy of the model
The known label of test sample is compared with the
classified result from the model
Accuracy rate is the percentage of test set samples that are
correctly classified by the model
Test set is independent of training set, otherwise over-fitting
will occur
2. Classification Process (1): Model Construction
Training
Data
NAME RANK YEARS TENURED
Mike Assistant Prof 3 no
Mary Assistant Prof 7 yes
Bill Professor 2 yes
Jim Associate Prof 7 yes
Dave Assistant Prof 6 no
Anne Associate Prof 3 no
Classification
Algorithms
IF rank = ‘professor’
OR years > 6
THEN tenured = ‘yes’
Classifier
(Model)
Classification Process (2): Use the Model in Prediction
Classifier
Testing
Data
NAME RANK YEARS TENURED
Tom Assistant Prof 2 no
Merlisa Associate Prof 7 no
George Professor 5 yes
Joseph Assistant Prof 7 yes
Unseen Data
(Jeff, Professor, 4)
Tenured?
Supervised vs. Unsupervised Learning
Supervised learning (classification)
– Supervision: The training data (observations, measurements,
etc.) are accompanied by labels indicating the class of the
observations
– New data is classified based on the training set
Unsupervised learning (clustering)
– The class labels of training data is unknown
– Given a set of measurements, observations, etc. with the aim
of establishing the existence of classes or clusters in the data
– Usually classification follows after clustering
Issues regarding classification and prediction: Data
Preparation
Data cleaning
– Preprocess data in order to reduce noise and
handle missing values
Relevance analysis (feature selection)
– Remove the irrelevant or redundant attributes
Data transformation
– Generalize and/or normalize data
Issues regarding classification and prediction :
Evaluating Classification Methods
Predictive accuracy
– Measure how accurate is the classifier to predict object class label
Speed
– This refers to the computational costs involved in generating and using the
given classifier or predictor
– time to construct the model
– time to use the model
Scalability
– This refers to the ability to construct the classifier or predictor efficiently
given large amounts of data
Robustness
– This is the ability of the classifier or predictor to make correct predictions
given noisy data or data with missing values
Interpretability:
– This refers to the level of understanding and insight that is provided by the
classifier or predictor.
Classification: Technical Definition
Given a collection of records (training set )
– Each record contains a set of attributes, one of the
attributes is the class.
Find a model for class attribute as a function
of the values of other attributes.
Goal: previously unseen records should be
assigned a class as accurately as possible.
– A test set is used to determine the accuracy of the
model. Usually, the given data set is divided into
training and test sets, with training set used to build
the model and test set used to validate it.
3. Thus Classification
Classification is a data mining (machine learning) technique
used to predict group membership for data instances.
Given a collection of records (training set), each record
contains a set of attributes, one of the attributes is the class.
– Find a model for class attribute as a function of the values of other
attributes.
Goal: previously unseen records should be assigned a class
as accurately as possible. A test set is used to determine the
accuracy of the model.
– Usually, the given data set is divided into training and test sets, with
training set used to build the model and test set used to validate it.
For example, one may use classification to predict whether the weather
on a particular day will be “sunny”, “rainy” or “cloudy”.
Illustrating Classification Task
Apply
Model
Induction
Deduction
Learn
Model
Model
Tid Attrib1 Attrib2 Attrib3 Class
1 Yes Large 125K No
2 No Medium 100K No
3 No Small 70K No
4 Yes Medium 120K No
5 No Large 95K Yes
6 No Medium 60K No
7 Yes Large 220K No
8 No Small 85K Yes
9 No Medium 75K No
10 No Small 90K Yes
10
Tid Attrib1 Attrib2 Attrib3 Class
11 No Small 55K ?
12 Yes Medium 80K ?
13 Yes Large 110K ?
14 No Small 95K ?
15 No Large 67K ?
10
Test Set
Learning
algorithm
Training Set
Classification methods
Goal: Predict class Ci = f(x1, x2, .. Xn)
There are various classification methods. Popular
classification techniques include the following.
– Decision tree classifier: divide decision space into
piecewise constant regions.
– Rule based – Association based classifier
– K-Nearest Neighbour: classify based on similarity
measurement
– Neural networks: partition by non-linear boundaries
– Bayesian network: a probabilistic model
– Support vector machine: solves non-linearly separable
problems
Simple classification using decision tree
Decision tree classifier
Decision tree performs classification by constructing a tree
based on training instances with leaves having class labels.
– The tree is traversed for each test instance to find a leaf,
and the class of the leaf is the predicted class. This is a
directed knowledge discovery in the sense that there is a
specific field whose value we want to predict.
Widely used learning method. It has been applied to:
– classify medical patients based on the disease,
– equipment malfunction by cause,
– loan applicant by likelihood of payment.
– Accidents by severity
Pros and Cons of decision trees
Cons
- Cannot handle complicated
relationship between features
- simple decision boundaries
- problems with lots of missing
data
Pros
• Reasonable training time
• Fast application
• Easy to interpret
• Easy to implement
• Can handle large number of
features
Why decision tree induction in data mining?
• Relatively faster learning speed (than other classification
methods)
• Convertible to simple and easy to understand
classification if-then-else rules
• Comparable classification accuracy with other methods
• Does not require any prior knowledge of data
distribution, works well on noisy data.
4. Chapter 5 - Cluster Analysis
What is Cluster Analysis?
Cluster: a collection of data objects
– Similar to one another within the same cluster
– Dissimilar to the objects in other clusters
Cluster analysis
– Grouping a set of data objects into clusters
Clustering is unsupervised classification: no predefined classes
Typical applications
– As a stand-alone tool to get insight into data distribution
– As a preprocessing step for other algorithms
Clustering cont…
Given a set of points, with a
notion of distance between
points, group the points into
some number of clusters, so
that members of a cluster are
in some sense as close to
each other as possible.
While data points in the
same cluster are similar, those
in separate clusters are
dissimilar to one another.
x x
x x x x
x x x x
x x x
x x
x
xx x
x x
x x x
x
x x x
x
x x
x x x x
x x x
x
• Clustering is a data mining (machine learning) technique that
finds similarities between data according to the characteristics
found in the data & groups similar data objects into one cluster
Cont…
Thus Cluster Analysis
– Finding groups of objects such that the objects in a group will be
similar (or related) to one another and different from (or unrelated
to) the objects in other groups
Inter-cluster
distances are
maximized
Intra-cluster
distances are
minimized
Quality: What Is Good Clustering?
• A good clustering method will produce high quality clusters
with
– high intra-class similarity
– low inter-class similarity
• The quality of a clustering result depends on both the
similarity measure used by the method and its
implementation
– Key requirement of clustering: Need a good measure of similarity
between instances.
• The quality of a clustering method is also measured by its
ability to discover some or all of the hidden patterns in the
given datasets
5. Requirements of Clustering in Data Mining
Scalability
– Highly scalable algorithms are needed for clustering on large databases like DW
Ability to deal with different types of attributes
– Clustering may be performed also on binary, categorical and ordinal data
Discovery of clusters with arbitrary shape
– Most algorithms tend to find spherical clusters
Minimal requirements for domain knowledge to determine input parameters
– Clustering results are quite sensitive to the input parameters
– Parameters are often difficult to determine
Able to deal with noise and outliers
Insensitive to order of input records
High dimensionality
– DW can contain several dimensions
Incorporation of user-specified constraints
Interpretability and usability
Example: Clustering Application
• Text/Document Clustering:
– Goal: To find groups of documents that are similar
to each other based on the important terms
appearing in them.
– Approach:
–To identify frequently occurring terms in each
document.
–Form a similarity measure based on the frequencies
of different terms and use it to cluster documents.
–Gain: Information Retrieval can utilize the clusters
to relate a new document or search term to clustered
documents.
Cont…
Applications of Cluster Analysis can be for
– Understanding
Group related documents for browsing,
group genes and proteins that have similar
functionality, or group stocks with similar
price fluctuations
– Summarization
Reduce the size of large data sets
What is not Cluster Analysis?
Supervised classification
– Have class label information
Simple segmentation
– Dividing students into different registration groups
alphabetically, by last name
Results of a query
– Groupings are a result of an external specification
Types of Clusters
Major types : Well-separated clusters and Center-based
clusters
Well-Separated Clusters:
– A cluster is a set of points such that any point in a cluster is
closer (or more similar) to every other point in the cluster than
to any point not in the cluster.
3 well-separated clusters
Types of Clusters: Center-Based
Center-based
– A cluster is a set of objects such that an object in a cluster is
closer (more similar) to the “center” of a cluster, than to the
center of any other cluster
– The center of a cluster is often a centroid, the average of all
the points in the cluster, or a medoid, the most “representative”
point of a cluster
4 center-based clusters
6. Type of data in clustering analysis
Data types of variables are different
The difference need proper distance computation logic for
cluster analysis
Some of the types of data we have are:
– Interval-scaled variables
– Binary variables
– Nominal, and ordinal
– mixed types:
Interval-valued variables
This are values of variables of an object which are characterized
by its continuous nature of the measurement such as height,
weight, age
As the measurement unit affect cluster distance, we need
preprocessing that avoid the effect of unit of measurement
This is called standardization
Binary Variables
A binary variable is a variable which has only two possible values (1 or 0,
yes or no, etc)
– For example smoker, educated, Ethiopian, IsFemale etc
Nominal Variables
A generalization of the binary variable in that it can take more than 2 states,
e.g., red, yellow, blue, green
Ordinal Variables
An ordinal variable can be discrete or continuous
order is important, e.g., rank
Variables of Mixed Types
A database may contain different types of variables
– symmetric binary, asymmetric binary,
nominal, ordinal, interval.
One may use
– a weighted formula to combine their effects.
– Or preprocess the data so that it fits to the techniques
requirement
Major Clustering Approaches
Partitioning clustering approach:
– Construct various partitions and then evaluate them by some criterion, e.g.,
minimizing the sum of square errors
– Typical methods:
distance-based: K-means clustering
model-based: expectation maximization (EM) clustering.
Hierarchical clustering approach:
– Create a hierarchical decomposition of the set of data (or objects) using some
criterion
– Typical methods:
agglomerative Vs divisive
single link Vs complete link