Section 1: One Sample Hypothesis Testing Research Question: Is average January snowfall rate
significantly greater than 53cm ? The Excel spreadsheet entitled "Ottawa_Snowv2.xls" lists the
monthly snowfall for each month from 1890 to 2001 . The first column is the year; the second
column is the snowfall amounts for September; the third column for October and so on. - Open the
monthly snowfall data in Excel. - Open the spreadsheet called "Assignment_4 hypothesis
tests.xIs". Make sure to select the worksheet entitled 'One-Sample'. - Copy the relevarit monthly
data from the Ottawa_Snowv2 spreadsheet to the Assignment_4 hypothesis test spreadsheet.
The data needs to be pasted in column D (red). - In the grey boxes, enter the degrees of freedom
and hypothesized mean, or the population mean you are comparing to the monthly snowfall (this
will come from the research question). For the hypothesis test results, answer the following.
Question 1: i. state your null hypothesis and alternative hypothesis. Be specific and do not use
generic forms in your answer. (1 mark) ii. specify your significance level and critical statistic (you
can get this value from a table) (1 mark) iii. include the test results from Excel (cut the output from
Excel and paste it into Word). Only include the statistics. ( 1 mark) iv. state whether the null
hypothesis should be rejected or accepted based on p-value and explain why (2 marks). Make
sure to state the p-value and test value ( Z-statistic or T-statistic) in your answer. v. finally, what is
your answer regarding the research question (2 marks)4.0 20 0.0
123456789111111111122222222223333333334444444444555555555666666666677777777778
8
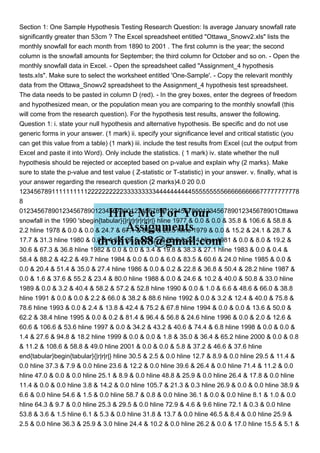
012345678901234567890123456789012345678901234567890123456789012345678901Ottawa
snowfall in the 1990 'sbegin{tabular}{|r|r|r|r|r|r|r|} hline 1977 & 0.0 & 0.0 & 35.8 & 106.6 & 58.8 &
2.2 hline 1978 & 0.0 & 0.0 & 24.7 & 67.1 & 86.2 & 25.5 hline 1979 & 0.0 & 15.2 & 24.1 & 28.7 &
17.7 & 31.3 hline 1980 & 0.0 & 4.6 & 27.5 & 66.5 & 28.8 & 22.4 hline 1981 & 0.0 & 8.0 & 19.2 &
30.6 & 67.3 & 36.8 hline 1982 & 0.0 & 0.0 & 3.4 & 19.8 & 38.3 & 27.1 hline 1983 & 0.0 & 0.4 &
58.4 & 88.2 & 42.2 & 49.7 hline 1984 & 0.0 & 0.0 & 6.0 & 83.5 & 60.6 & 24.0 hline 1985 & 0.0 &
0.0 & 20.4 & 51.4 & 35.0 & 27.4 hline 1986 & 0.0 & 0.2 & 22.8 & 36.8 & 50.4 & 28.2 hline 1987 &
0.0 & 1.6 & 37.6 & 55.2 & 23.4 & 80.0 hline 1988 & 0.0 & 24.6 & 10.2 & 40.0 & 50.8 & 33.0 hline
1989 & 0.0 & 3.2 & 40.4 & 58.2 & 57.2 & 52.8 hline 1990 & 0.0 & 1.0 & 6.6 & 48.6 & 66.0 & 38.8
hline 1991 & 0.0 & 0.0 & 2.2 & 66.0 & 38.2 & 88.6 hline 1992 & 0.0 & 3.2 & 12.4 & 40.0 & 75.8 &
78.6 hline 1993 & 0.0 & 2.4 & 13.8 & 42.4 & 75.2 & 67.8 hline 1994 & 0.0 & 0.0 & 13.6 & 50.0 &
62.2 & 38.4 hline 1995 & 0.0 & 0.2 & 81.4 & 96.4 & 56.8 & 24.6 hline 1996 & 0.0 & 2.0 & 12.6 &
60.6 & 106.6 & 53.6 hline 1997 & 0.0 & 34.2 & 43.2 & 40.6 & 74.4 & 6.8 hline 1998 & 0.0 & 0.0 &
1.4 & 27.6 & 94.8 & 18.2 hline 1999 & 0.0 & 0.0 & 1.8 & 35.0 & 36.4 & 65.2 hline 2000 .